

The DOI matches its Crossref record; 55 of the 55 references it cites were found in a registry or an index.
Isolation and characterization of platelet-derived extracellular vesicles
Open accessAbstract
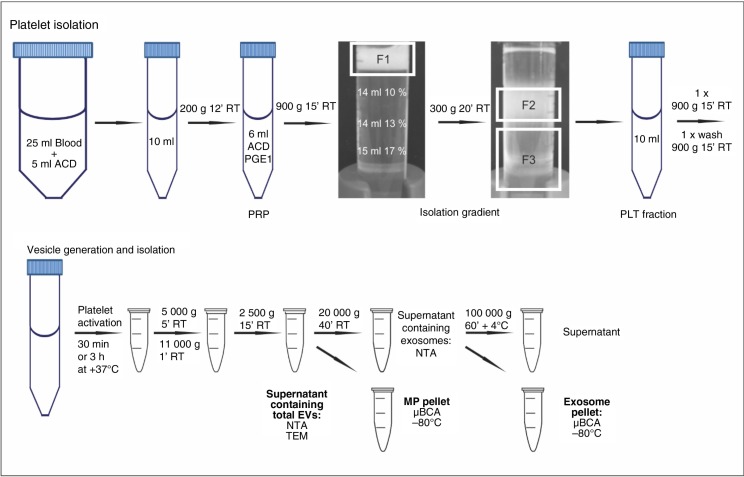
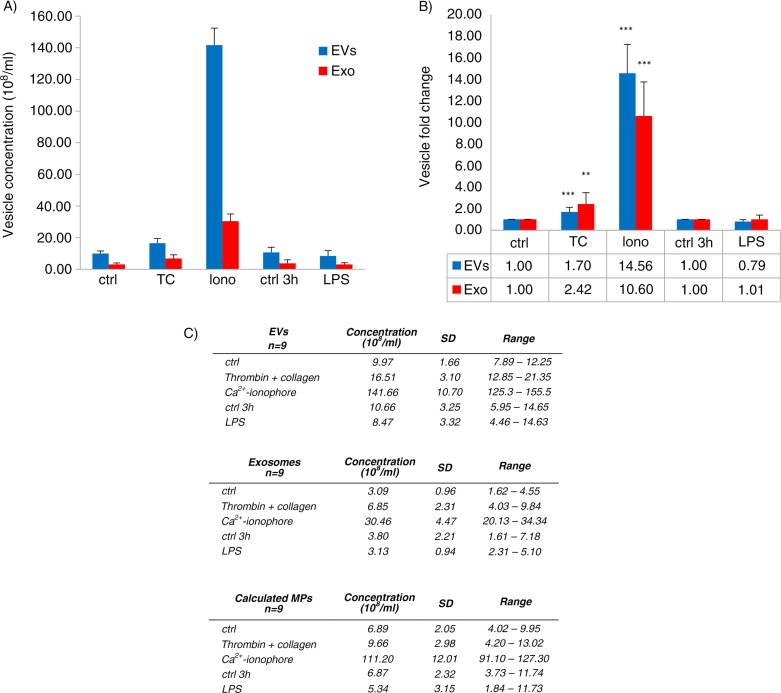
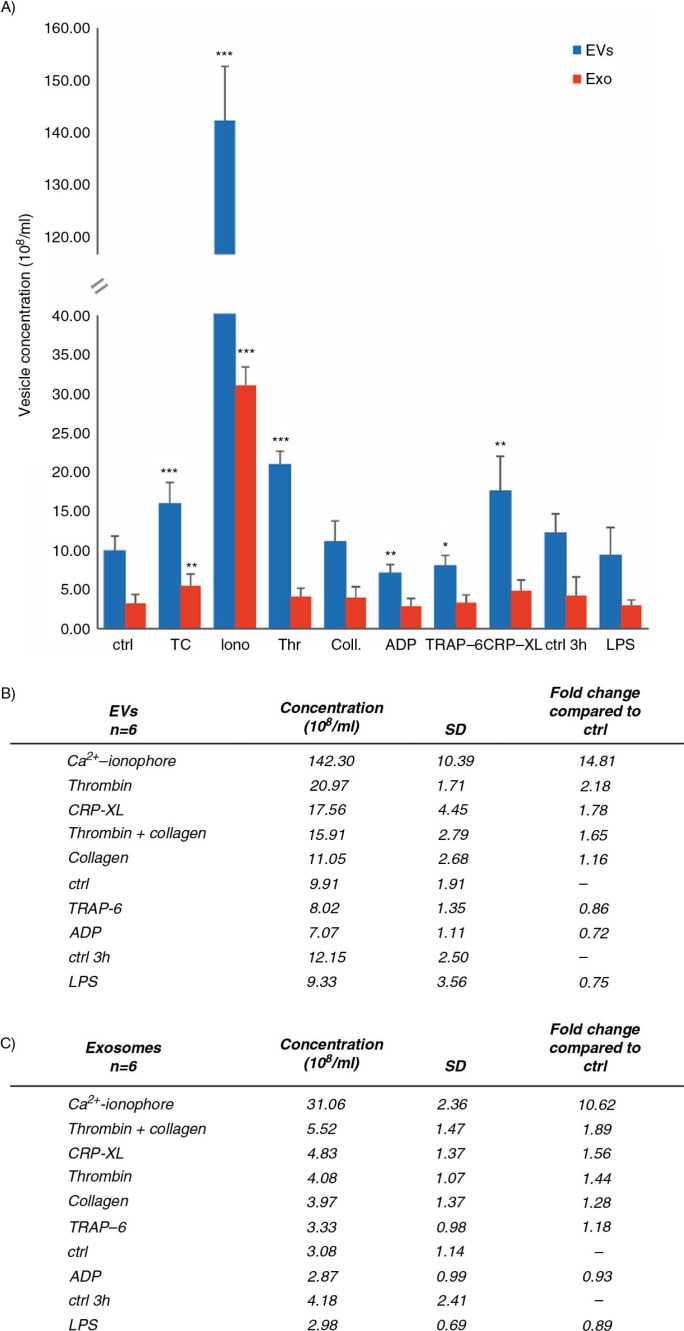
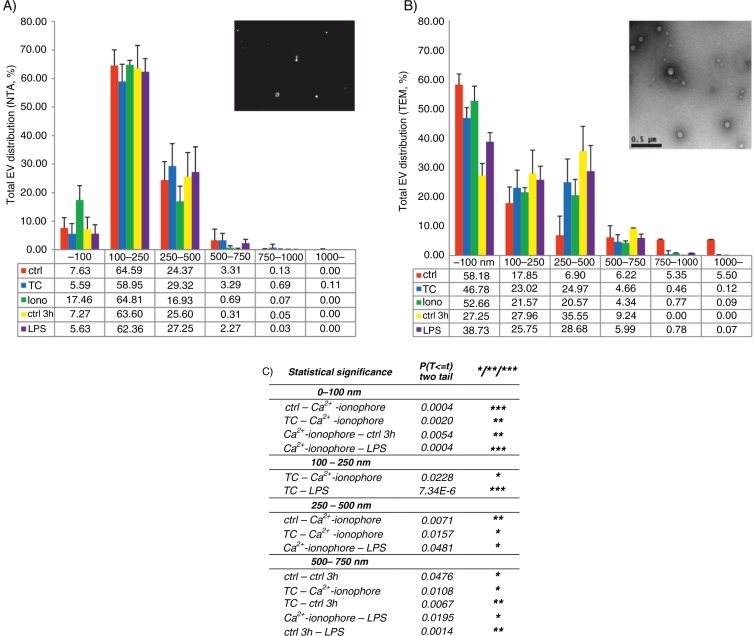
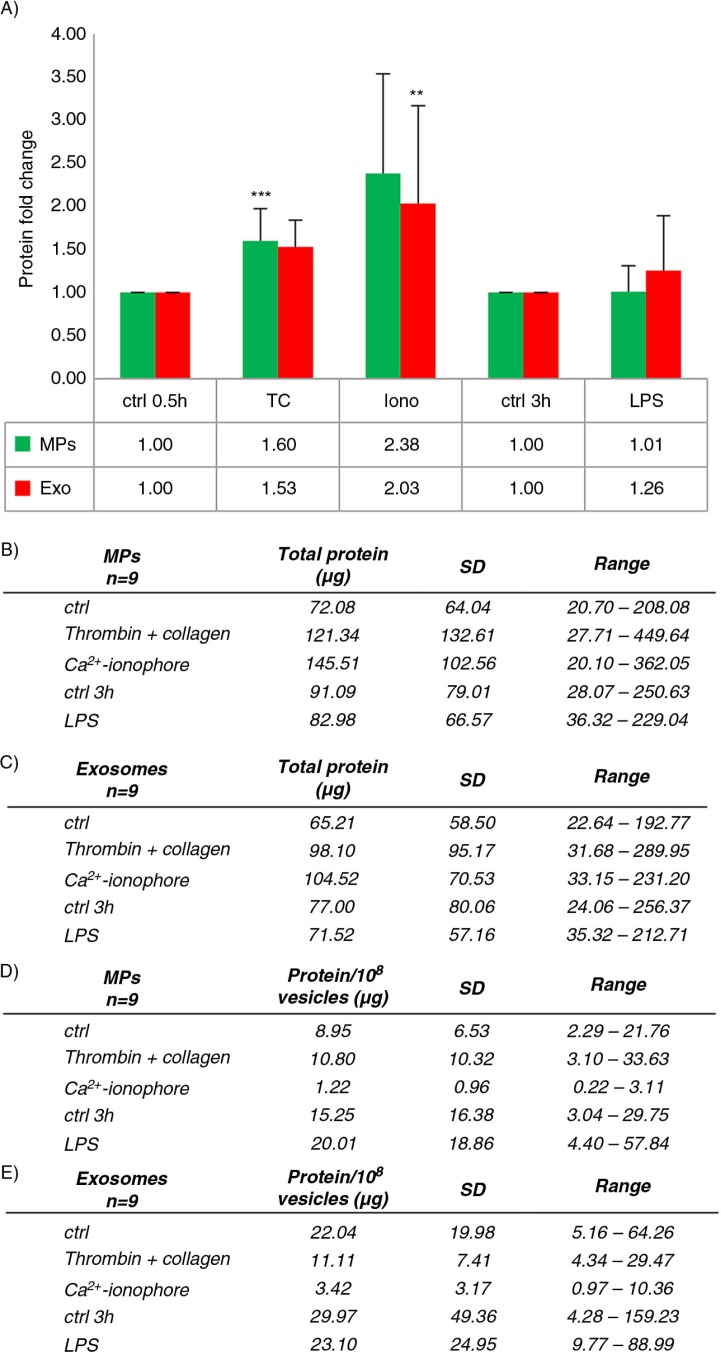
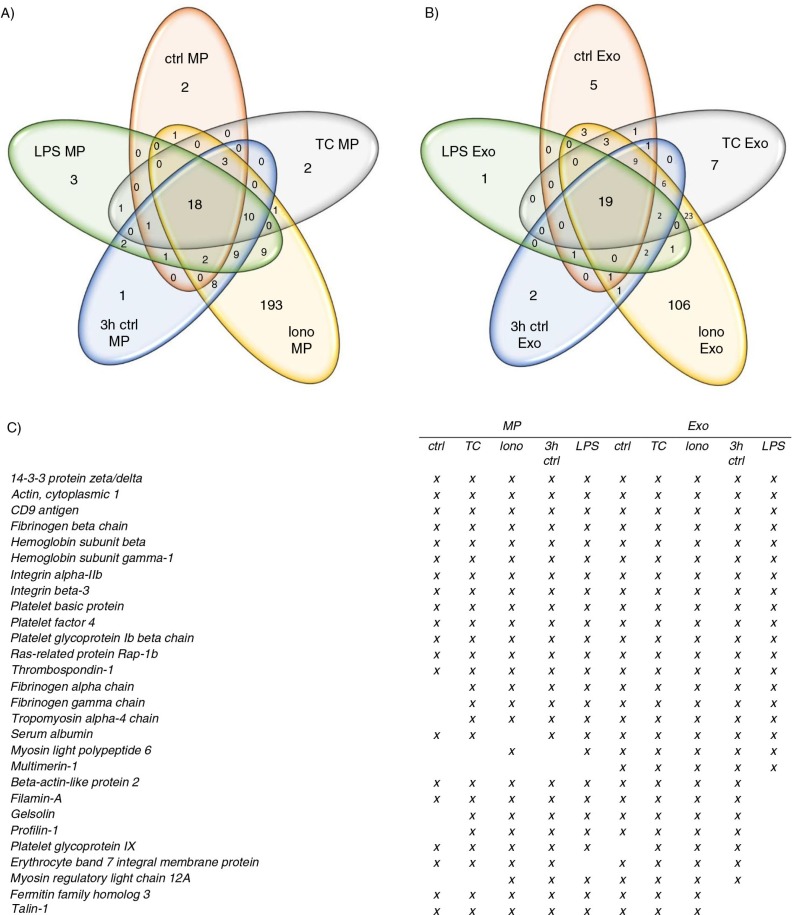
BACKGROUND: Platelet-derived extracellular vesicles (EVs) participate, for example, in haemostasis, immunity and development. Most studies of platelet EVs have targeted microparticles, whereas exosomes and EV characterization under various conditions have been less analyzed. Studies have been hampered by the difficulty in obtaining EVs free from contaminating cells and platelet remnants. Therefore, we optimized an EV isolation protocol and compared the quantity and protein content of EVs induced by different agonists. METHODS: Platelets isolated with iodixanol gradient were activated by thrombin and collagen, lipopolysaccharide (LPS) or Ca(2+) ionophore. Microparticles and exosomes were isolated by differential centrifugations. EVs were quantitated by nanoparticle tracking analysis (NTA) and total protein. Size distributions were determined by NTA and electron microscopy. Proteomics was used to characterize the differentially induced EVs. RESULTS: The main EV populations were 100-250 nm and over 90% were <500 nm irrespective of the activation. However, activation pathways differentially regulated the quantity and the quality of EVs, which also formed constitutively. Thrombogenic activation was the most potent physiological EV-generator. LPS was a weak inducer of EVs, which had a selective protein content from the thrombogenic EVs. Ca(2+) ionophore generated a large population of protein-poor and unselectively packed EVs. By proteomic analysis, EVs were highly heterogeneous after the different activations and between the vesicle subpopulations. CONCLUSIONS: Although platelets constitutively release EVs, vesiculation can be increased, and the activation pathway determines the number and the cargo of the formed EVs. These activation-dependent variations render the use of protein content in sample normalization invalid. Since most platelet EVs are 100-250 nm, only a fraction has been analyzed by previously used methods, for example, flow cytometry. As the EV subpopulations could not be distinguished and large vesicle populations may be lost by differential centrifugation, novel methods are required for the isolation and the differentiation of all EVs.
Overview
The claims and statistics of this paper haven’t been checked yet.
Run the check — free, no account needed. It reads the open-access text and checks the sources it cites.
Integrity signals
Registry
Cites
Statistics
Figures
Verification
Claims the paper makes
The claims and statistics of this paper haven’t been checked yet.
Run the check — free, no account needed. It reads the open-access text and checks the sources it cites.
Claims other papers make about this one
Each is checked against this paper’s own text: does it say what the citing paper says it does?
The check wasn’t confident either way, so it gives no verdict — never disputed.
In the citing paper
“Despite the extensive literature regarding antibodies targeting the cardiolipin (also known as the mitochondrial antigen M1) in SLE, the anti-mitochondrial autoantibody repertoire and their antigenic targets remains mostly uncharacterized (12, 34–37).”
From Autoantibodies in Systemic Lupus Erythematosus Target Mitochondrial RNA (2019) · cites this paper as [37]
Experimental — accuracy not yet measured
Self-check
Percentages, sums and reported differences re-computed from the paper’s own numbers.
The self-check needs the paper’s full text.
Citations
Cites
Primer3 on the WWW for General Users and for Biologist Programmers
Rozen, S., & Skaletsky, H. (2003) · Humana Press eBooks · doi:10.1385/1-59259-192-2:365 · Cited by 15,068
Membrane vesicles as conveyors of immune responses
Théry, C., Ostrowski, M., & Segura, É. (2009) · Nature reviews. Immunology · doi:10.1038/nri2567 · Cited by 3,996
Witwer, K. W., Buzás, E. I., Bemis, L., Bora, A., Lässer, C., Lötvall, J. O., Hoen, E. N. M. N., Piper, M. G., Sivaraman, S., Skog, J., et al. (2013) · Journal of Extracellular Vesicles · doi:10.3402/jev.v2i0.20360 · Cited by 2,513
Filipe, V., Hawe, A., & Jiskoot, W. (2010) · Pharmaceutical Research · doi:10.1007/s11095-010-0073-2 · Cited by 1,885
Heijnen, H. F. G., Schiel, A. E., Fijnheer, R., Geuze, H. J., & Sixma, J. J. (1999) · Blood · doi:10.1182/blood.v94.11.3791 · Cited by 1,488
Sizing and phenotyping of cellular vesicles using Nanoparticle Tracking Analysis
Dragovic, R., Gardiner, C., Brooks, A. S., Tannetta, D., Ferguson, D. J. P., Hole, P., Carr, B., Redman, C. W. G., Harris, A. L., Dobson, P. J., et al. (2011) · Nanomedicine Nanotechnology Biology and Medicine · doi:10.1016/j.nano.2011.04.003 · Cited by 1,368
Platelet α-granules: Basic biology and clinical correlates
Blair, P., & Flaumenhaft, R. (2009) · Blood Reviews · doi:10.1016/j.blre.2009.04.001 · Cited by 1,157
Exosomes: proteomic insights and diagnostic potential
Simpson, R. J., Lim, J. W., Moritz, R. L., & Mathivanan, S. (2009) · Expert Review of Proteomics · doi:10.1586/epr.09.17 · Cited by 1,119
Arraud, N., Linares, R., Tan, S., Gounou, C., Pasquet, J., Mornet, S., & Brisson, A. R. (2014) · Journal of Thrombosis and Haemostasis · doi:10.1111/jth.12554 · Cited by 776
Sims, P. J., Wiedmer, T., Esmon, C. T., Weiss, H. J., & Shattil, S. J. (1989) · Journal of Biological Chemistry · doi:10.1016/s0021-9258(18)71457-9 · Cited by 595
Cited by
Sorted by citations
Items 201–300 of 334
Tzounakas, V. L., Stamoulis, K. E., Anastasiadi, A. T., Papassideri, I. S., Kriebardis, A. G., Rinalducci, S., & Antonelou, M. H. (2021) · Transfusion and Apheresis Science · doi:10.1016/j.transci.2021.103166 · Cited by 16
Meliciano, A., Salvador, D., Mendonça, P., Louro, A. F., & Serra, M. (2023) · Pharmaceutics · doi:10.3390/pharmaceutics15030953 · Cited by 17
Moiia, Y. R., Ammann, K. R., Miller-Gutierrez, S., Sheriff, J., Bluestein, D., Italiano, J. E., Flaumenhaft, R. C., & Slepian, M. J. (2023) · International Journal of Molecular Sciences · doi:10.3390/ijms24087386 · Cited by 14
Kamhieh‐Milz, J., Mustafa, S. A., Sterzer, V., Hatice, C., Keski, S., Khorramshahi, O., Movassaghi, K., Hoheisel, J. D., Alhamdani, M. S. S., & Salama, A. (2016) · Journal of Proteomics · doi:10.1016/j.jprot.2016.07.028 · Cited by 15
Reale, A., Khong, T. T., Xu, R., Chen, M., Mithraprabhu, S., Bingham, N. E., Spencer, A. G., & Greening, D. W. (2021) · Methods in molecular biology · doi:10.1007/978-1-0716-1186-9_10 · Cited by 15
Jiao, T., Huang, Y., Sun, H., & Yang, L. (2023) · Aging · doi:10.18632/aging.204883 · Cited by 15
Zhang, S., Han, M., Li, S., Wang, Y., Wu, L., Dong, L., & Liang, P. (2025) · Journal of Nanobiotechnology · doi:10.1186/s12951-025-03700-8 · Cited by 14
A sensitive S-Trap-based approach to the analysis of T cell lipid raft proteome
Chhuon, C., Zhang, S., Jung, V. A., Lewandowski, D., Lipecka, J., Pawlak, A., Sahali, D., Ollero, M., & Guerrera, I. C. (2020) · Journal of Lipid Research · doi:10.1194/jlr.d120000672 · Cited by 14
The effect of ionising radiation on the phenotype of bone marrow-derived extracellular vesicles
Kis, D., Persa, E., Szatmári, T., Antal, L., Bóta, A., Csordás, I. B., Hargitai, R., Jezsó, B., Kis, E., Mihály, J., et al. (2020) · British Journal of Radiology · doi:10.1259/bjr.20200319 · Cited by 14
Calcium ionophore-activated platelets induce eosinophil extracellular trap formation
Sim, M. S., Kim, H. J., Bae, I., KIM, C. S., Chang, H. S., Choi, Y., Lee, D.-H., Park, H., & Chung, I. Y. (2022) · Allergology International · doi:10.1016/j.alit.2022.12.002 · Cited by 14
Transcription factors in megakaryocytes and platelets
Yuan, H., Liu, Y., Zhang, J., Dong, J., & Zhao, Z. (2023) · Frontiers in Immunology · doi:10.3389/fimmu.2023.1140501 · Cited by 14
Controlling the fate of regenerative cells with engineered platelet-derived extracellular vesicles
Graça, A. L., Gómez‐Florit, M., Osório, H., Rodrigues, M. T., Domingues, R. M. A., Reis, R. L., & Gomes, M. E. (2022) · Nanoscale · doi:10.1039/d1nr08108j · Cited by 14
Demirbağ, B., Yıldırım, M., Çimentepe, M., Necip, A., Ünver, H., & Tiftik, E. N. (2025) · Biochemical and Biophysical Research Communications · doi:10.1016/j.bbrc.2025.151872 · Cited by 13
Stochastic Electrochemical Cytometry of Human Platelets via a Particle Collision Approach
Lee, J., Gerelkhuu, Z., Song, J., Seol, K. H., Kim, B., & Chang, J. (2019) · ACS Sensors · doi:10.1021/acssensors.9b01773 · Cited by 13
Pursuing mechanisms of extracellular vesicle formation. Effects of sample processing
Božič, D., Hočevar, M., Kononenko, V., Jeran, M., Štibler, U., Fiume, I., Pajnič, M., Pađen, L., Kogej, K., Drobne, D., et al. (2020) · Advances in biomembranes and lipid self-assembly · doi:10.1016/bs.abl.2020.09.003 · Cited by 15
Yıldırım, M., Erşatır, M., Saleh, M., Demirbağ, B., Yabalak, E., & Kılıç, A. (2025) · Journal of Organometallic Chemistry · doi:10.1016/j.jorganchem.2025.123688 · Cited by 12
Ilvonen, P., Pusa, R., Härkönen, K., Laitinen, S., & Impola, U. (2024) · Journal of Extracellular Biology · doi:10.1002/jex2.130 · Cited by 12
Self-citationPetrova, T., Kalinina, O., Aquino, A. D., Grigoryev, E. A., Dubashynskaya, N. V., Zubkova, K. D., Kostareva, A. A., & Головкин, А. С. (2024) · Non-Coding RNA · doi:10.3390/ncrna10010015 · Cited by 14
Pagani, A., Duscher, D., Geis, S., Klein, S., Knoedler, L., Panayi, A. C., Oliinyk, D., Felthaus, O., & Prantl, L. (2024) · Cells · doi:10.3390/cells13070614 · Cited by 12
Paiva, J. S., Jorge, P. A. S., Ribeiro, R. S. R., Sampaio, P., Rosa, C. C., & Cunha, J. P. S. (2019) · International Journal of Nanomedicine · doi:10.2147/ijn.s174358 · Cited by 12
Varela-López, E., Pina-Canseco, M. D. S., Massó, F., Lerma, C., Domínguez, A. M. M., Ávila, J., Torres-Narváez, J. C., Vargas-González, Á., & Páez, A. (2025) · International Journal of Molecular Sciences · doi:10.3390/ijms26146567 · Cited by 12
Tavukcuoglu, Z., Butt, U., Faria, A. V. D. S., Oesterreicher, J., Holnthoner, W., Laitinen, S., Palviainen, M., & Siljander, P. R. M. (2024) · Cell Communication and Signaling · doi:10.1186/s12964-024-01973-4 · Cited by 11
Self-citationMicroparticles in Hematological Malignancies: Role in Coagulopathy and Tumor Pathogenesis
Ball, S., & NUGENT, K. M. (2017) · The American Journal of the Medical Sciences · doi:10.1016/j.amjms.2017.11.014 · Cited by 11
Effects of Extracellular Vesicles Derived from Mesenchymal Stem/Stromal Cells on Liver Diseases
Zheng, W., Yang, Y., Sequeira, R. C., Bishop, C. E., Atala, A., Gu, Z., & Zhao, W. (2019) · Current Stem Cell Research & Therapy · doi:10.2174/1574888x14666190308123714 · Cited by 11
Frontier review of the roles of exosomes in osteoarthritis
Liu, D.-H., Jheng, Y.-C., Chen, P.-Y., Yarmishyn, A. A., Huang, S.-E., Chien, C.-S., Tsai, P.-H., Chien, Y., Yang, Y.-P., & Kao, C.-L. (2021) · Journal of the Chinese Medical Association · doi:10.1097/jcma.0000000000000570 · Cited by 11
Kis, D., Csordás, I. B., Persa, E., Jezsó, B., Hargitai, R., Szatmári, T., Sándor, N., Kis, E., Balázs, K., Sáfrány, G., et al. (2022) · Cells · doi:10.3390/cells11010155 · Cited by 11
Synthetic and biological nanoparticles for cancer immunotherapy
Oliveira, I., Rodrigues‐Santos, P., Ferreira, L., & das Neves, R. P. (2024) · Biomaterials Science · doi:10.1039/d4bm00995a · Cited by 10
Xin, X., & Koenen, R. R. (2025) · Expert Opinion on Therapeutic Targets · doi:10.1080/14728222.2025.2454617 · Cited by 13
α‐2‐Macroglobulin induces the shedding of microvesicles from cutaneous wound myofibroblasts
Laberge, A., Ayoub, A., Arif, S., Larochelle, S., Garnier, A., & Moulin, V. J. (2018) · Journal of Cellular Physiology · doi:10.1002/jcp.27794 · Cited by 11
Therapeutic Potential of Extracellular Vesicles in Oral Inflammation
Farm, Y. R., Chuah, B. H., Law, J. X., Leong, X.-F., Razali, M., & Ng, S. L. (2025) · International Journal of Molecular Sciences · doi:10.3390/ijms26073031 · Cited by 10
Combe, M., Isaac, K. S., Plews, J. R., & Sokolenko, S. (2025) · Stem Cell Research & Therapy · doi:10.1186/s13287-025-04279-5 · Cited by 9
Blood derived extracellular vesicles as regenerative medicine therapeutics
de Boer, C., & Davies, N. H. (2021) · Biochimie · doi:10.1016/j.biochi.2021.10.009 · Cited by 9
Lim, H., Hong, S., Cho, S., Han, B., Kim, J. Y., Kim, J. Y., & Kim, J. (2024) · Sensors and Actuators B Chemical · doi:10.1016/j.snb.2024.136742 · Cited by 8
Wu, F., Chen, Y., Xiao, H., Zou, Z., Ning, J., Chen, H., & Zou, H. (2018) · Europe PMC (PubMed Central) · doi:10.12122/j.issn.1673-4254.2018.09.17 · Cited by 8
Artemenko, E. O., Obydennyi, S. I., Troyanova, K. S., Novichkova, G. A., Nechipurenko, D. Y., & Panteleev, M. A. (2023) · Thrombosis Research · doi:10.1016/j.thromres.2023.11.018 · Cited by 8
Lainšček, D., Lebar, T., & Jerala, R. (2017) · Biochemical and Biophysical Research Communications · doi:10.1016/j.bbrc.2017.01.090 · Cited by 8
Coagulation Activity of Membrane Microparticles
Antonova, O. A., Yakushkin, V. V., & Mazurov, A. V. (2019) · Biochemistry (Moscow) Supplement Series A Membrane and Cell Biology · doi:10.1134/s1990747819030036 · Cited by 8
Zhu, T., Fan, B., He, Z., Fan, Z., He, B., Miao, W., & Huang, R. (2024) · Biomacromolecules · doi:10.1021/acs.biomac.4c00398 · Cited by 7
Slaba, I., & Kubes, P. (2017) · Springer eBooks · doi:10.1007/978-3-319-47462-5_34 · Cited by 8
Marić, I., Žiberna, K., Kolenc, A., & Maličev, E. (2024) · Blood Cells Molecules and Diseases · doi:10.1016/j.bcmd.2024.102842 · Cited by 7
Malaria Parasites Hijack Host Receptors From Exosomes to Capture Lipoproteins
Iso-O, N., Komatsuya, K., Tokumasu, F., Isoo, N., Ishigaki, T., Yasui, H., Yotsuyanagi, H., Hara, M., & Kita, K. (2021) · Frontiers in Cell and Developmental Biology · doi:10.3389/fcell.2021.749153 · Cited by 7
The Impact of Platelet Isolation Protocol on the Release of Extracellular Vesicles
Zarà, M., Vismara, M., Dona, G. D., Trivigno, S. M. G., Amadio, P., Sandrini, L., Guidetti, G. F., & Barbieri, S. S. (2022) · Frontiers in Bioscience-Landmark · doi:10.31083/j.fbl2705161 · Cited by 7
Barros, T. A. D. C., & de‐Oliveira‐Pinto, L. M. (2018) · InTech eBooks · doi:10.5772/intechopen.73084 · Cited by 7
Huang, H., Xu, W., Hao, X., Sun, P., Guo, M., Li, M., Liu, X., Peng, Y., Han, R., Tang, T., et al. (2026) · Journal of Controlled Release · doi:10.1016/j.jconrel.2026.114706 · Cited by 6
Advances in the research of exosomes in renal cell carcinoma: from mechanisms to applications
Rui, R., Zhou, L., & He, S. (2023) · Frontiers in Immunology · doi:10.3389/fimmu.2023.1271669 · Cited by 6
Kovács, O. T., Soltész‐Katona, E., Marton, N., Baricza, E., Hunyady, L., Turu, G., & Nagy, G. (2021) · International Journal of Molecular Sciences · doi:10.3390/ijms22084221 · Cited by 6
Żmigrodzka, M., Witkowska‐Piłaszewicz, O., Pingwara, R., & Winnicka, A. (2022) · International Journal of Molecular Sciences · doi:10.3390/ijms23105504 · Cited by 6
Microparticles in kidney diseases: focus on kidney transplantation
Amiri, F. S. (2017) · Renal Replacement Therapy · doi:10.1186/s41100-017-0104-0 · Cited by 6
Palkina, N. V., Zenaishvili, R. D., & Ruksha, T. G. (2024) · Vestnik dermatologii i venerologii · doi:10.25208/vdv11876 · Cited by 5
Barros, B. J., & Cunha, J. P. S. (2024) · Communications Engineering · doi:10.1038/s44172-024-00240-1 · Cited by 5
Recabarren-Leiva, D., & Alarcón, M. A. (2018) · Immunology Letters · doi:10.1016/j.imlet.2018.01.003 · Cited by 5
Kutikhin, A. G. (2021) · Fundamental and Clinical Medicine · doi:10.23946/2500-0764-2021-6-1-82-102 · Cited by 5
Wu, B. W. F., Chen, Y.-Y., Huang, J.-X., Kang-ying, W., Xu, H., & Lin, D. (2022) · Clinical and investigative medicine · doi:10.25011/cim.v45i3.38876 · Cited by 5
Extracellular vesicles in heart failure
Berezin, A. Е., & Berezin, A. A. (2024) · Advances in clinical chemistry · doi:10.1016/bs.acc.2024.02.001 · Cited by 5
Qian, Y., Li, C., Gao, J., Wang, S., Wu, X., Wei, L., Zha, M., Shi, Y., Kang, T., & Li, K. (2024) · Chemical Communications · doi:10.1039/d4cc02168a · Cited by 5
Integrative Modeling and Visualization of Exosomes
Jiménez, J., Autin, L., de Cáceres, I. I., & Goodsell, D. S. (2019) · Journal of Biocommunication · doi:10.5210/jbc.v43i2.10331 · Cited by 5
Platelet proteomics applied to the search for novel antiplatelet therapeutic targets
Izquierdo, I., & García, Á. G. (2016) · Expert Review of Proteomics · doi:10.1080/14789450.2016.1246188 · Cited by 5
Tokarz–Deptuła, B., Baraniecki, Ł., Palma, J., Stosik, M. P., Syrenicz, A., Kołacz, R., & Deptuła, W. (2025) · International Journal of Inflammation · doi:10.1155/ijin/8878764 · Cited by 4
Platelets in Neonatal Sepsis: Beyond Clotting, from Silent Players to Immune Orchestrators
Sokou, R., Lianou, A., Tsantes, A. G., Petrou, E., Bonovas, S., Nikolopoulos, G. K., Tsantes, A. Ε., & Iacovidou, N. M. (2025) · Seminars in Thrombosis and Hemostasis · doi:10.1055/a-2731-2399 · Cited by 4
Ráez-Meseguer, C., Amengual-Tugores, A. M., Forteza‐Genestra, M. A., Orvay, F., Gomila, R. M., Martorell-Crespí, G., Calvo, J., Gayà, A., Monjo, M., & Ramis, J. M. (2025) · Journal of Proteome Research · doi:10.1021/acs.jproteome.5c00089 · Cited by 4
PBMC‐derived extracellular vesicles in a smoking‐related inflammatory disease model
Gomez, N. E., James, V. H., Arkill, K. P., Nizamudeen, Z. A., Onion, D., & Fairclough, L. C. (2023) · European Journal of Immunology · doi:10.1002/eji.202250143 · Cited by 5
Molecular insights and clinical impacts of extracellular vesicles in cancer
Leetanaporn, K., Hanprasertpong, J., & Navakanitworakul, R. (2021) · Oncology Reviews · doi:10.4081/oncol.2021.542 · Cited by 4
Causes of platelet loss during extracorporeal life support
Atchison, C., Widdershins, A., & Chandler, W. L. (2022) · Artificial Organs · doi:10.1111/aor.14395 · Cited by 4
Zhu, Z., Sun, S., Jiang, T., Zhang, L., Chen, M., & Chen, S. (2023) · Tissue and Cell · doi:10.1016/j.tice.2023.102066 · Cited by 4
Generation of platelet-derived microparticles through the activation of the toll-like receptor 4
Alarcón, M. A. (2019) · Heliyon · doi:10.1016/j.heliyon.2019.e01486 · Cited by 4
Review for good platelet-rich plasma procedure in cosmetic dermatology and surgery
Kim, M. H., & Byeon, H. S. (2019) · The Journal of Cosmetic Medicine · doi:10.25056/jcm.2019.3.1.1 · Cited by 4
Burnouf, T. P. R., Strengers, P. F. W., & Busch, M. P. (2025) · Vox Sanguinis · doi:10.1111/vox.70155 · Cited by 3
Honeywell, E., Ball, B., Sukumaran, A., Muselius, B., Ströhle, G., Li, H., & Geddes‐McAlister, J. (2026) · Canadian Journal of Microbiology · doi:10.1139/cjm-2025-0043 · Cited by 3
Akutsu, F., Sugino, S., Watanabe, M., Barde, Y., & Kojima, M. (2025) · F1000Research · doi:10.12688/f1000research.160304.1 · Cited by 3
Marttila, H., Saari, H., Laitinen, S., Poranen, M. M., & Oksanen, H. M. (2025) · Journal of Chromatography A · doi:10.1016/j.chroma.2025.466416 · Cited by 3
Self-citationUrinary extracellular vesicles carry multiple activators and regulators of coagulation
Saraswat, M., PRZYBYLA, B. D., Joenväärä, S., Tohmola, T., Strandin, T. M., Puhka, M., Jouppila, A., Lassila, R., & Renkonen, R. (2022) · Frontiers in Cell and Developmental Biology · doi:10.3389/fcell.2022.967482 · Cited by 3
Convenient exosome separation by phosphatidylserine targeting polymer brush materials
Li, S., Hao, S., Yang, Y., He, Y., Long, C., Zhang, Z., & Zhang, J. (2022) · Chemical Communications · doi:10.1039/d2cc05505h · Cited by 3
Garcia, L. F. C., Wowk, P. F., & Albrecht, L. (2024) · International Journal of Molecular Sciences · doi:10.3390/ijms25094761 · Cited by 3
Kolenc, A., Grundner, M., Hostnik, I., & Maličev, E. (2024) · International Journal of Molecular Sciences · doi:10.3390/ijms252111577 · Cited by 3
Rationally Designed Peptide Probes for Extracellular Vesicles
Tamura, R., & Yin, H. H. (2016) · Advances in clinical chemistry · doi:10.1016/bs.acc.2016.09.001 · Cited by 3
Fang, W. X., Zeng, W., Huang, Y., Chen, A., Guo, Y., Wen, G., Ye, J., Xu, J., & Liu, Y. (2026) · Journal of Nanobiotechnology · doi:10.1186/s12951-026-04076-z · Cited by 2
Georges, N., Fuentes, C., Hidalgo, Y., Grünenwald, F., Corrales-Bermúdez, J., Figueroa‐Valdés, A. I., Ramírez-Pereira, M., Arriagada, G., Bustos, F. J., Ahumada-Marchant, C., et al. (2026) · Cancer Letters · doi:10.1016/j.canlet.2026.218457 · Cited by 2
Nikravesh, F., Khalilabadi, R. M., Farsinejad, A., & Valandani, H. M. (2024) · Molecular Biology Reports · doi:10.1007/s11033-024-09383-y · Cited by 2
Kishenko, V. V., Кондратов, К. А., Belyakova, M., Mikhailovskii, V., Sidorkevich, S. V., Вавилова, Т. В., Fedorov, A. V., & Сироткина, О. В. (2017) · Cell and Tissue Biology · doi:10.1134/s1990519x17060050 · Cited by 2
Schubert, P., Johnson, L., Culibrk, B., Chen, Z., Tan, S. S. L., Marks, D. C., & Devine, D. V. (2021) · Transfusion · doi:10.1111/trf.16542 · Cited by 2
Exosome—Potential Target for Clinical Application
郭, 德. (2017) · Open Journal of Natural Science · doi:10.12677/ojns.2017.51004 · Cited by 2
Generation and Characterization of Cell-Derived Microvesicles from HUVECs
Cherré, S., Granberg, M., Østergaard, O., Heegaard, N. H. H., & Rozlosnik, N. (2017) · BioNanoScience · doi:10.1007/s12668-017-0438-7 · Cited by 2
Adipocyte-derived extracellular vesicles: characterisation and function
Connolly, K. D. (2016) · ORCA Online Research @Cardiff (Cardiff University) · Cited by 2
Predictive Biomarkers of Cellular Radiosensitivity for Clinical Radiotherapy Treatment
White, L. (2016) · Arrow - TU Dublin (Technological University Dublin) · doi:10.21427/d70w2x · Cited by 2
Li, Q., Gao, L., Li, F., Li, J., Hou, Z., Cao, S., & Wang, L. (2025) · Burns · doi:10.1016/j.burns.2025.107651 · Cited by 1
Niu, L., Wang, Y., Gao, Y., & Zhang, J. (2026) · Frontiers in Bioinformatics · doi:10.3389/fbinf.2025.1690932 · Cited by 1
Circulating Exosomal MicroRNAs as Potential Biomarkers for Pulmonary Embolism
Zhang, C., Kantarcıoğlu, B., Kempaiah, P., Nikolovski, S. S., Siddiqui, F., Kouta, A., Lievano, F. A., Doan, T., Kaja, S., Darki, A., et al. (2026) · Clinical and Applied Thrombosis/Hemostasis · doi:10.1177/10760296251407689 · Cited by 1
Xia, C., Xu, C., Liu, Y., Feng, X., Le, Y., Xu, H., Qi, F., Liang, Z., Chen, J., & Li, J. (2026) · Vascular Pharmacology · doi:10.1016/j.vph.2026.107605 · Cited by 1
From Liver to Muscle: Crosstalk Mechanisms and Interventions in Sarcopenia
Wang, Q., Meng, Y., Wang, X., Lan, X., Fan, G., & Xiang, Y. (2025) · Health and Metabolism · doi:10.53941/hm.2025.100022 · Cited by 1
The Role of Microvesicles in Cutaneous Wound Healing
Laberge, A., & Moulin, V. J. (2017) · Wiley eBooks · doi:10.1002/9781119282518.ch4 · Cited by 1
Akutsu, F., Sugino, S., Watanabe, M., Barde, Y., & Kojima, M. (2024) · SSRN Electronic Journal · doi:10.2139/ssrn.4776653 · Cited by 1
Oggero, S., de Gaetano, M., Marcone, S., Barry, M. C., Montero‐Melendez, T., Cooper, D., Norling, L. V., Brennan, E. P., Godson, G., & Perretti, M. (2019) · bioRxiv (Cold Spring Harbor Laboratory) · doi:10.1101/841361
Biosensor Designs for Platelet-derived Microparticles Analysis
Kailashiya, J. (2020) · Annals of the National Academy of Medical Sciences (India) · doi:10.1055/s-0040-1712812
Microparticles in hemophilia - friend or foe? : to improve hemostasis or to induce atherothrombosis?
Zong, Y. (2020) · Figshare
Russell, A. E. (2019) · The Research Repository @ WVU (West Virginia University) · doi:10.33915/etd.3947
Extracellular vesicles in Shiga toxin-mediated disease
Willysson, A. (2021) · Lund University Publications (Lund University)
Kim, H. J., Rames, M. J., Yunga, S. T., Armstrong, R. J., Morita, M., Ngo, A. T. P., McCarty, O. J. T., Çivitçi, F., Morgan, T. K., & Ngo, T. T. M. (2021) · Research Square · doi:10.21203/rs.3.rs-133629/v1
Biologically synthesized nanocarriers for targeted drug delivery applications
Madgula, K., Peddada, L. M., & Pattathil, S. D. (2023) · Elsevier eBooks · doi:10.1016/b978-0-323-95325-2.00009-2 · Cited by 2
Chaudhary, S., Мадан, А. К., Bhunia, B. K., & Arora, D. (2023) · Springer eBooks · doi:10.1007/978-981-99-3848-3_7
Metadata
- Authors
- Aatonen, M. T., Öhman, T., Nyman, T. A., Laitinen, S., Grönholm, M., & Siljander, P. R. ‐.
- Affiliations
- University of Helsinki (FI)
- Finnish Red Cross (FI)
- Corresponding author
- Siljander, Pia R.‐M.
- ORCID
- Venue
- Journal of Extracellular Vesicles
- Publisher
- Wiley
- Published
- 2014-01
- Volume
- 3
- Issue
- 1
- ISSN
- 2001-3078 (ISSN-L)
- PMC
- PMC4125723
- OpenAlex
- W1991525001
- Cited by
- 333
- References
- 55
- Citations by year
- 2026: 20 · 2025: 25 · 2024: 40 · 2023: 27 · 2022: 40 · 2021: 28 · 2020: 20 · 2019: 35 · 2018: 16 · 2017: 25 · 2016: 41 · 2015: 15 · 2014: 1
- FWCI
- 11.20
- Type
- journal article
- Language
- en
- Open access
- gold
- doi.org
- Licence
- Locations
- Journal of Extracellular Vesicles (publishedVersion, cc-by-nc)
- Europe PMC (PubMed Central) (publishedVersion, cc-by-nc-nd)
- PubMed Central (publishedVersion, cc-by-nc-nd)
- PubMed (publishedVersion)
- DOAJ (DOAJ: Directory of Open Access Journals) (submittedVersion, cc-by-sa)
- Funders
- Magnus Ehrnroothin Säätiö
- Otto A. Malm Lahjoitusrahasto
- Topics
- Life Sciences › Biochemistry, Genetics and Molecular Biology › Molecular Biology › Extracellular vesicles in disease
- Health Sciences › Medicine › Hematology › Platelet Disorders and Treatments
- Life Sciences › Biochemistry, Genetics and Molecular Biology › Cell Biology › Caveolin-1 and cellular processes
- Keywords
- platelet-derived extracellular vesicles, exosomes, microparticles, EV isolation, platelet activation, thrombin, collagen, lipopolysaccharide, calcium ionophore, vesicle size distribution, EV proteome, vesicle heterogeneity, sample normalization
About these checks
Registry, retraction, Cites and statistics results are computed, not judged, with one exception: a printed reference that no index lists is read once by a model before it counts as a citation error. Claims are extracted by a model and kept only when their quote appears verbatim in the text; each cited source is then checked, with a model’s help, for whether it says what the claim relies on. Those verdicts can be wrong — read the claim’s quote and the cited source before relying on one.
Statistics and arithmetic are recomputed, not judged.
Confidence bands are shown only for fields calibrated on our annotated test set. None is calibrated yet, so no band is shown.
What counts as a claim ›How we measure confidence ›How we check this ›
Are you an author, or do you see a problem with this page? Request a review
