

The DOI matches its Crossref record; 40 of the 42 references it cites were found in a registry or an index.
semPower: General power analysis for structural equation models
Open accessAbstract
Structural equation modeling (SEM) is a widespread and commonly used approach to test substantive hypotheses in the social and behavioral sciences. When performing hypothesis tests, it is vital to rely on a sufficiently large sample size to achieve an adequate degree of statistical power to detect the hypothesized effect. However, applications of SEM rarely consider statistical power in informing sample size considerations or determine the statistical power for the focal hypothesis tests performed. One reason is the difficulty in translating substantive hypotheses into specific effect size values required to perform power analyses, as well as the lack of user-friendly software to automate this process. The present paper presents the second version of the R package semPower which includes comprehensive functionality for various types of power analyses in SEM. Specifically, semPower 2 allows one to perform both analytical and simulated a priori, post hoc, and compromise power analysis for structural equation models with or without latent variables, and also supports multigroup settings and provides user-friendly convenience functions for many common model types (e.g., standard confirmatory factor analysis [CFA] models, regression models, autoregressive moving average [ARMA] models, cross-lagged panel models) to simplify power analyses when a model-based definition of the effect in terms of model parameters is desired.
Overview
The claims and statistics of this paper haven’t been checked yet.
Run the check — free, no account needed. It reads the open-access text and checks the sources it cites.
Integrity signals
Registry
Cites
Statistics
Figures
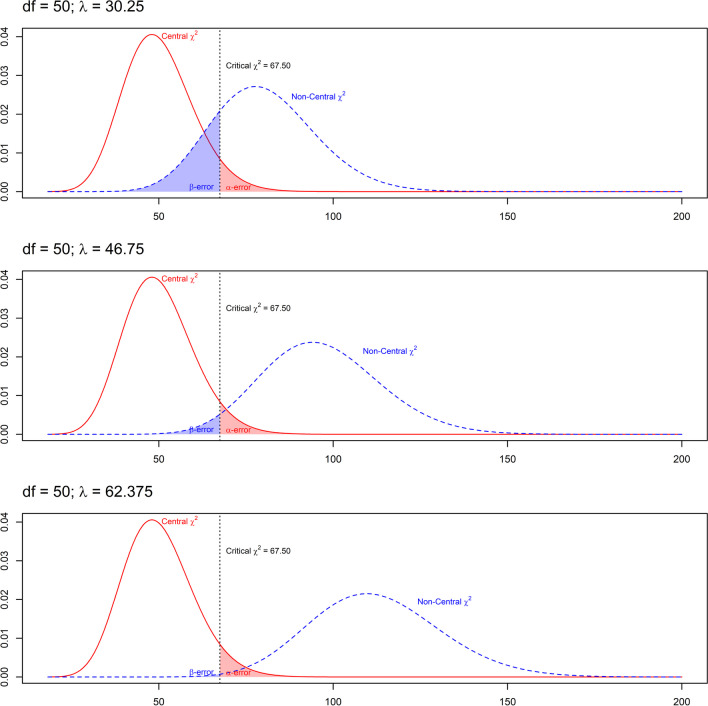
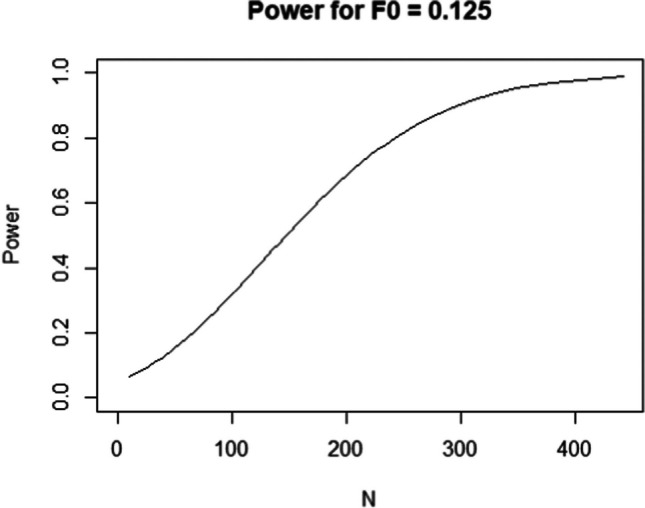
Verification
Claims the paper makes
The claims and statistics of this paper haven’t been checked yet.
Run the check — free, no account needed. It reads the open-access text and checks the sources it cites.
Claims other papers make about this one
Each is checked against this paper’s own text: does it say what the citing paper says it does?
The source backs part of the claim, not all of it — or backs it for a different population, condition or comparison.
In the citing paper
“Based on these parameters, the minimum required sample size was estimated at 342 participants [29].”
From Psychological inflexibility mediates the relationship between mindfulness and psychological distress in Peruvian parents with school age children. (2026) · cites this paper as [29]
Experimental — accuracy not yet measured
Self-check
Percentages, sums and reported differences re-computed from the paper’s own numbers.
The self-check needs the paper’s full text.
Citations
Cites
Faul, F., Erdfelder, E., Lang, A.-G., & Buchner, A. (2007) · Behavior Research Methods · doi:10.3758/bf03193146 · Cited by 65,971 · cited 2×
“In a power analysis, one of these quantities is computed as a function of the other quantities, giving rise to different types of power analyses (Faul et al., 2007).”
BackgroundMethodlavaan : An R Package for Structural Equation Modeling
Rosseel, Y. (2012) · Journal of Statistical Software · doi:10.18637/jss.v048.i02 · Cited by 27,955 · cited 1×
“…the model implementing the null hypothesis of interest is then fitted to the population variance–covariance matrix using the lavaan package (Rosseel, 2012), so that the population minimum F 0 along with the resulting model-implied variance covariance matrix ( ̂ 𝚺 ) and mean vector ( ̂ 𝛍…”
MethodEvaluating Goodness-of-Fit Indexes for Testing Measurement Invariance
Cheung, G. W., & Rensvold, R. B. (2002) · Structural Equation Modeling: A Multidisciplinary Journal · doi:10.1207/s15328007sem0902_5 · Cited by 16,280 · cited 1×
“For example, it has been suggested that a decline of ≥ .02 in the Mc associated with a metric in comparison to a configural invariance model may be considered a meaningful departure from measurement invariance (Cheung & Rensvold, 2002).”
BackgroundPower analysis and determination of sample size for covariance structure modeling.
MacCallum, R. C., Browne, M. W., & Sugawara, H. M. (1996) · Psychological Methods · doi:10.1037/1082-989x.1.2.130 · Cited by 10,418 · cited 2×
“…of a measure that shows a direct relation to the non-centrality parameter, which is afforded by all non-centrality-based measures of fit such as the minimum of the employed fitting function itself or derived indices such as the RMSEA (because F 0 = df ∙ RMSEA 2 ; e.g., MacCallum et al., 1996).”
MethodCurran, P. J., West, S. G., & Finch, J. F. (1996) · Psychological Methods · doi:10.1037/1082-989x.1.1.16 · Cited by 5,512 · cited 1×
“When the comparison is performed against the saturated model, however, simulated power is often higher as a consequence of the well-documented positive bias of the model test when the assumptions are violated (e.g., Curran et al., 1996; Moshagen, 2012).”
MethodHow to Use a Monte Carlo Study to Decide on Sample Size and Determine Power
Muthén, L. K., & Muthén, B. O. (2002) · Structural Equation Modeling: A Multidisciplinary Journal · doi:10.1207/s15328007sem0904_8 · Cited by 2,362
Reporting practices in confirmatory factor analysis: an overview and some recommendations
Jackson, D. L., Gillaspy, J. A., & Purc-Stephenson, R. (2009) · Psychological Methods · doi:10.1037/a0014694 · Cited by 2,242 · cited 8×
“Existing tools providing analytical power analyses specifically for SEM (e.g., MacCallum et al., 1996, 2006; Preacher & Coffman, 2006) require provision of a non-centrality-based measure of effect such as the RMSEA and are thus limited to a model-free approach.”
BackgroundInfluentialAsymptotically distribution-free methods for the analysis of covariance structures.
Browne, M. (1984) · British Journal of Mathematical & Statistical Psychology · doi:10.1111/j.2044-8317.1984.tb00789.x · Cited by 1,890 · cited 2×
“If the H0 model is correct, assuming multivariate normality, a sufficiently large sample size, and several mild regularity conditions (Browne, 1984; Yuan & Bentler, 2007), (1)”
MethodYuan, K.-H., & Bentler, P. (2000) · Sociological Methodology · doi:10.1111/0081-1750.00078 · Cited by 1,847 · cited 1×
“…= list(estimator = ' mlr ' ) leads to a simulated power estimate relying on a corrected test statistic that is asymptotically equivalent to the Yuan & Bentler (2000) statistic, whereas the analytic power estimate is still based on the asymptotically expected distributions based on ML.…”
Determining power and sample size for simple and complex mediation models
Schoemann, A. M., Boulton, A. J., & Short, S. D. (2017) · Social Psychological and Personality Science · doi:10.1177/1948550617715068 · Cited by 1,837 · cited 1×
“…approaches to statistical power necessarily allow for a model-based definition of the effect of interest, most existing tools implement post hoc power analyses only and are typically limited to particular model types (Kievit et al., 2018; Mulder, 2022; Schoemann et al., 2017; Zhang & Liu, 2018).”
MethodStructural Analysis of Covariance and Correlation Matrices
Jöreskog, K. G. (1978) · Psychometrika · doi:10.1007/bf02293808 · Cited by 1,006
Some contributions to maximum likelihood factor analysis
Jöreskog, K. (1967) · Psychometrika · doi:10.1007/bf02289658 · Cited by 880 · cited 1×
“In SEM, maximizing the likelihood is equivalent to minimizing the maximum likelihood (ML) fitting function (Jöreskog, 1967), so the LRT can also be obtained by considering the sample-size-weighted difference in the minimized sample values of the fitting function for the H0 model ( ̂ F ) and the H1…”
BackgroundPower Analysis for Parameter Estimation in Structural Equation Modeling: A Discussion and Tutorial
Wang, Y. A., & Rhemtulla, M. (2021) · Advances in Methods and Practices in Psychological Science · doi:10.1177/2515245920918253 · Cited by 555 · cited 4×
“…of options providing either analytical (Jak et al., 2021; Miles, 2003; Z. Zhang & Yuan, 2018) or simulated power analysis (Muthén & Muthén, 2002; Wang & Rhemtulla, 2021) allow for a generic model-based definition of the effect, but these require the manual definition of the values of all…”
BackgroundInfluentialDevelopmental cognitive neuroscience using latent change score models: A tutorial and applications
Kievit, R. A., Brandmaier, A. M., Ziegler, G., van Harmelen, A.-L., de Mooij, S. M. M., Moutoussis, M., Goodyer, I. M., Bullmore, E., Jones, P. B., Fonagy, P., et al. (2018) · Developmental Cognitive Neuroscience · doi:10.1016/j.dcn.2017.11.007 · Cited by 516 · cited 1×
“…approaches to statistical power necessarily allow for a model-based definition of the effect of interest, most existing tools implement post hoc power analyses only and are typically limited to particular model types (Kievit et al., 2018; Mulder, 2022; Schoemann et al., 2017; Zhang & Liu, 2018).”
MethodPower of the likelihood ratio test in covariance structure analysis
Satorra, A., & Saris, W. (1985) · Psychometrika · doi:10.1007/bf02294150 · Cited by 486 · cited 1×
“…H0 model is invalid, however, the LRT—again assuming multivariate normality, a sufficiently large sample size, and several regularity conditions 1 (Satorra & Saris, 1985; Steiger et al., 1985)—asymptotically follows a noncentral χ 2 ( df , λ) distribution with non-centrality parameter λ and…”
BackgroundOn the Multivariate Asymptotic Distribution of Sequential Chi-Square Statistics
Steiger, J. H., Shapiro, A., & Browne, M. W. (1985) · Psychometrika · doi:10.1007/bf02294104 · Cited by 482 · cited 3×
“…however, the LRT—again assuming multivariate normality, a sufficiently large sample size, and several regularity conditions 1 (Satorra & Saris, 1985; Steiger et al., 1985)—asymptotically follows a noncentral χ 2 ( df , λ) distribution with non-centrality parameter λ and expected value df + λ, so…”
BackgroundResultInfluentialLongitudinal Structural Equation Modeling
Newsom, J. T. (2015) · doi:10.4324/9781315871318 · Cited by 446 · cited 2×
“For instance, in a simple two-wave cross-lagged panel model (CLPM; e.g., Newsom, 2015) involving four factors, each comprising three indicators loading by .50, N = 252 observations are required to yield 80% power on alpha = .05 to detect global mis-specifications corresponding to a root-mean-square…”
MethodSimulating Multivariate Nonnormal Distributions
Vale, C. D., & Maurelli, V. A. (1983) · Psychometrika · doi:10.1007/bf02293687 · Cited by 444
Testing differences between nested covariance structure models: Power analysis and null hypotheses.
Maccallum, R., Browne, M., & Cai, L. (2006) · Psychological methods · doi:10.1037/1082-989x.11.1.19 · Cited by 374 · cited 1×
“Existing tools providing analytical power analyses specifically for SEM (e.g., MacCallum et al., 1996, 2006; Preacher & Coffman, 2006) require provision of a non-centrality-based measure of effect such as the RMSEA and are thus limited to a model-free approach.”
MethodA new strategy for testing structural equation models
Moshagen, M., & Erdfelder, E. (2016) · Structural Equation Modeling: A Multidisciplinary Journal · doi:10.1080/10705511.2014.950896 · Cited by 321 · cited 1×
“The semPower 2 package is a massive improvement and extension over the first version of sem-Power (Moshagen & Erdfelder, 2016), which only provided analytical power analysis for common effect size metrics or based on a covariance matrix input (thereby offering model-based power analysis via rather…”
MethodSelf-citationAn index of goodness-of-fit based on noncentrality
McDonald, R. P. (1989) · Journal of Classification · doi:10.1007/bf01908590 · Cited by 312 · cited 1×
“Note that the minimized sample value of the fitting function, ̂ F , is a biased estimate of F 0 (McDonald, 1989) with an expected value of F 0 + df / ( N − 1).”
BackgroundOlkin, I., & Finn, J. D. (1995) · Psychological Bulletin · doi:10.1037/0033-2909.118.1.155 · Cited by 302
Moshagen, M. (2012) · Structural Equation Modeling A Multidisciplinary Journal · doi:10.1080/10705511.2012.634724 · Cited by 239 · cited 1×
“When the comparison is performed against the saturated model, however, simulated power is often higher as a consequence of the well-documented positive bias of the model test when the assumptions are violated (e.g., Curran et al., 1996; Moshagen, 2012).”
MethodSelf-citationJobst, L. J., Bader, M., & Moshagen, M. (2021) · Psychological Methods · doi:10.1037/met0000423 · Cited by 236 · cited 1×
“…and extension over the first version of sem-Power (Moshagen & Erdfelder, 2016), which only provided analytical power analysis for common effect size metrics or based on a covariance matrix input (thereby offering model-based power analysis via rather cumbersome procedures; see Jobst et al., 2023).”
BackgroundSelf-citationPower Analysis for the Random Intercept Cross-Lagged Panel Model Using the powRICLPM R-Package
Mulder, J. D. (2022) · Structural Equation Modeling A Multidisciplinary Journal · doi:10.1080/10705511.2022.2122467 · Cited by 154 · cited 1×
“…approaches to statistical power necessarily allow for a model-based definition of the effect of interest, most existing tools implement post hoc power analyses only and are typically limited to particular model types (Kievit et al., 2018; Mulder, 2022; Schoemann et al., 2017; Zhang & Liu, 2018).”
MethodAnalytical power calculations for structural equation modeling: A tutorial and Shiny app
Jak, S., Jorgensen, T. D., Verdam, M. G. E., Oort, F. J., & Elffers, L. (2020) · Behavior Research Methods · doi:10.3758/s13428-020-01479-0 · Cited by 134 · cited 2×
“Readers who are more comfortable with a graphical user interface are referred to Jak et al. (2021) for analytical and to Wang and Rhemtulla (2021) for simulated power analyses.”
BackgroundTesting Model Nesting and Equivalence
Bentler, P., & Satorra, A. (2008) · Psychological methods · doi:10.1037/a0019625 · Cited by 133 · cited 1×
“…M0 is the likelihood of the hypothesized (H0) model and L M1 is the likelihood of a more general (H1) model, where the H0 model must be statistically nested in the H1 model (i.e., the parameter space of the H0 model must be a subset of the parameter space of the H1 model; Bentler & Satorra, 2010).”
BackgroundSimulating Multivariate Nonnormal Data Using an Iterative Algorithm
Ruscio, J., & Kaczetow, W. (2008) · Multivariate Behavioral Research · doi:10.1080/00273170802285693 · Cited by 108 · cited 1×
“Therefore, semPower 2 interfaces four different data generation methods, namely Foldnes and Olsson (2016), Qu et al. (2020), Ruscio and Kaczetow (2008), and Vale and Maurelli (1983), each of which is associated with different multivariate distributions that may affect the empirically observed χ 2…”
Method17 Robust Procedures in Structural Equation Modeling
Yuan, K., & Bentler, P. M. (2007) · Elsevier eBooks · doi:10.1016/b978-044452044-9/50020-3 · Cited by 71 · cited 2×
“If the H0 model is correct, assuming multivariate normality, a sufficiently large sample size, and several mild regularity conditions (Browne, 1984; Yuan & Bentler, 2007), (1)”
BackgroundMethodOn Congruence and Incongruence of Measures of Fit in Structural Equation Modeling
Moshagen, M., & Auerswald, M. (2018) · Psychological methods · doi:10.1037/met0000122 · Cited by 70 · cited 1×
“Of note, the actual effect in terms of F 0 not only is a function of the parameters that differ between the H0 and the H1 model, but also depends on all other parameters in the model (e.g., Moshagen & Auerswald, 2018; Wang & Rhemtulla, 2021).”
BackgroundSelf-citationFoldnes, N., & Olsson, U. H. (2016) · Multivariate Behavioral Research · doi:10.1080/00273171.2015.1133274 · Cited by 53 · cited 1×
“Therefore, semPower 2 interfaces four different data generation methods, namely Foldnes and Olsson (2016), Qu et al. (2020), Ruscio and Kaczetow (2008), and Vale and Maurelli (1983), each of which is associated with different multivariate distributions that may affect the empirically observed χ 2…”
MethodYuan, K., Hayashi, K., & Bentler, P. M. (2006) · Journal of Multivariate Analysis · doi:10.1016/j.jmva.2006.08.005 · Cited by 45 · cited 1×
“…(KS) distance measures the discrepancy between the empirical and the reference cumulative distribution functions akin to the Kolmogorov–Smirnov test statistic, but relies on the average, rather than the maximum, absolute distance, KS = M ( F e ( x ) − F r ( x ) ) (see Yuan et al., 2007).”
BackgroundHow General is the Vale–Maurelli Simulation Approach?
Foldnes, N., & Grønneberg, S. (2014) · Psychometrika · doi:10.1007/s11336-014-9414-0 · Cited by 41
A framework for power analysis using a structural equation modelling procedure
Miles, J. N. V. (2003) · BMC Medical Research Methodology · doi:10.1186/1471-2288-3-27 · Cited by 30
Qu, W., Liu, H., & Zhang, Z. (2019) · Behavior Research Methods · doi:10.3758/s13428-019-01291-5 · Cited by 29
The Effect of Latent and Error Non-Normality on Measures of Fit in Structural Equation Modeling
Jobst, L. J., Auerswald, M., & Moshagen, M. (2021) · Educational and Psychological Measurement · doi:10.1177/00131644211046201 · Cited by 16 · cited 1×
“…(2008), and Vale and Maurelli (1983), each of which is associated with different multivariate distributions that may affect the empirically observed χ 2 -distributions differently (e.g., Auerswald & Moshagen, 2015; Foldnes & Grønneberg, 2015; Jobst et al., 2022) and requires different input.”
BackgroundSelf-citationGenerating Correlated, Non-normally Distributed Data Using a Non-linear Structural Model
Auerswald, M., & Moshagen, M. (2015) · Psychometrika · doi:10.1007/s11336-015-9468-7 · Cited by 15 · cited 1×
“…(2008), and Vale and Maurelli (1983), each of which is associated with different multivariate distributions that may affect the empirically observed χ 2 -distributions differently (e.g., Auerswald & Moshagen, 2015; Foldnes & Grønneberg, 2015; Jobst et al., 2022) and requires different input.”
BackgroundSelf-citationNo probifactor model fit index bias, but a propensity toward selecting the best model.
Bader, M., & Moshagen, M. (2022) · Journal of Psychopathology and Clinical Science · doi:10.1037/abn0000685 · Cited by 12 · cited 1×
“…and potentially error-prone, in particular when more complex models are considered and it is desired to define the model in terms of standardized parameters, which requires rather sophisticated knowledge concerning the proper definition of the residual variances (see e.g., Bader & Moshagen, 2022).”
BackgroundSelf-citationZhang, Z., & Liu, H. (2018) · Longitudinal Multivariate Psychology · doi:10.4324/9781315160542-10 · Cited by 8 · cited 1×
“…approaches to statistical power necessarily allow for a model-based definition of the effect of interest, most existing tools implement post hoc power analyses only and are typically limited to particular model types (Kievit et al., 2018; Mulder, 2022; Schoemann et al., 2017; Zhang & Liu, 2018).”
MethodTutorial: How to Generate Missing Data For Simulation StudiesPreprint
Zhang, X.-J. (2021) · doi:10.31234/osf.io/rq6yb · Cited by 2 · cited 1×
“For MAR, semPower 2 implements the percentile method generating the maximum number of missing patterns (Zhang, 2021).”
Method
Research works printed but not linked: 3
- Saris, W. E., & Satorra, A. (1993). Power evaluations in structural equation models. In K. A. Bollen & J. S. Long (Eds.), Testing structural equation models (154th ed., pp. 181–204). Sage.
- Satorra, A., & Saris, W. E. (1983). The accuracy of a procedure for calculating the power of the likelihood ratio test as used within the LISREL framework. In C. O. Middendorp (Ed.), Sociometric research (pp. 129–190). Sociometric Research Foundation.
- Zhang, Z., & Yuan, K.-H. (2018). Practical statistical power analysis using Webpower and R. Isdsa Press. · DOI
Cited by
Sorted by citations
Yao, N., & Wang, Q. (2024) · Heliyon · doi:10.1016/j.heliyon.2024.e34894 · Cited by 150
“The reason for employing SEM was its wide utilization in testing a range of substantive hypotheses, as it has the ability to generate hypotheses that align with the overall research objectives while considering the theoretical framework [64].”
BackgroundRetractedKleine, A., Schaffernak, I., & Lermer, E. (2024) · Computers in Human Behavior Artificial Humans · doi:10.1016/j.chbah.2024.100113 · Cited by 49
Sample-Size Planning in Item-Response Theory: A Tutorial
Schroeders, U., & Gnambs, T. (2025) · Advances in Methods and Practices in Psychological Science · doi:10.1177/25152459251314798 · Cited by 29
Guggemos, J. (2024) · Computers and Education Artificial Intelligence · doi:10.1016/j.caeai.2024.100260 · Cited by 22
Zhang, J., Xia, T., Cheng, Y., Zhou, S., Cai, Z., Zhao, B., & Dadvand, P. (2024) · Cities · doi:10.1016/j.cities.2024.105561 · Cited by 23
Metadata
- Authors
- Moshagen, M., & Bader, M.
- Affiliations
- Universität Ulm (DE)
- Corresponding author
- Moshagen, Morten
- Venue
- Behavior Research Methods
- Published
- 2023-11-10
- Volume
- 56
- Issue
- 4
- Pages
- 2901-2922
- ISSN
- 1554-351X (ISSN-L)
- 1554-3528
- PMC
- PMC11522193
- OpenAlex
- W4388558341
- Cited by
- 308
- References
- 42
- Citations by year
- 2026: 121 · 2025: 133 · 2024: 50 · 2023: 3
- FWCI
- 56.57
- Type
- journal article
- Language
- en
- Open access
- hybrid
- doi.org
- Locations
- Behavior Research Methods (publishedVersion, cc-by)
- PubMed Central (publishedVersion, cc-by)
- PubMed (publishedVersion)
- OPen Access Repositorium der Universität Ulm (OPARU) (Ulm University) (submittedVersion, cc-by)
- Funders
- Universität Ulm
- Topics
- Social Sciences › Decision Sciences › Management Science and Operations Research › Psychometric Methodologies and Testing
- Physical Sciences › Mathematics › Statistics and Probability › Statistical Methods and Bayesian Inference
- Social Sciences › Decision Sciences › Statistics, Probability and Uncertainty › Meta-analysis and systematic reviews
- Keywords
- structural equation modeling, statistical power analysis, sample size determination, a priori power analysis, post hoc power analysis, effect size, multigroup analysis, confirmatory factor analysis, cross-lagged panel model, ARMA models, latent variables
- MeSH terms
- Latent Class Analysis, Data Interpretation, Statistical, Factor Analysis, Statistical, Humans, Software, Models, Statistical, Sample Size
About these checks
Registry, retraction, Cites and statistics results are computed, not judged, with one exception: a printed reference that no index lists is read once by a model before it counts as a citation error. Claims are extracted by a model and kept only when their quote appears verbatim in the text; each cited source is then checked, with a model’s help, for whether it says what the claim relies on. Those verdicts can be wrong — read the claim’s quote and the cited source before relying on one.
Statistics and arithmetic are recomputed, not judged.
Confidence bands are shown only for fields calibrated on our annotated test set. None is calibrated yet, so no band is shown.
What counts as a claim ›How we measure confidence ›How we check this ›
Are you an author, or do you see a problem with this page? Request a review
