

The DOI matches its Crossref record; 40 of the 42 references it cites were found in a registry or an index.
semPower: General power analysis for structural equation models
Open accessAbstract
Structural equation modeling (SEM) is a widespread and commonly used approach to test substantive hypotheses in the social and behavioral sciences. When performing hypothesis tests, it is vital to rely on a sufficiently large sample size to achieve an adequate degree of statistical power to detect the hypothesized effect. However, applications of SEM rarely consider statistical power in informing sample size considerations or determine the statistical power for the focal hypothesis tests performed. One reason is the difficulty in translating substantive hypotheses into specific effect size values required to perform power analyses, as well as the lack of user-friendly software to automate this process. The present paper presents the second version of the R package semPower which includes comprehensive functionality for various types of power analyses in SEM. Specifically, semPower 2 allows one to perform both analytical and simulated a priori, post hoc, and compromise power analysis for structural equation models with or without latent variables, and also supports multigroup settings and provides user-friendly convenience functions for many common model types (e.g., standard confirmatory factor analysis [CFA] models, regression models, autoregressive moving average [ARMA] models, cross-lagged panel models) to simplify power analyses when a model-based definition of the effect in terms of model parameters is desired.
Overview
The claims and statistics of this paper haven’t been checked yet.
Run the check — free, no account needed. It reads the open-access text and checks the sources it cites.
Integrity signals
Registry
Cites
Statistics
Figures
Verification
Claims the paper makes
The claims and statistics of this paper haven’t been checked yet.
Run the check — free, no account needed. It reads the open-access text and checks the sources it cites.
Claims other papers make about this one
Each is checked against this paper’s own text: does it say what the citing paper says it does?
The source backs part of the claim, not all of it — or backs it for a different population, condition or comparison.
In the citing paper
“Based on these parameters, the minimum required sample size was estimated at 342 participants [29].”
From Psychological inflexibility mediates the relationship between mindfulness and psychological distress in Peruvian parents with school age children. (2026) · cites this paper as [29]
Experimental — accuracy not yet measured
Self-check
Percentages, sums and reported differences re-computed from the paper’s own numbers.
The self-check needs the paper’s full text.
Citations
Cites
Faul, F., Erdfelder, E., Lang, A.-G., & Buchner, A. (2007) · Behavior Research Methods · doi:10.3758/bf03193146 · Cited by 65,971 · cited 2×
“In a power analysis, one of these quantities is computed as a function of the other quantities, giving rise to different types of power analyses (Faul et al., 2007).”
BackgroundMethodlavaan : An R Package for Structural Equation Modeling
Rosseel, Y. (2012) · Journal of Statistical Software · doi:10.18637/jss.v048.i02 · Cited by 27,955 · cited 1×
“…the model implementing the null hypothesis of interest is then fitted to the population variance–covariance matrix using the lavaan package (Rosseel, 2012), so that the population minimum F 0 along with the resulting model-implied variance covariance matrix ( ̂ 𝚺 ) and mean vector ( ̂ 𝛍…”
MethodEvaluating Goodness-of-Fit Indexes for Testing Measurement Invariance
Cheung, G. W., & Rensvold, R. B. (2002) · Structural Equation Modeling: A Multidisciplinary Journal · doi:10.1207/s15328007sem0902_5 · Cited by 16,280 · cited 1×
“For example, it has been suggested that a decline of ≥ .02 in the Mc associated with a metric in comparison to a configural invariance model may be considered a meaningful departure from measurement invariance (Cheung & Rensvold, 2002).”
BackgroundPower analysis and determination of sample size for covariance structure modeling.
MacCallum, R. C., Browne, M. W., & Sugawara, H. M. (1996) · Psychological Methods · doi:10.1037/1082-989x.1.2.130 · Cited by 10,418 · cited 2×
“…of a measure that shows a direct relation to the non-centrality parameter, which is afforded by all non-centrality-based measures of fit such as the minimum of the employed fitting function itself or derived indices such as the RMSEA (because F 0 = df ∙ RMSEA 2 ; e.g., MacCallum et al., 1996).”
MethodCurran, P. J., West, S. G., & Finch, J. F. (1996) · Psychological Methods · doi:10.1037/1082-989x.1.1.16 · Cited by 5,512 · cited 1×
“When the comparison is performed against the saturated model, however, simulated power is often higher as a consequence of the well-documented positive bias of the model test when the assumptions are violated (e.g., Curran et al., 1996; Moshagen, 2012).”
MethodHow to Use a Monte Carlo Study to Decide on Sample Size and Determine Power
Muthén, L. K., & Muthén, B. O. (2002) · Structural Equation Modeling: A Multidisciplinary Journal · doi:10.1207/s15328007sem0904_8 · Cited by 2,362
Reporting practices in confirmatory factor analysis: an overview and some recommendations
Jackson, D. L., Gillaspy, J. A., & Purc-Stephenson, R. (2009) · Psychological Methods · doi:10.1037/a0014694 · Cited by 2,242 · cited 8×
“Existing tools providing analytical power analyses specifically for SEM (e.g., MacCallum et al., 1996, 2006; Preacher & Coffman, 2006) require provision of a non-centrality-based measure of effect such as the RMSEA and are thus limited to a model-free approach.”
BackgroundInfluentialAsymptotically distribution-free methods for the analysis of covariance structures.
Browne, M. (1984) · British Journal of Mathematical & Statistical Psychology · doi:10.1111/j.2044-8317.1984.tb00789.x · Cited by 1,890 · cited 2×
“If the H0 model is correct, assuming multivariate normality, a sufficiently large sample size, and several mild regularity conditions (Browne, 1984; Yuan & Bentler, 2007), (1)”
MethodYuan, K.-H., & Bentler, P. (2000) · Sociological Methodology · doi:10.1111/0081-1750.00078 · Cited by 1,847 · cited 1×
“…= list(estimator = ' mlr ' ) leads to a simulated power estimate relying on a corrected test statistic that is asymptotically equivalent to the Yuan & Bentler (2000) statistic, whereas the analytic power estimate is still based on the asymptotically expected distributions based on ML.…”
Determining power and sample size for simple and complex mediation models
Schoemann, A. M., Boulton, A. J., & Short, S. D. (2017) · Social Psychological and Personality Science · doi:10.1177/1948550617715068 · Cited by 1,837 · cited 1×
“…approaches to statistical power necessarily allow for a model-based definition of the effect of interest, most existing tools implement post hoc power analyses only and are typically limited to particular model types (Kievit et al., 2018; Mulder, 2022; Schoemann et al., 2017; Zhang & Liu, 2018).”
Method
Research works printed but not linked: 3
- Saris, W. E., & Satorra, A. (1993). Power evaluations in structural equation models. In K. A. Bollen & J. S. Long (Eds.), Testing structural equation models (154th ed., pp. 181–204). Sage.
- Satorra, A., & Saris, W. E. (1983). The accuracy of a procedure for calculating the power of the likelihood ratio test as used within the LISREL framework. In C. O. Middendorp (Ed.), Sociometric research (pp. 129–190). Sociometric Research Foundation.
- Zhang, Z., & Yuan, K.-H. (2018). Practical statistical power analysis using Webpower and R. Isdsa Press. · DOI
Cited by
Sorted by citations
Yao, N., & Wang, Q. (2024) · Heliyon · doi:10.1016/j.heliyon.2024.e34894 · Cited by 150
“The reason for employing SEM was its wide utilization in testing a range of substantive hypotheses, as it has the ability to generate hypotheses that align with the overall research objectives while considering the theoretical framework [64].”
BackgroundRetractedKleine, A., Schaffernak, I., & Lermer, E. (2024) · Computers in Human Behavior Artificial Humans · doi:10.1016/j.chbah.2024.100113 · Cited by 49
Sample-Size Planning in Item-Response Theory: A Tutorial
Schroeders, U., & Gnambs, T. (2025) · Advances in Methods and Practices in Psychological Science · doi:10.1177/25152459251314798 · Cited by 29
Guggemos, J. (2024) · Computers and Education Artificial Intelligence · doi:10.1016/j.caeai.2024.100260 · Cited by 22
Zhang, J., Xia, T., Cheng, Y., Zhou, S., Cai, Z., Zhao, B., & Dadvand, P. (2024) · Cities · doi:10.1016/j.cities.2024.105561 · Cited by 23
Ngo, T. T. A., Nguyen, K. B., Pham, M., Tran, N. X., Tran, H., & Dao, C. T. (2025) · Acta Psychologica · doi:10.1016/j.actpsy.2025.105639 · Cited by 17
Novotny, M., Weber, W., Kern, C. A., & Kreuter, F. (2025) · AI & Society · doi:10.1007/s00146-025-02478-5 · Cited by 22
Todorovic, L., Bozhar, H., de Rooij, S. R., Bogaerts, A., Boyer, B. E., & Larsen, H. (2025) · Journal of Research on Adolescence · doi:10.1111/jora.70076 · Cited by 16
“An a priori power analysis was conducted in RStudio (Posit Team, 2024) using the semPower package (Moshagen & Bader, 2023), and it indicated that 239 participants were necessary to observe medium (0.3) cross-lagged effects with good power (0.8) and that 2227 participants were necessary to observe…”
InfluentialThe DOES Scale: Measuring Sensory Processing Sensitivity as a Trait Constellation
Gubler, D. A., Janelt, T., Roth, M., Schlegel, K., Guggisberg, J., & Troche, S. J. (2024) · Journal of Personality Assessment · doi:10.1080/00223891.2024.2405536 · Cited by 19
“A model-free power analysis was conducted using the semPower package (Moshagen & Bader, 2023) to determine the sample size for the global model fit criteria.”
Reconceptualizing the desire‐intention relationship in the Model of Goal Directed Behavior
Atakan, S. S., & Bagozzi, R. P. (2024) · Psychology and Marketing · doi:10.1002/mar.22107 · Cited by 19
Wah, J. (2025) · J. Cases Inf. Technol. · doi:10.4018/jcit.369092 · Cited by 14
Peng, B., Chen, W.-S., Wang, H.-S., & Yu, T. (2025) · PLoS ONE · doi:10.1371/journal.pone.0324588 · Cited by 13
“First, a power analysis for SEM was conducted using semPower[66], with the following parameters: desired power of 0.80, alpha level of 0.05, RMSEA as the effect measure, an effect size of 0.05, degrees of freedom (df) of 50, and 12 manifest variables.”
InfluentialLiu, L., Feng, S., Zhang, Y., Xiao, G., Zhou, M., Li, X., Li, Y., & Qin, C. (2025) · BMC Pregnancy and Childbirth · doi:10.1186/s12884-025-07481-8 · Cited by 13
“Sample size was estimated using a web-frontend for “semPower 2” (an R-package providing a collection of functions to perform a-priori, post-hoc, and compromise power analyses for structural equation models (SEMs)) [35].”
Li, Q., Xie, R., & Li, M. (2025) · International Journal of Educational Technology in Higher Education · doi:10.1186/s41239-025-00521-5 · Cited by 20
Teachers’ job engagement: the personal and job resources that matter
Sheridan, L., Alonzo, D., Nguyen, H. T. M., Gao, X. A., & Durksen, T. L. (2025) · Humanities and Social Sciences Communications · doi:10.1057/s41599-025-05009-1 · Cited by 17
Al-Amer, R. M., Malak, M. Z., Shuhaiber, A., Aburoomi, R. J., & Darwish, M. M. (2025) · New Review of Hypermedia and Multimedia · doi:10.1080/13614568.2025.2487269 · Cited by 8
“The “sem-POWER” tool was used to determine the minimum sample size required to detect the effect among the latent variables (Moshagen & Bader, 2024).”
Wang, M., & Wang, C. (2025) · BMC Psychology · doi:10.1186/s40359-025-03332-5 · Cited by 9
“To determine an adequate sample size for our Structural Equation Modeling (SEM) analyses, we conducted an a priori power analysis using the semPower R package [75].”
Martinez-Soto, L., Ramírez, F. O., Toro-Jaramillo, I.-D., & Moreno-Leyva, N. R. (2024) · PLoS ONE · doi:10.1371/journal.pone.0299671 · Cited by 9
“…of psychometric parameters, gtsummary [59] to obtain sum-mary tables, Hmisc [60] complementary functions for structural equation modeling, tidySEM [61], semPower [45], ad-hoc validity estimation of the sample size and flexible obtaining of tables that allow manipulation in other formats [62].”
MethodSteinhauser, S., & Heid, P. (2026) · R&D Management · doi:10.1111/radm.70038 · Cited by 8
Kim, H. S., Kim, S., & Lee, E.-J. (2025) · Human Communication Research · doi:10.1093/hcr/hqaf005 · Cited by 8
Perceived Abusive Supervision and Service Performance: An Attachment Theory Perspective
Mostafa, A. M. S., Wu, C., Yunus, S., Deng, H., & Zaharie, M. A. (2025) · Human Performance · doi:10.1080/08959285.2025.2463647 · Cited by 10
“However, we achieved strong statistical power (1.00) to evaluate our CFA models in both studies through power analysis for structural equation models (Moshagen & Bader, 2024).”
InfluentialValidation and measurement invariance of the Langer mindfulness scale: the Turkish version
Saraç, M. U., Yıldırım, Y., Eşici, H., Büyüköztürk, Ş., Pagnini, F., & Langer, E. J. (2024) · Frontiers in Psychology · doi:10.3389/fpsyg.2024.1474577 · Cited by 8
Carone, N., Muzi, L., Benzi, I. M. A., Cacioppo, M., Parolin, L. A. L., Santona, A. M. R., & Fontana, A. (2024) · Journal of Interpersonal Violence · doi:10.1177/08862605241285879 · Cited by 10
The Short Stress State Questionnaire in German (SSSQ-G)
Ringgold, V., Shields, G. S., Hauck, F., Kurz, M., Schindler-Gmelch, L., Abel, L., Richer, R., Eskofier, B., & Rohleder, N. (2024) · European Journal of Health Psychology · doi:10.1027/2512-8442/a000160 · Cited by 8
“As this article reports a secondary analysis of data collected in studies yet to be published, we conducted a post-hoc power analysis using semPower (Moshagen & Bader, 2023 ), which showed that for a sample size of 213 with an alpha of .”
Grigoriadou, E., Kolias, P., Theocharidou, M., & Gkioka, M. (2024) · Discover Psychology · doi:10.1007/s44202-024-00153-2 · Cited by 8
“Furthermore, by using an a priori sample size analysis, where a = 0.05, power = 0.8, and the target Goodness-of-fit Index ( GFI ) is at least 0.95, the estimated number of participants is equal to 89 [7].”
InfluentialParticipatory learning environments: student and teacher perspectives on classroom decision-making
Kärner, T., Jüttler, M., Bottling, M., & Weiß, J. K. (2026) · Learning Environments Research · doi:10.1007/s10984-026-09576-1 · Cited by 7
“Based on these parameters, the required minimum sample size was determined using R (version 4.4.1) and the semPower package, which is utilized for power analysis in structural equation modeling (Moshagen & Bader, 2023).”
InfluentialWade, J., Potter, T. S., & Margenot, A. J. (2026) · Geoderma · doi:10.1016/j.geoderma.2026.117702 · Cited by 8
Puhakka, I., Nokelainen, P., & Lehtonen, E. (2025) · Vocations and Learning · doi:10.1007/s12186-025-09377-2 · Cited by 12
“Sufficiency of the sample size for the SEM analysis was examined by conducting power analysis using the semPower package version 2.1.0 ( Moshagen & Bader, 2024).”
InfluentialКимовна, Н.-Б. С., Reznichenko, S. I., Larionow, P., Ariccio, S., Jankowski, J., Kamble, S. V., Mosca, O., Oziemblewska, M., Patil, A. C., Scherba, E. K., et al. (2025) · BMC Psychology · doi:10.1186/s40359-025-03080-6 · Cited by 7
“However, a model-free a priori RMSEA-based power analysis [49] showed that a sample size of N = 104 was sufficient to detect misspecifications of a structure model involving 227 degrees of freedom (which corresponds to the original three-factor LAPS model with 23 manifest variables) at RMSEA effect…”
Zhou, S., Weiss, H. A., McCuskey, B. M., & Tay, L. (2025) · Journal of Happiness Studies · doi:10.1007/s10902-025-00906-3 · Cited by 10
“Overall, the power for each CFA test (using the semPower package and following recommendations by Moshagen & Bader, 2023) was greater than 0.999.”
InfluentialHe, J.-B., Cheng, L.-T., Cui, S.-Q., Wu, S., Jiang, Z., & Nagata, J. M. (2025) · Body image · doi:10.1016/j.bodyim.2025.101862 · Cited by 7
Cross-Analysis of mHealth Social Acceptance Among Youth: A Comparative Study Between Japan and China
Akiogbe, O., Feng, H., Kurata, K., Niwa, M., Cao, J., Zhang, S., Kageyama, I., Kobayashi, Y., Lim, Y., & Kodama, K. (2025) · Behavioral Science · doi:10.3390/bs15020213 · Cited by 7
“A post hoc power analysis was conducted to evaluate the adequacy of the sample size for detecting the hypothesized model fit using root mean square error of approximation (RMSEA) = 0.05 as the effect size (Jobst et al., 2021; Moshagen & Bader, 2023).”
InfluentialOrm, S., Wood, J. J., Fossum, I. N., Adams, K., Andersen, P. N., Fjermestad, K. W., Øie, M. G., & Skogli, E. W. (2025) · Research on Child and Adolescent Psychopathology · doi:10.1007/s10802-025-01292-3 · Cited by 8
“We run a post-hoc power analysis using semPower (Moshagen & Bader, 2024).”
Veerman, L. K. M., Orm, S., Fjermestad, K., Vatne, T., Haukeland, Y., Sterkenburg, P., & Willemen, A. (2024) · International Journal of Developmental Disabilities · doi:10.1080/20473869.2024.2411511 · Cited by 7
Edri-Peer, O., & Cohen, N. (2024) · Public Management Review · doi:10.1080/14719037.2024.2399145 · Cited by 7
Meng, M., Su, R.-H., Kogiso, K., Zheng, R.-R., Chen, L., Wei, W., Wei, L., & Hsu, M.-C. (2024) · Frontiers in Psychology · doi:10.3389/fpsyg.2024.1415196 · Cited by 7
Periañez, C. A. H., Jaramillo-Bolívar, C. D., & Castillo-Díaz, M. A. (2025) · BMC Nursing · doi:10.1186/s12912-025-04044-2 · Cited by 4
Development and Differentiation of Executive Function Structure
Yangüez, M., Bediou, B., Bavelier, D., & Chanal, J. P. (2025) · Journal of Cognition and Development · doi:10.1080/15248372.2025.2547621 · Cited by 9
Xiao, Y., Barnhart, W. R., Wu, S., Jiang, Z., Nagata, J. M., & He, J. (2025) · Body Image · doi:10.1016/j.bodyim.2025.101933 · Cited by 7
Problem-solving: development and validation of a short instrument for higher education
Ventura-León, J., Lino-Cruz, C., Tocto-Muñoz, S., Sánchez-Villena, A., & Gamboa-Melgar, G. (2025) · Frontiers in Education · doi:10.3389/feduc.2025.1555167 · Cited by 6
Benzi, I. M. A., Fontana, A., Carone, N., Sideli, L., Locati, F., Parolin, L. A. L., & Ensink, K. (2024) · Journal of Adolescence · doi:10.1002/jad.12449 · Cited by 7
“An initial power analysis was conducted to select the minimum number of participants required to detect at least small effects, utilizing the semPower package in R (Moshagen and Bader 2023).”
Ling, B., Ao, X., & Liu, Z. (2024) · Acta Psychologica · doi:10.1016/j.actpsy.2024.104568 · Cited by 5
Zappullo, I., Senese, V. P., Trojano, L., Cecere, R., & Conson, M. (2024) · Frontiers in Human Neuroscience · doi:10.3389/fnhum.2024.1436362 · Cited by 6
Bianchi, M., Donizzetti, A. R., Palumbo, F., & Caso, D. (2024) · Health & Social Care in the Community · doi:10.1155/hsc/6626066 · Cited by 8
Music in Mood Regulation Brief Scale (B-MMR)
Ansani, A., Mallia, L., & Saarikallio, S. H. (2025) · Music Perception An Interdisciplinary Journal · doi:10.1525/mp.2025.2326557 · Cited by 5
Christian, M. M., Kiketa, V., Kutangila, D. M., Mampuya, P. H. K., Mukenze, J. N., Kasunzi, L. M., Kyamakya, K., Tashev, T., & Kasereka, S. K. (2025) · IEEE Access · doi:10.1109/access.2025.3596680 · Cited by 4
“This technique integrates spatial dependencies directly into structural equation models, giving a comprehensive view of causal relationships while accounting for spatial autocorrelation [44], [45].”
Mayende, T. S., Musenze, I. A., Mpaata, K. A., & Nkurunziza, G. (2025) · SN Business & Economics · doi:10.1007/s43546-025-00999-1 · Cited by 5
Özdemir, N. G., Dalcalı, B. K., & Berşe, S. (2025) · BMC Medical Education · doi:10.1186/s12909-025-08079-6 · Cited by 6
Interest and effort in learning and performance
Kehle, L., & Urhahne, D. (2025) · British Journal of Educational Psychology · doi:10.1111/bjep.70040 · Cited by 5
“An a priori power analysis was conducted with semPOWER (Moshagen & Bader, 2024), which resulted in a minimum sample size of 89 participants assuming typical conditions for conducting structural equation modelling (Cronbach's α = .05, 1 − β = .80, RMSEA = .04, df = 707).”
Factors affecting investment decision in Indonesia: Mediating role of intention to invest
Maulana, H., Ulya, A. Z. S., Syahruddin, S., Abadi, M. K. R., Hastuti, E. W., & Harahap, S. A. R. (2025) · Jurnal Ekonomi & Keuangan Islam · doi:10.20885/jeki.vol11.iss2.art6 · Cited by 5
“This model serves as a method for testing research indicators, which can be assessed through convergent and discriminant validity tests (Moshagen & Bader, 2024).”
The determinants of the quality of life across the world
Yum, S. (2025) · Quality & Quantity: International Journal of Methodology · doi:10.1007/s11135-025-02316-2 · Cited by 5
“This study employs SPSS and AMOS 28 for the SEM analysis and apply the Maximum Likelihood method (see e.g., Hyvärinen et al. 2024; Moshagen and Bader 2024; Zyphur et al. 2023).”
Holopainen, A., Verhage, M., Schuengel, C., Tharner, A., & Oosterman, M. (2025) · Parenting · doi:10.1080/15295192.2025.2478981 · Cited by 5
Su, Y.-H., Chiou, J.-M., Shiu, C., Chen, J.-H., & Chen, Y.-C. (2025) · Journal of the American Medical Directors Association · doi:10.1016/j.jamda.2025.105544 · Cited by 5
Visual-spatial skills and children’s math development
Poltz, N., Ehlert, A., Quandte, S., Kucian, K., von Aster, M., & Esser, G. (2025) · Learning and Instruction · doi:10.1016/j.learninstruc.2025.102246 · Cited by 5
Addressing Vaccine Hesitancy: Validating the PACV Survey for Croatian Parents
Ćurković, A., & Matana, A. (2025) · Infectious Disease Reports · doi:10.3390/idr17010003 · Cited by 5
Irmer, J. P., Klein, A., & Schermelleh-Engel, K. (2024) · Behavior Research Methods · doi:10.3758/s13428-024-02507-z · Cited by 7
“The pwr package (Champely, 2020) and WebPower (Zhang & Yuan, 2018) offer implementations for power analysis of many basic statistical tests in R (R Core Team, 2023), with extensions also available for linear structural equation models (SEM, see also Moshagen & Bader, 2024, for an implementation).”
MethodZhang, Y., & Ma, Z. (2024) · Applied Psychology Health and Well-Being · doi:10.1111/aphw.12599 · Cited by 5
Contracting for circularity: How circular economy clauses shape market and financial performance
Castro-López, A., Iglesias, V., & Santos-Vijande, M. L. (2026) · Journal of Purchasing and Supply Management · doi:10.1016/j.pursup.2026.101153 · Cited by 4
Pacheco, I. M., van der Werff, E., & Steg, L. (2025) · Journal of Environmental Psychology · doi:10.1016/j.jenvp.2025.102890 · Cited by 3
Zenger, L., Flunger, B., & van Gog, T. (2025) · Learning and Individual Differences · doi:10.1016/j.lindif.2025.102755 · Cited by 6
Chen, S., & Wan, Z. (2025) · Psychology Research and Behavior Management · doi:10.2147/prbm.s539792 · Cited by 4
Chen, J.-F., Liu, K., Cheng, Q., & Wang, L. (2025) · BMC Public Health · doi:10.1186/s12889-025-23842-6 · Cited by 4
Oliveira, S., Maçarico, T., Pacheco, R., Janeiro, I. N., & Pinto, A. M. (2025) · European Journal of Investigation in Health Psychology and Education · doi:10.3390/ejihpe15080162 · Cited by 4
Nguyen, K. V., Olson, I. R., & Newcombe, N. S. (2025) · Journal of Experimental Psychology General · doi:10.1037/xge0001805 · Cited by 5
“A power analysis using semPower in R (Moshagen & Bader, 2024) with a moderate effect size of .15, α of .05, assumed regression slope between latent variables of .20, and the smallest degrees of freedom for planned factor analysis models ( df = 12) revealed a sample size of at least 66 was adequate…”
Zhang, Y., & Ma, Z. (2025) · Anxiety Stress & Coping · doi:10.1080/10615806.2025.2512922 · Cited by 3
“To ensure our sample size was adequate, we conducted a post hoc power analysis using the semPower package (Moshagen & Bader, 2023).”
Scheffer, J. A., Levan, D. T., Wells, J. L., Gallagher-Thompson, D. E., Grimm, K. J., Chen, K., Brown, C. K., Bullard, B. M., Yee, C., Newton, S. L., et al. (2025) · Clinical Gerontologist · doi:10.1080/07317115.2025.2499812 · Cited by 7
“Using the semPower package in R (Moshagen & Bader, 2023), an a priori power analysis indicated that for a condition effect on a linear slope in the model of .05 (small) with 80% power and alpha of .05 with 145 degrees of freedom in the model, we would require 133 participants.”
Meyfroodt, K., Desmidt, S., & Crucke, S. (2025) · Public Performance & Management Review · doi:10.1080/15309576.2025.2491420 · Cited by 4
Cao, Y., & Alyousuf, F. Q. A. (2025) · Journal of Big Data · doi:10.1186/s40537-025-01061-5 · Cited by 4
“This index is one of the model fit indices that show the power of predicting the dependent variable (criterion) based on the independent variables (predictor) [95].”
Socioeconomic status self‐deception as a way to perpetuate classist societies
Melita, D., Alcañiz‐Colomer, J., Matamoros‐Lima, J., Ríos, S. A., & Moya, M. (2024) · Political Psychology · doi:10.1111/pops.13051 · Cited by 4
“With a sample size as large as this, we estimated to be able to detect an effect size ꞵ ≥ .099 with 95% power and alpha = .05 (estimation with package semPower ; Moshagen & Bader, 2024; constant unidirectional causal effects, and constant autoregressive effects set to ꞵ = .070).”
Tata, D. D., Bianchi, D., Rossi, F., Fatta, L. M., Sette, S., & Laghi, F. (2024) · Eating and Weight Disorders - Studies on Anorexia Bulimia and Obesity · doi:10.1007/s40519-024-01687-z · Cited by 5
Şenel, E., & Sakallı, D. (2024) · Pamukkale spor bilimleri dergisi · doi:10.54141/psbd.1437210 · Cited by 4
Developing to sustain: how informal learning shapes university students’ future careers
Gemmano, C. G., & Manuti, A. (2026) · Education + Training · doi:10.1108/et-05-2025-0370 · Cited by 3
Xu, L., Li, Y.-Y., Chan, T.-H., & Saleem, F. (2026) · Frontiers in Psychology · doi:10.3389/fpsyg.2026.1699919 · Cited by 3
“Furthermore, a G*Power analysis was conducted to justify the adequacy of the sample size (Moshagen and Bader, 2024).”
Hankin, B. L., Brandes, C. M., & Young, J. F. (2026) · Journal of the American Academy of Child & Adolescent Psychiatry · doi:10.1016/j.jaac.2026.01.017 · Cited by 3
“All analyses were conducted using R packages dplyr, 39 fungible, 40 psych, 41 semPower, 42 and sjmisc.”
Motivational Pathways Diverge Between Frequent and Problematic Pornography Use
Csányi, E., Veszprémi, M. D., Zsido, A. N., & Meskó, N. (2025) · International Journal of Sexual Health · doi:10.1080/19317611.2025.2605517 · Cited by 3
Liu, Y.-L., Li, X., Fang, Y., Yu, L., Li, Y.-Y., Teng, Z.-W., & Zeng, Y. (2025) · BMC Public Health · doi:10.1186/s12889-025-25467-1 · Cited by 3
Navas-León, S., Tajadura‐Jiménez, A., Morales, L., Mas, M. D. L. M. B., Navarro, M. L. A., & Sánchez-Martín, M. (2025) · BMC Psychology · doi:10.1186/s40359-025-03476-4 · Cited by 4
An Exploratory Study of Chatbot-Based Mindfulness for Mental Health Support
Wang, Y., & Farb, N. A. S. (2025) · Mindfulness · doi:10.1007/s12671-025-02685-7 · Cited by 6
Daud, M., Siswanti, D. N., & Nugraha, D. Y. (2025) · Cogent Psychology · doi:10.1080/23311908.2025.2520665 · Cited by 3
“…was carried out when applied under different method conditions (hair et al., 2019b). this evaluation includes power assessment parameters (Moshagen & Bader, 2024), robustness check tests using the Ramsey’s ReSet method (Ramsey, 1969; Sarstedt et al., 2020), and sensitivity analysis with…”
Murgueitio, N., Trueba, A. F., & Pluck, G. C. (2025) · Children and Youth Services Review · doi:10.1016/j.childyouth.2025.108430 · Cited by 3
Casale, S., Ghinassi, S., & Elhai, J. D. (2025) · Journal of Behavioral Addictions · doi:10.1556/2006.2025.00075 · Cited by 3
Hsu, B., Hsu, Y., & Weng, C. (2025) · Psychophysiology · doi:10.1111/psyp.70132 · Cited by 3
The role of social media in constructing meaning in life: a SEM analysis
Tran, C., Pikó, B., & Nguyen, T. V. (2025) · i-com · doi:10.1515/icom-2024-0060 · Cited by 3
Psychometric properties of the Italian Traumatic Grief Inventory-Self Report Plus (TGI-SR+)
Lenzo, V., Fontana, A., Santoro, G., Cuzzocrea, G., Miniati, V., Quattropani, M., Boelen, P. A., Caretti, V., Schimmenti, A., & Sideli, L. (2025) · Death Studies · doi:10.1080/07481187.2025.2537978 · Cited by 3
“Based on this criterion, our sample of 308 participants provided adequate statistical power (Moshagen & Bader, 2024).”
Lawrence, J. S., & Wang, Y. (2025) · Self and Identity · doi:10.1080/15298868.2025.2522423 · Cited by 4
“In order to explore this concern, we conducted a post hoc power analysis using the semPower software and the analytical model-free power analysis (Moshagen & Bader, 2024).”
Fox, J., Gaul, C., Kuhlencord, M., Peperkorn, N., Ohse, J., Krutzki, J., & Shiban, Y. (2025) · Headache · doi:10.1111/head.14988 · Cited by 3
“The analysis was performed using R (version 4.4.2; R Core Team, 2023), and the packages semPower (version 2.1.1) 24 and lavaan (version 0.6–19).”
InfluentialShani, M., Berns, M., Bergen, L., Richters, S., Krämer, K., de Lede, S., & van Zalk, M. H. W. (2025) · Social Inclusion · doi:10.17645/si.10122 · Cited by 4
“A priori power analysis using the semPower package (Moshagen & Bader, 2023) indicated that 792 participants would provide adequate power (80”
Cross-Cultural Adaptation of the Short Dark Tetrad (SD4) in the Brazilian Context
Guilhermino, C. S., Bonfá-Araujo, B., de Azevedo, T. G., Silva, J. L. P., Hauck, N., Bandeira, P., Tondin, C. F., & Alvarenga, M. A. S. (2025) · Psychological Test Adaptation and Development · doi:10.1027/2698-1866/a000100 · Cited by 3
Carrola, P. A., Han, E., Rocha, J., Valles, A. C., Valles, M. N. G., Martínez, J. R. L., & Anguiano, J. (2025) · doi:10.1080/07481756.2024.2401438 · Cited by 3
“In addition, we calculated the prior sample size requirement using lavaan and semPower2 package within R (Moshagen & Bader, 2023), which recommended the number of participants of 190 with desired power of .80, alpha of .05, and factor correlation of .25 with 10 indicators for each factor.”
Fang, C., Li, C.-H., Ma, S., Hwang, F., Martins, M. M., & Chou, F. (2025) · BMC Nursing · doi:10.1186/s12912-025-03012-0 · Cited by 2
Ocsovszky, Z., Ehrenberger, B., Berényi, B., Assabiny, A., Otohal, J., Martos, T., Papp-Zipernovszky, O., Hegedus, F., Merkely, B., Csabai, M., et al. (2024) · Frontiers in Public Health · doi:10.3389/fpubh.2024.1400849 · Cited by 3
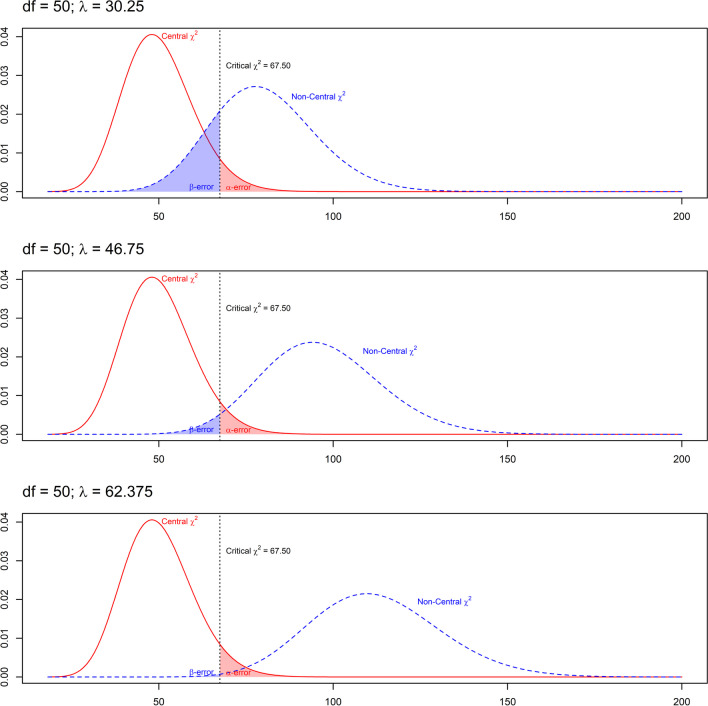
“Statistical power complements the beta error and gives the probability of rejecting a null hypothesis if this hypothesis is factually wrong (and thus to accept a true alternative hypothesis) (38).”
BackgroundMethodInfluentialSilent ripples: negative CSR associations' impact in non-crisis situations
Moon, B., Choi, C., & Kim, E. (2024) · Corporate Communications. An International Journal · doi:10.1108/ccij-01-2024-0014 · Cited by 3
Stay at Home Behavior during COVID-19: The Role of Person-Home Relationships
Ariccio, S., & Theodorou, A. (2024) · Journal of Environmental Psychology · doi:10.1016/j.jenvp.2024.102334 · Cited by 3
Tadros, E., Le, A.-K. N., & Gregorash, A. (2024) · Substance Use Research and Treatment · doi:10.1177/29768357241284097 · Cited by 3
Judgments and beliefs about climate change: measurement, stability, and behavioral consequences
Hilbig, B. (2024) · Judgment and Decision Making · doi:10.1017/jdm.2024.33 · Cited by 3
Kelleher, S. M., Ciardha, C. Ó., & Ildeniz, G. (2026) · Journal of Criminal Justice · doi:10.1016/j.jcrimjus.2026.102619 · Cited by 3
Bartholdy, S., Zimmer, R. I., Hermann, A., Stark, R. M., Brakemeier, E., & Kaiser, T. (2026) · Psychological Test Adaptation and Development · doi:10.1027/2698-1866/a000122 · Cited by 4
Managing multiple accounts for identity construction on Instagram: A privacy management framework
Yuan, C. W., Chiu, H.-C., & Wohn, D. Y. (2026) · New Media & Society · doi:10.1177/14614448261424891 · Cited by 3
Passeggia, R., & Esposito, G. (2026) · Current Psychology · doi:10.1007/s12144-026-09117-2 · Cited by 1
Han, J., Powers, T. E., Waldhuber, M., Short, J., & Swiecki, Z. (2026) · Higher Education Research & Development · doi:10.1080/07294360.2026.2615301 · Cited by 2
Metadata
- Authors
- Moshagen, M., & Bader, M.
- Affiliations
- Universität Ulm (DE)
- Corresponding author
- Moshagen, Morten
- Venue
- Behavior Research Methods
- Published
- 2023-11-10
- Volume
- 56
- Issue
- 4
- Pages
- 2901-2922
- ISSN
- 1554-351X (ISSN-L)
- 1554-3528
- PMC
- PMC11522193
- OpenAlex
- W4388558341
- Cited by
- 308
- References
- 42
- Citations by year
- 2026: 121 · 2025: 133 · 2024: 50 · 2023: 3
- FWCI
- 56.57
- Type
- journal article
- Language
- en
- Open access
- hybrid
- doi.org
- Locations
- Behavior Research Methods (publishedVersion, cc-by)
- PubMed Central (publishedVersion, cc-by)
- PubMed (publishedVersion)
- OPen Access Repositorium der Universität Ulm (OPARU) (Ulm University) (submittedVersion, cc-by)
- Funders
- Universität Ulm
- Topics
- Social Sciences › Decision Sciences › Management Science and Operations Research › Psychometric Methodologies and Testing
- Physical Sciences › Mathematics › Statistics and Probability › Statistical Methods and Bayesian Inference
- Social Sciences › Decision Sciences › Statistics, Probability and Uncertainty › Meta-analysis and systematic reviews
- Keywords
- structural equation modeling, statistical power analysis, sample size determination, a priori power analysis, post hoc power analysis, effect size, multigroup analysis, confirmatory factor analysis, cross-lagged panel model, ARMA models, latent variables
- MeSH terms
- Latent Class Analysis, Data Interpretation, Statistical, Factor Analysis, Statistical, Humans, Software, Models, Statistical, Sample Size
About these checks
Registry, retraction, Cites and statistics results are computed, not judged, with one exception: a printed reference that no index lists is read once by a model before it counts as a citation error. Claims are extracted by a model and kept only when their quote appears verbatim in the text; each cited source is then checked, with a model’s help, for whether it says what the claim relies on. Those verdicts can be wrong — read the claim’s quote and the cited source before relying on one.
Statistics and arithmetic are recomputed, not judged.
Confidence bands are shown only for fields calibrated on our annotated test set. None is calibrated yet, so no band is shown.
What counts as a claim ›How we measure confidence ›How we check this ›
Are you an author, or do you see a problem with this page? Request a review
