

The DOI matches its Crossref record; 255 of the 255 references it cites were found in a registry or an index.
From lithium to sodium: cell chemistry of room temperature sodium–air and sodium–sulfur batteries
Open accessAbstract
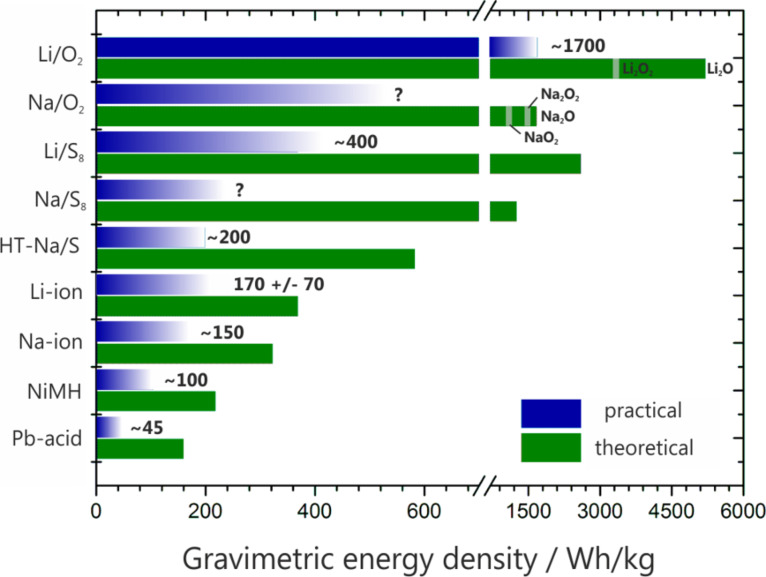
Research devoted to room temperature lithium-sulfur (Li/S8) and lithium-oxygen (Li/O2) batteries has significantly increased over the past ten years. The race to develop such cell systems is mainly motivated by the very high theoretical energy density and the abundance of sulfur and oxygen. The cell chemistry, however, is complex, and progress toward practical device development remains hampered by some fundamental key issues, which are currently being tackled by numerous approaches. Quite surprisingly, not much is known about the analogous sodium-based battery systems, although the already commercialized, high-temperature Na/S8 and Na/NiCl2 batteries suggest that a rechargeable battery based on sodium is feasible on a large scale. Moreover, the natural abundance of sodium is an attractive benefit for the development of batteries based on low cost components. This review provides a summary of the state-of-the-art knowledge on lithium-sulfur and lithium-oxygen batteries and a direct comparison with the analogous sodium systems. The general properties, major benefits and challenges, recent strategies for performance improvements and general guidelines for further development are summarized and critically discussed. In general, the substitution of lithium for sodium has a strong impact on the overall properties of the cell reaction and differences in ion transport, phase stability, electrode potential, energy density, etc. can be thus expected. Whether these differences will benefit a more reversible cell chemistry is still an open question, but some of the first reports on room temperature Na/S8 and Na/O2 cells already show some exciting differences as compared to the established Li/S8 and Li/O2 systems.
Overview
The claims and statistics of this paper haven’t been checked yet.
Run the check — free, no account needed. It reads the open-access text and checks the sources it cites.
Integrity signals
Registry
Cites
Statistics
Figures
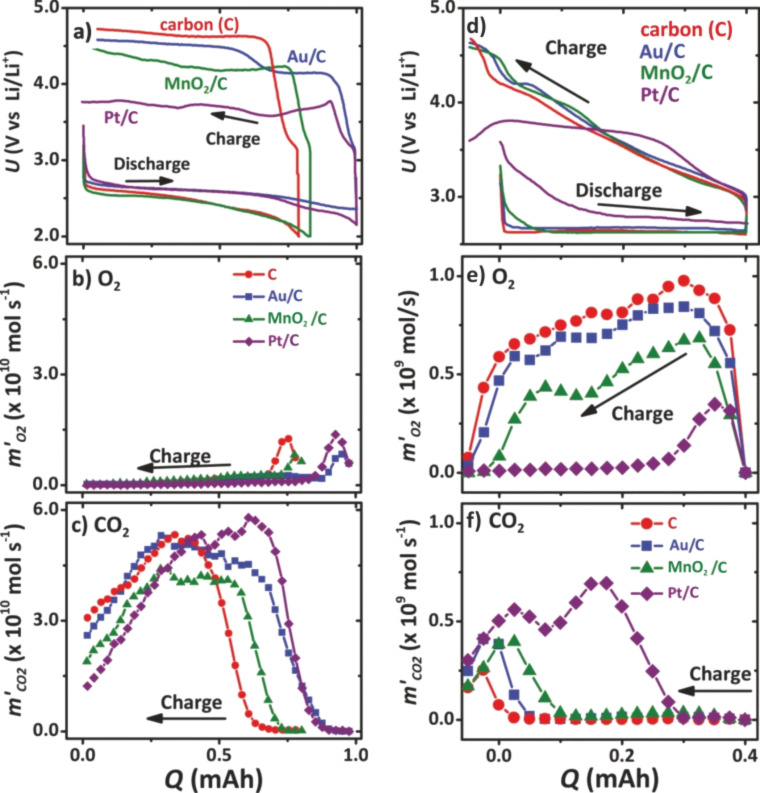
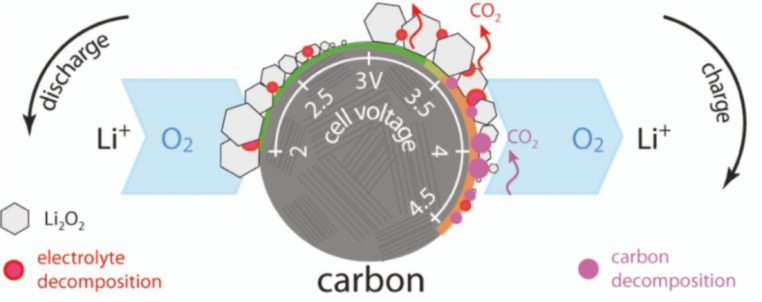
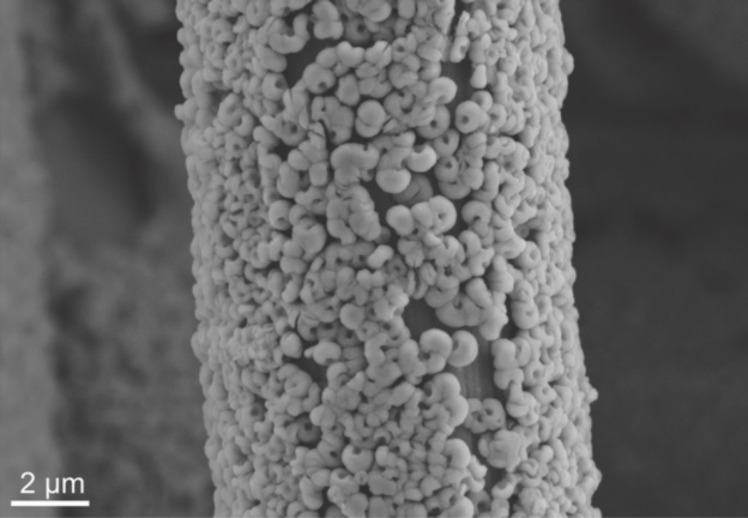
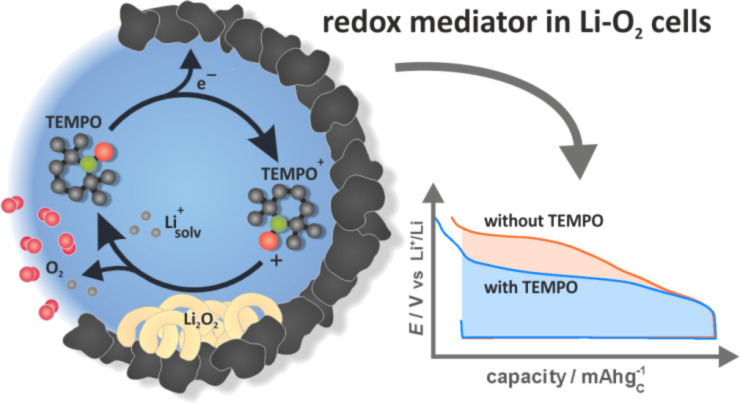

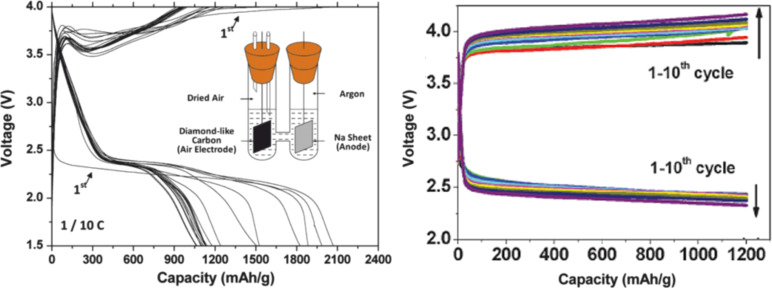
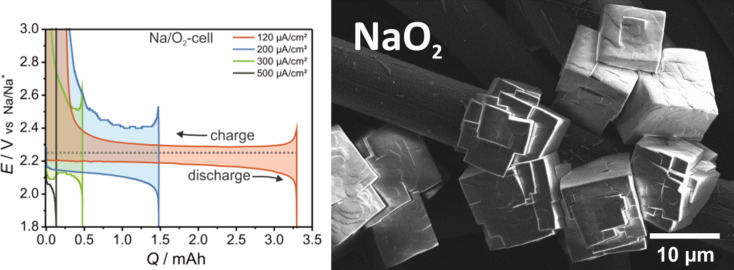
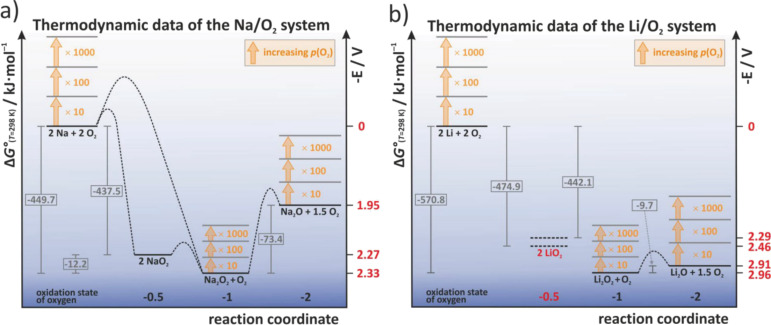
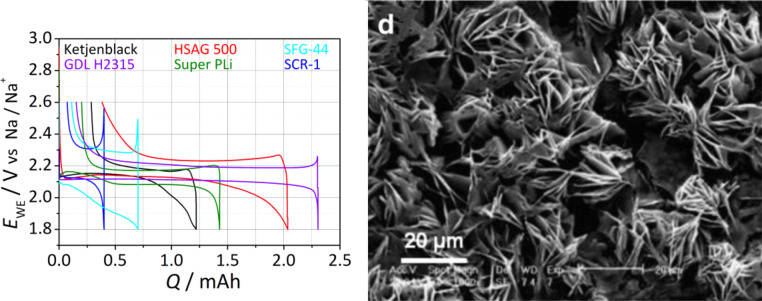

Verification
Claims the paper makes
The claims and statistics of this paper haven’t been checked yet.
Run the check — free, no account needed. It reads the open-access text and checks the sources it cites.
Claims other papers make about this one
Each is checked against this paper’s own text: does it say what the citing paper says it does?
In the citing paper
“The company BASF created a Sodium-air battery with an energy density of 4.5 kWh/L [106].”
From A Review on Electric Vehicles: Technologies and Challenges (2021) · cites this paper as [106]
Self-check
Percentages, sums and reported differences re-computed from the paper’s own numbers.
The self-check needs the paper’s full text.
Citations
Cites
Nonaqueous Liquid Electrolytes for Lithium-Based Rechargeable Batteries
Xu, K. (2004) · Chemical Reviews · doi:10.1021/cr030203g · Cited by 7,653
Challenges in the development of advanced Li-ion batteries: a review
Etacheri, V., Marom, R., Elazari, R., Salitra, G., & Aurbach, D. (2011) · Energy & Environmental Science · doi:10.1039/c1ee01598b · Cited by 6,776
A highly ordered nanostructured carbon–sulphur cathode for lithium–sulphur batteries
Ji, X., Lee, K. T., & Nazar, L. F. (2009) · Nature Materials · doi:10.1038/nmat2460 · Cited by 5,989
A lithium superionic conductor
Kamaya, N., Homma, K., Yamakawa, Y., Hirayama, M., Kanno, R., Yonemura, M., Kamiyama, T., Kato, Y., Hama, S., Kawamoto, K., et al. (2011) · Nature Materials · doi:10.1038/nmat3066 · Cited by 5,061
Rechargeable Lithium–Sulfur Batteries
Manthiram, A., Fu, Y., Chung, S., Zu, C., & Su, Y. (2014) · Chemical Reviews · doi:10.1021/cr500062v · Cited by 4,710
Slater, M. D., Kim, D., Lee, E., & Johnson, C. S. (2012) · Advanced Functional Materials · doi:10.1002/adfm.201200691 · Cited by 4,529
Na-ion batteries, recent advances and present challenges to become low cost energy storage systems
Palomares, V., Serras, P., Villaluenga, I., Hueso, K. B., Carretero‐González, J., & Rojo, T. (2012) · Energy & Environmental Science · doi:10.1039/c2ee02781j · Cited by 3,571
Kim, S., Seo, D., Ma, X., Ceder, G., & Kang, K. (2012) · Advanced Energy Materials · doi:10.1002/aenm.201200026 · Cited by 3,393
Room-temperature stationary sodium-ion batteries for large-scale electric energy storage
Pan, H., Hu, Y., & Chen, L. (2013) · Energy & Environmental Science · doi:10.1039/c3ee40847g · Cited by 3,326
Lithium–Sulfur Batteries: Electrochemistry, Materials, and Prospects
Yin, Y., Xin, S., Guo, Y., & Wan, L. (2013) · Angewandte Chemie International Edition · doi:10.1002/anie.201304762 · Cited by 2,720
Lithium−Air Battery: Promise and Challenges
Girishkumar, G., McCloskey, B. D., Luntz, A. C., Swanson, S. A., & Wilcke, W. W. (2010) · The Journal of Physical Chemistry Letters · doi:10.1021/jz1005384 · Cited by 2,528
Cabana, J., Monconduit, L., Larcher, D., & Palacín, M. R. (2010) · Advanced Materials · doi:10.1002/adma.201000717 · Cited by 2,372
A new class of Solvent-in-Salt electrolyte for high-energy rechargeable metallic lithium batteries
Suo, L., Hu, Y., Li, H., Armand, M. B., & Chen, L. (2013) · Nature Communications · doi:10.1038/ncomms2513 · Cited by 2,333
Wang, H., Yang, Y., Liang, Y., Robinson, J. T., Li, Y., Jackson, A., Cui, Y., & Dai, H. (2011) · Nano Letters · doi:10.1021/nl200658a · Cited by 2,136
Seh, Z. W., Li, W., Cha, J. J., Zheng, G. W., Yang, Y., McDowell, M. T., Hsu, P., & Cui, Y. (2013) · Nature Communications · doi:10.1038/ncomms2327 · Cited by 2,124
Dendrite-Free Lithium Deposition via Self-Healing Electrostatic Shield Mechanism
Ding, F., Xu, W., Graff, G. L., Zhang, J., Sushko, M. L., Chen, X., Shao, Y., Engelhard, M., Nie, Z., Xiao, J., et al. (2013) · Journal of the American Chemical Society · doi:10.1021/ja312241y · Cited by 2,116
Polysulfide Shuttle Study in the Li/S Battery System
Mikhaylik, Y., & Akridge, J. R. (2004) · Journal of The Electrochemical Society · doi:10.1149/1.1806394 · Cited by 2,112
A Polymer Electrolyte‐Based Rechargeable Lithium/Oxygen Battery
Abraham, K. M., & Jiang, Z. (1996) · Journal of The Electrochemical Society · doi:10.1149/1.1836378 · Cited by 2,106
High-performance lithium-ion anodes using a hierarchical bottom-up approach
Magasinski, A., Dixon, P., Hertzberg, B. J., Kvit, A. V., Ayala, J., & Yushin, G. N. (2010) · Nature Materials · doi:10.1038/nmat2725 · Cited by 2,052
Ji, X., & Nazar, L. F. (2010) · Journal of Materials Chemistry · doi:10.1039/b925751a · Cited by 1,965
Porous Hollow Carbon@Sulfur Composites for High‐Power Lithium–Sulfur Batteries
Jayaprakash, N., Shen, J., Moganty, S. S., Corona, A., & Archer, L. A. (2011) · Angewandte Chemie International Edition · doi:10.1002/anie.201100637 · Cited by 1,812
Aurbach, D. (2000) · Journal of Power Sources · doi:10.1016/s0378-7753(00)00431-6 · Cited by 1,740
Smaller Sulfur Molecules Promise Better Lithium–Sulfur Batteries
Xin, S., Gu, L., Zhao, N., Yin, Y., Zhou, L.-J., Guo, Y., & Wan, L. (2012) · Journal of the American Chemical Society · doi:10.1021/ja308170k · Cited by 1,650
Liquid electrolyte lithium/sulfur battery: Fundamental chemistry, problems, and solutions
Zhang, S. S. (2013) · Journal of Power Sources · doi:10.1016/j.jpowsour.2012.12.102 · Cited by 1,616
Armstrong, A. R., Holzapfel, M., Novák, P., Johnson, C. S., Kang, S., Thackeray, M. M., & Bruce, P. G. (2006) · Journal of the American Chemical Society · doi:10.1021/ja062027+ · Cited by 1,604
Lithium–sulphur batteries with a microporous carbon paper as a bifunctional interlayer
Su, Y., & Manthiram, A. (2012) · Nature Communications · doi:10.1038/ncomms2163 · Cited by 1,467
Sodium and sodium-ion energy storage batteries
Ellis, B. L., & Nazar, L. F. (2012) · Current Opinion in Solid State and Materials Science · doi:10.1016/j.cossms.2012.04.002 · Cited by 1,460
Lehrbuch der Anorganischen Chemie
Holleman, A. F., Wiberg, E., & Fischer, G. (2007) · De Gruyter eBooks · doi:10.1515/9783110177701 · Cited by 1,453
On the Surface Chemical Aspects of Very High Energy Density, Rechargeable Li–Sulfur Batteries
Aurbach, D., Pollak, E., Elazari, R., Salitra, G., Kelley, C. S., & Affinito, J. (2009) · Journal of The Electrochemical Society · doi:10.1149/1.3148721 · Cited by 1,444
Seino, Y., Ota, T., Takada, K., Hayashi, A., & Tatsumisago, M. (2013) · Energy & Environmental Science · doi:10.1039/c3ee41655k · Cited by 1,311
Zheng, G. W., Yang, Y., Cha, J. J., Hong, S. S., & Cui, Y. (2011) · Nano Letters · doi:10.1021/nl2027684 · Cited by 1,306
Zhang, B., Qin, X., Li, G., et al. (2010) · Energy & Environmental Science · doi:10.1039/c002639e · Cited by 1,286
Sulfur-Impregnated Disordered Carbon Nanotubes Cathode for Lithium–Sulfur Batteries
Guo, J., Xu, Y., & Wang, C. (2011) · Nano Letters · doi:10.1021/nl202297p · Cited by 1,283
Reactions in the Rechargeable Lithium–O2 Battery with Alkyl Carbonate Electrolytes
Freunberger, S. A., Chen, Y., Peng, Z., Griffin, J. M., Hardwick, L. J., Bardé, F., Novák, P., & Bruce, P. G. (2011) · Journal of the American Chemical Society · doi:10.1021/ja2021747 · Cited by 1,273
The Carbon Electrode in Nonaqueous Li–O2 Cells
Thotiyl, M. M. O., Freunberger, S. A., Peng, Z., & Bruce, P. G. (2012) · Journal of the American Chemical Society · doi:10.1021/ja310258x · Cited by 1,249
Lu, Y., Xu, Z. J., Gasteiger, H. A., Chen, S., Hamad‐Schifferli, K., & Shao‐Horn, Y. (2010) · Journal of the American Chemical Society · doi:10.1021/ja1036572 · Cited by 1,246
The Lithium–Oxygen Battery with Ether‐Based Electrolytes
Freunberger, S. A., Chen, Y., Drewett, N. E., Hardwick, L. J., Bardé, F., & Bruce, P. G. (2011) · Angewandte Chemie International Edition · doi:10.1002/anie.201102357 · Cited by 1,100
Twin Problems of Interfacial Carbonate Formation in Nonaqueous Li–O2 Batteries
McCloskey, B. D., Speidel, A., Scheffler, R., Miller, D. C., Viswanathan, V., Hummelshøj, J. S., Nørskov, J. K., & Luntz, A. C. (2012) · The Journal of Physical Chemistry Letters · doi:10.1021/jz300243r · Cited by 1,075
Lithium Ionic Conductor Thio-LISICON: The Li[sub 2]S-GeS[sub 2]-P[sub 2]S[sub 5] System
Kanno, R., & Murayama, M. (2001) · Journal of The Electrochemical Society · doi:10.1149/1.1379028 · Cited by 1,069
A Critical Review of Li/Air Batteries
Christensen, J., Albertus, P. S., Sánchez‐Carrera, R. S., Lohmann, T., Kozinsky, B., Liedtke, R., Ahmed, J., & Kojić, A. (2011) · Journal of The Electrochemical Society · doi:10.1149/2.086202jes · Cited by 1,061
Metallic anodes for next generation secondary batteries
Kim, H., Jeong, G., Kim, Y.-U., Kim, J., Park, C., & Sohn, H. (2013) · Chemical Society Reviews · doi:10.1039/c3cs60177c · Cited by 1,026
Solvents’ Critical Role in Nonaqueous Lithium–Oxygen Battery Electrochemistry
McCloskey, B. D., Bethune, D. S., Shelby, R. M., Girishkumar, G., & Luntz, A. C. (2011) · The Journal of Physical Chemistry Letters · doi:10.1021/jz200352v · Cited by 1,012
Meyer, B. (1976) · Chemical Reviews · doi:10.1021/cr60301a003 · Cited by 1,002
A Graphene–Pure‐Sulfur Sandwich Structure for Ultrafast, Long‐Life Lithium–Sulfur Batteries
Zhou, G., Pei, S., Li, L., Wang, D., Wang, S., Huang, K., Yin, L., Li, F., & Cheng, H. (2013) · Advanced Materials · doi:10.1002/adma.201302877 · Cited by 1,001
Song, J., Xu, T., Gordin, M. L., Zhu, P., Lv, D., Jiang, Y., Chen, Y., Duan, Y., & Wang, D. (2013) · Advanced Functional Materials · doi:10.1002/adfm.201302631 · Cited by 984
Barchasz, C., Molton, F., Duboc, C., Leprêtre, J., Patoux, S., & Alloin, F. (2012) · Analytical Chemistry · doi:10.1021/ac2032244 · Cited by 958
Role of LiNO3 in rechargeable lithium/sulfur battery
Zhang, S. S. (2012) · Electrochimica Acta · doi:10.1016/j.electacta.2012.03.081 · Cited by 955
Charging a Li–O2 battery using a redox mediator
Chen, Y., Freunberger, S. A., Peng, Z., Fontaine, O., & Bruce, P. G. (2013) · Nature Chemistry · doi:10.1038/nchem.1646 · Cited by 940
Lithium–oxygen batteries: bridging mechanistic understanding and battery performance
Lu, Y., Gallant, B. M., Kwabi, D. G., Harding, J. R., Mitchell, R., Whittingham, M. S., & Shao‐Horn, Y. (2013) · Energy & Environmental Science · doi:10.1039/c3ee23966g · Cited by 932
(2010) · Cited by 909
α‐MnO2 Nanowires: A Catalyst for the O2 Electrode in Rechargeable Lithium Batteries
Débart, A., Paterson, A. J., Bao, J., & Bruce, P. G. (2008) · Angewandte Chemie International Edition · doi:10.1002/anie.200705648 · Cited by 909
Elazari, R., Salitra, G., Garsuch, A., Panchenko, A. A., & Aurbach, D. (2011) · Advanced Materials · doi:10.1002/adma.201103274 · Cited by 896
Hierarchically Structured Sulfur/Carbon Nanocomposite Material for High-Energy Lithium Battery
Liang, C., Dudney, N. J., & Howe, J. Y. (2009) · Chemistry of Materials · doi:10.1021/cm902050j · Cited by 866
A rechargeable room-temperature sodium superoxide (NaO2) battery
Hartmann, P., Bender, C. L., Vračar, M., Dürr, A. K., Garsuch, A., Janek, J., & Adelhelm, P. (2012) · Nature Materials · doi:10.1038/nmat3486 · Cited by 792
Self-citationHigh temperature sodium batteries: status, challenges and future trends
Hueso, K. B., Armand, M. B., & Rojo, T. (2013) · Energy & Environmental Science · doi:10.1039/c3ee24086j · Cited by 784
A stable cathode for the aprotic Li–O2 battery
Thotiyl, M. M. O., Freunberger, S. A., Peng, Z., Chen, Y., Liu, Z., & Bruce, P. G. (2013) · Nature Materials · doi:10.1038/nmat3737 · Cited by 762
Yang, Y., Zheng, G. W., Misra, S., Weker, J. N., Toney, M. F., & Cui, Y. (2012) · Journal of the American Chemical Society · doi:10.1021/ja3052206 · Cited by 724
Screening for Superoxide Reactivity in Li-O2 Batteries: Effect on Li2O2/LiOH Crystallization
Black, R. W., Oh, S. H., Lee, J., et al. (2012) · Journal of the American Chemical Society · doi:10.1021/ja2111543 · Cited by 696
Ionic shield for polysulfides towards highly-stable lithium–sulfur batteries
Huang, J., Zhang, Q., Peng, H., Liu, X., Qian, W., & Wei, F. (2013) · Energy & Environmental Science · doi:10.1039/c3ee42223b · Cited by 685
Current density dependence of peroxide formation in the Li–O2 battery and its effect on charge
Adams, B. D., Radtke, C., Black, R. W., Trudeau, M. L., Zaghib, K., & Nazar, L. F. (2013) · Energy & Environmental Science · doi:10.1039/c3ee40697k · Cited by 677
New Nanostructured Li2S/Silicon Rechargeable Battery with High Specific Energy
Yang, Y., McDowell, M. T., Jackson, A., Cha, J. J., Hong, S. S., & Cui, Y. (2010) · Nano Letters · doi:10.1021/nl100504q · Cited by 660
On the Efficacy of Electrocatalysis in Nonaqueous Li–O 2 Batteries
McCloskey, B. D., Scheffler, R., Speidel, A., Bethune, D. S., Shelby, R. M., & Luntz, A. C. (2011) · Journal of the American Chemical Society · doi:10.1021/ja207229n · Cited by 659
A High‐Energy Room‐Temperature Sodium‐Sulfur Battery
Xin, S., Yin, Y., Guo, Y., & Wan, L. (2013) · Advanced Materials · doi:10.1002/adma.201304126 · Cited by 633
Negative electrodes for Na-ion batteries
Dahbi, M., Yabuuchi, N., Kubota, K., Tokiwa, K., & Komaba, S. (2014) · Physical Chemistry Chemical Physics · doi:10.1039/c4cp00826j · Cited by 623
Gao, J., Lowe, M. A., Kiya, Y., & Abruña, H. D. (2011) · The Journal of Physical Chemistry C · doi:10.1021/jp207714c · Cited by 599
A Lithium/Dissolved Sulfur Battery with an Organic Electrolyte
Rauh, R. D., Abraham, K. M., Pearson, G. F., Surprenant, J., & Brummer, S. B. (1979) · Journal of The Electrochemical Society · doi:10.1149/1.2129079 · Cited by 599
An O2 cathode for rechargeable lithium batteries: The effect of a catalyst
Débart, A., Bao, J., Armstrong, G., & Bruce, P. G. (2007) · Journal of Power Sources · doi:10.1016/j.jpowsour.2007.06.180 · Cited by 585
Viswanathan, V., Thygesen, K. S., Hummelshøj, J. S., Nørskov, J. K., Girishkumar, G., McCloskey, B. D., & Luntz, A. C. (2011) · The Journal of Chemical Physics · doi:10.1063/1.3663385 · Cited by 581
Prelithiated Silicon Nanowires as an Anode for Lithium Ion Batteries
Liu, N., Hu, L., McDowell, M. T., Jackson, A., & Cui, Y. (2011) · ACS Nano · doi:10.1021/nn2017167 · Cited by 580
Sulfur Speciation in Li–S Batteries Determined by Operando X-ray Absorption Spectroscopy
Cuisinier, M., Cabelguen, P., Evers, S., He, G., Kolbeck, M., Garsuch, A., Bolin, T. B., Balasubramanian, M., & Nazar, L. F. (2013) · The Journal of Physical Chemistry Letters · doi:10.1021/jz401763d · Cited by 557
TEMPO: A Mobile Catalyst for Rechargeable Li-O 2 Batteries
Bergner, B. J., Schürmann, A., Peppler, K., Garsuch, A., & Janek, J. (2014) · Journal of the American Chemical Society · doi:10.1021/ja508400m · Cited by 554
Self-citationRechargeable Lithium Sulfur Battery
Cheon, S.-E., Ko, K.-S., Cho, J., Kim, S., Chin, E., & Kim, H. (2003) · Journal of The Electrochemical Society · doi:10.1149/1.1571532 · Cited by 552
In Operando X-ray Diffraction and Transmission X-ray Microscopy of Lithium Sulfur Batteries
Weker, J. N., Misra, S., Yang, Y., Jackson, A., Liu, Y., Wang, H., Dai, H., Andrews, J. C., Cui, Y., & Toney, M. F. (2012) · Journal of the American Chemical Society · doi:10.1021/ja2121926 · Cited by 547
Characterization of the Lithium/Oxygen Organic Electrolyte Battery
Read, J. A. (2002) · Journal of The Electrochemical Society · doi:10.1149/1.1498256 · Cited by 534
Hartmann, P., Leichtweiß, T., Busche, M. R., Schneider, M., Reich, M., Sann, J., Adelhelm, P., & Janek, J. (2013) · The Journal of Physical Chemistry C · doi:10.1021/jp4051275 · Cited by 526
Self-citationZhou, G., Wang, D., Li, F., Hou, P., Yin, L., Liu, C., Lu, G. Q., Gentle, I., & Cheng, H. (2012) · Energy & Environmental Science · doi:10.1039/c2ee22294a · Cited by 519
Porous Hollow Carbon@Sulfur Composites for High‐Power Lithium–Sulfur Batteries
Jayaprakash, N., Shen, J., Moganty, S. S., Corona, A., & Archer, L. A. (2011) · Angewandte Chemie · doi:10.1002/ange.201100637 · Cited by 487
The Lithium/Sulfur Rechargeable Cell
Shim, J., Striebel, K. A., & Cairns, E. J. (2002) · Journal of The Electrochemical Society · doi:10.1149/1.1503076 · Cited by 482
High “C” rate Li-S cathodes: sulfur imbibed bimodal porous carbons
He, G., Ji, X., & Nazar, L. F. (2011) · Energy & Environmental Science · doi:10.1039/c1ee01219c · Cited by 475
Quantifying the promise of lithium–air batteries for electric vehicles
Gallagher, K. G., Goebel, S. G., Greszler, T. A., Mathias, M. F., Oelerich, W., Eroğlu, D., & Srinivasan, V. (2014) · Energy & Environmental Science · doi:10.1039/c3ee43870h · Cited by 473
Phosphorous Pentasulfide as a Novel Additive for High‐Performance Lithium‐Sulfur Batteries
Lin, Z., Liu, Z., Fu, W., Dudney, N. J., & Liang, C. (2012) · Advanced Functional Materials · doi:10.1002/adfm.201200696 · Cited by 457
Electrochemical performance of lithium/sulfur cells with three different polymer electrolytes
Marmorstein, D., Yu, T. H., Striebel, K. A., McLARNON, F. R., Hou, J., & Cairns, E. J. (2000) · Journal of Power Sources · doi:10.1016/s0378-7753(00)00432-8 · Cited by 454
Optimization of mesoporous carbon structures for lithium–sulfur battery applications
Li, X., Cao, Y., Qi, W., Saraf, L. V., Xiao, J., Nie, Z., Jaroniec, M., Zhang, J., Schwenzer, B., & Liu, J. (2011) · Journal of Materials Chemistry · doi:10.1039/c1jm12979a · Cited by 453
Hwang, T. H., Jung, D. S., Kim, J., et al. (2013) · Nano Letters · doi:10.1021/nl402513x · Cited by 444
Recent advances in lithium–sulfur batteries
Chen, L., & Shaw, L. L. (2014) · Journal of Power Sources · doi:10.1016/j.jpowsour.2014.05.111 · Cited by 438
A High‐Performance Polymer Tin Sulfur Lithium Ion Battery
Hassoun, J., & Scrosati, B. (2010) · Angewandte Chemie International Edition · doi:10.1002/anie.200907324 · Cited by 438
A nanostructured cathode architecture for low charge overpotential in lithium-oxygen batteries
Lu, J. B., Lei, Y., Lau, K. C., Luo, X., Du, P., Wen, J., Assary, R. S., Das, U., Miller, D. J., Elam, J. W., et al. (2013) · Nature Communications · doi:10.1038/ncomms3383 · Cited by 426
Limitations in Rechargeability of Li-O2 Batteries and Possible Origins
McCloskey, B. D., Bethune, D. S., Shelby, R. M., Mori, T., Scheffler, R., Speidel, A., Sherwood, M., & Luntz, A. C. (2012) · The Journal of Physical Chemistry Letters · doi:10.1021/jz301359t · Cited by 424
Hassoun, J., & Scrosati, B. (2010) · Advanced Materials · doi:10.1002/adma.201002584 · Cited by 422
Synthesis of a new lithium ionic conductor, thio-LISICON–lithium germanium sulfide system
Kanno, R., Hata, T., Kawamoto, Y., et al. (2000) · Solid State Ionics · doi:10.1016/s0167-2738(00)00277-0 · Cited by 417
Xiong, S., Xie, K., Diao, Y., & Hong, X. (2013) · Journal of Power Sources · doi:10.1016/j.jpowsour.2013.08.041 · Cited by 415
Rechargeable Li-Air Batteries with Carbonate-Based Liquid Electrolytes
Mizuno, F., Nakanishi, S., Kotani, Y., Yokoishi, S., & Iba, H. (2010) · Electrochemistry · doi:10.5796/electrochemistry.78.403 · Cited by 405
A membrane-free lithium/polysulfide semi-liquid battery for large-scale energy storage
Yang, Y., Zheng, G. W., & Cui, Y. (2013) · Energy & Environmental Science · doi:10.1039/c3ee00072a · Cited by 395
Unique behaviour of nonsolvents for polysulphides in lithium–sulphur batteries
Cuisinier, M., Cabelguen, P., Adams, B. D., et al. (2014) · Energy & Environmental Science · doi:10.1039/c4ee00372a · Cited by 394
Li–O2 Battery with a Dimethylformamide Electrolyte
Chen, Y., Freunberger, S. A., Peng, Z., Bardé, F., & Bruce, P. G. (2012) · Journal of the American Chemical Society · doi:10.1021/ja302178w · Cited by 387
A Mathematical Model for a Lithium–Sulfur Cell
Kumaresan, K., Mikhaylik, Y., & White, R. E. (2008) · Journal of The Electrochemical Society · doi:10.1149/1.2937304 · Cited by 385
Lithium Superionic Sulfide Cathode for All-Solid Lithium–Sulfur Batteries
Lin, Z., Liu, Z., Dudney, N. J., & Liang, C. (2013) · ACS Nano · doi:10.1021/nn400391h · Cited by 383
New insight into the discharge process of sulfur cathode by electrochemical impedance spectroscopy
Yuan, L., Qiu, X., Chen, L., et al. (2008) · Journal of Power Sources · doi:10.1016/j.jpowsour.2008.10.033 · Cited by 380
Lithium Peroxide Surfaces Are Metallic, While Lithium Oxide Surfaces Are Not
Radin, M. D., Rodriguez, J. F., Tian, F., & Siegel, D. J. (2011) · Journal of the American Chemical Society · doi:10.1021/ja208944x · Cited by 373
Conversion reactions for sodium-ion batteries
Klein, F., Jache, B., Bhide, A., & Adelhelm, P. (2013) · Physical Chemistry Chemical Physics · doi:10.1039/c3cp52125g · Cited by 370
Self-citationMcCloskey, B. D., Valéry, A., Luntz, A. C., Gowda, S. R., Wallraff, G. M., Garcı́a, J. M., Mori, T., & Krupp, L. E. (2013) · The Journal of Physical Chemistry Letters · doi:10.1021/jz401659f · Cited by 365
The electrochemistry of noble metal electrodes in aprotic organic solvents containing lithium salts
Aurbach, D., Daroux, M. L., Faguy, P. W., & Yeager, E. B. (1991) · Journal of Electroanalytical Chemistry · doi:10.1016/0022-0728(91)85370-5 · Cited by 360
Sandwich-type functionalized graphene sheet-sulfur nanocomposite for rechargeable lithium batteries
Cao, Y., Li, X., Aksay, İ. A., Lemmon, J. P., Nie, Z., Yang, Z. G., & Liu, J. (2011) · Physical Chemistry Chemical Physics · doi:10.1039/c0cp02477e · Cited by 360
Bryantsev, V. S., Giordani, V., Walker, W. T., Blanco, M., Zecevic, S. K., Sasaki, K., Uddin, J., Addison, D., & Chase, G. V. (2011) · The Journal of Physical Chemistry A · doi:10.1021/jp2073914 · Cited by 359
A Rechargeable Li–O2 Battery Using a Lithium Nitrate/N,N-Dimethylacetamide Electrolyte
Walker, W. T., Giordani, V., Uddin, J., Bryantsev, V. S., Chase, G. V., & Addison, D. (2013) · Journal of the American Chemical Society · doi:10.1021/ja311518s · Cited by 356
Development of Sodium‐Sulfur Batteries
Oshima, T., Kajita, M., & Okuno, A. (2004) · International Journal of Applied Ceramic Technology · doi:10.1111/j.1744-7402.2004.tb00179.x · Cited by 355
A Low-Overpotential Potassium–Oxygen Battery Based on Potassium Superoxide
Ren, X., & Wu, Y. (2013) · Journal of the American Chemical Society · doi:10.1021/ja312059q · Cited by 351
Lithium–Sulfur Battery Cathode Enabled by Lithium–Nitrile Interaction
Guo, J., Yang, Z., Yu, Y., Abruña, H. D., & Archer, L. A. (2012) · Journal of the American Chemical Society · doi:10.1021/ja309435f · Cited by 344
Yim, T., Park, M., Yu, J., Kim, K. J., Im, K. Y., Kim, J., Jeong, G., Jo, Y. N., Woo, S., Kang, K. S., et al. (2013) · Electrochimica Acta · doi:10.1016/j.electacta.2013.06.039 · Cited by 330
Charge transport in lithium peroxide: relevance for rechargeable metal–air batteries
Radin, M. D., & Siegel, D. J. (2013) · Energy & Environmental Science · doi:10.1039/c3ee41632a · Cited by 327
All-solid-state Li/S batteries with highly conductive glass–ceramic electrolytes
Hayashi, A., Ohtomo, T., Mizuno, F., Tadanaga, K., & Tatsumisago, M. (2003) · Electrochemistry Communications · doi:10.1016/s1388-2481(03)00167-x · Cited by 317
Sulfur–carbon nano-composite as cathode for rechargeable lithium battery based on gel electrolyte
Wang, J. L., Yang, J., Xie, J., Xu, N., & Li, Y. (2002) · Electrochemistry Communications · doi:10.1016/s1388-2481(02)00358-2 · Cited by 315
Novel DMSO-based electrolyte for high performance rechargeable Li–O2 batteries
Xu, D., Wang, Z., Xu, J., Zhang, L., & Zhang, X. (2012) · Chemical Communications · doi:10.1039/c2cc32844e · Cited by 311
Green Phosphorescent Dendrimer for Light-Emitting Diodes
Lo, S., Male, N. A. H., Markham, J. P. J., Magennis, S. W., Burn, P. L., Salata, O. V., & Samuel, I. D. W. (2002) · Advanced Materials · doi:10.1002/1521-4095(20020705)14:13/14 · Cited by 310
Nanostructured Li2S–C Composites as Cathode Material for High-Energy Lithium/Sulfur Batteries
Cai, K., Song, M., Cairns, E. J., & Zhang, Y. (2012) · Nano Letters · doi:10.1021/nl303965a · Cited by 309
A Review on Li-S Batteries as a High Efficiency Rechargeable Lithium Battery
Barghamadi, M., Kapoor, A., & Wen, C. (2013) · Journal of The Electrochemical Society · doi:10.1149/2.096308jes · Cited by 307
Dörfler, S., Hagen, M., Althues, H., Tübke, J., Kaskel, S., & Hoffmann, M. J. (2012) · Chemical Communications · doi:10.1039/c2cc17925c · Cited by 303
Lithium‐Sulfur Battery: Evaluation of Dioxolane‐Based Electrolytes
Peled, E., Sternberg, Y., Gorenshtein, A., & Lavi, Y. B. (1989) · Journal of The Electrochemical Society · doi:10.1149/1.2096981 · Cited by 293
Lin, Z., Liu, Z., Fu, W., Dudney, N. J., & Liang, C. (2013) · Angewandte Chemie International Edition · doi:10.1002/anie.201300680 · Cited by 290
Li‐S Battery Analyzed by UV/Vis in Operando Mode
Patel, M. U. M., Demir‐Cakan, R., Morcrette, M., et al. (2013) · ChemSusChem · doi:10.1002/cssc.201300142 · Cited by 288
Reduced graphene oxide film as a shuttle-inhibiting interlayer in a lithium–sulfur battery
Wang, X., Wang, Z., & Chen, L. (2013) · Journal of Power Sources · doi:10.1016/j.jpowsour.2013.05.063 · Cited by 279
A comprehensive study on the cell chemistry of the sodium superoxide (NaO2) battery
Hartmann, P., Bender, C. L., Sann, J., Dürr, A. K., Jansen, M., Janek, J., & Adelhelm, P. (2013) · Physical Chemistry Chemical Physics · doi:10.1039/c3cp50930c · Cited by 277
Self-citationLayered oxides as positive electrode materials for Na-ion batteries
Kubota, K., Yabuuchi, N., Yoshida, H., Dahbi, M., & Komaba, S. (2014) · MRS Bulletin · doi:10.1557/mrs.2014.85 · Cited by 277
Studies of Li-Air Cells Utilizing Dimethyl Sulfoxide-Based Electrolyte
Trahan, M., Mukerjee, S., Plichta, E. J., Hendrickson, M. A., & Abraham, K. M. (2012) · Journal of The Electrochemical Society · doi:10.1149/2.048302jes · Cited by 272
Oxidation of Dimethyl Sulfoxide Solutions by Electrochemical Reduction of Oxygen
Sharon, D., Afri, M., Noked, M., et al. (2013) · The Journal of Physical Chemistry Letters · doi:10.1021/jz4017188 · Cited by 263
Lin, Z., Liu, Z., Fu, W., Dudney, N. J., & Liang, C. (2013) · Angewandte Chemie · doi:10.1002/ange.201300680 · Cited by 263
Liang, X. M., Wen, Z., Liu, Y., Zhang, H., Huang, L., & Jin, J. H. (2010) · Journal of Power Sources · doi:10.1016/j.jpowsour.2010.12.052 · Cited by 257
Busche, M. R., Adelhelm, P., Sommer, H., Schneider, H., Leitner, K., & Janek, J. (2014) · Journal of Power Sources · doi:10.1016/j.jpowsour.2014.02.075 · Cited by 257
Self-citationLi/S fundamental chemistry and application to high-performance rechargeable batteries
Akridge, J. R. (2004) · Solid State Ionics · doi:10.1016/j.ssi.2004.07.070 · Cited by 252
Application of lithiated Nafion ionomer film as functional separator for lithium sulfur cells
Jin, Z., Xie, K., Hong, X., et al. (2012) · Journal of Power Sources · doi:10.1016/j.jpowsour.2012.06.100 · Cited by 252
Improved lithium–sulfur cells with a treated carbon paper interlayer
Zu, C., Su, Y., Fu, Y., & Manthiram, A. (2012) · Physical Chemistry Chemical Physics · doi:10.1039/c2cp43394j · Cited by 246
Xu, W., Viswanathan, V., Wang, D., Towne, S. A., Xiao, J., Nie, Z., Hu, D., & Zhang, J. (2010) · Journal of Power Sources · doi:10.1016/j.jpowsour.2010.12.065 · Cited by 241
In-situ X-ray diffraction studies of lithium–sulfur batteries
Cañas, N. A., Wolf, S., Wagner, N., et al. (2012) · Journal of Power Sources · doi:10.1016/j.jpowsour.2012.10.092 · Cited by 241
All solid-state battery with sulfur electrode and thio-LISICON electrolyte
Kobayashi, T., Imade, Y., Shishihara, D., et al. (2008) · Journal of Power Sources · doi:10.1016/j.jpowsour.2008.03.030 · Cited by 237
In Situ Formed Lithium Sulfide/Microporous Carbon Cathodes for Lithium-Ion Batteries
Zheng, S., Chen, Y., Xu, Y., Yi, F., Zhu, Y., Liu, Y., Yang, J., & Wang, C. (2013) · ACS Nano · doi:10.1021/nn404601h · Cited by 232
Waluś, S., Barchasz, C., Colin, J.-F., Martin, J., Elkaı̈m, E., Leprêtre, J., & Alloin, F. (2013) · Chemical Communications · doi:10.1039/c3cc43766c · Cited by 229
Towards a Stable Organic Electrolyte for the Lithium Oxygen Battery
Adams, B. D., Black, R. W., Williams, Z., et al. (2014) · Advanced Energy Materials · doi:10.1002/aenm.201400867 · Cited by 229
Enhanced Cyclability for Sulfur Cathode Achieved by a Water-Soluble Binder
He, M., Yuan, L., Zhang, W., et al. (2011) · The Journal of Physical Chemistry C · doi:10.1021/jp2043416 · Cited by 229
Tachikawa, N., Yamauchi, K., Takashima, E., et al. (2011) · Chemical Communications · doi:10.1039/c1cc12415c · Cited by 223
Electrochemical performance of lithium/sulfur batteries with protected Li anodes
Lee, Y. M., Choi, N., Park, J. H., et al. (2003) · Journal of Power Sources · doi:10.1016/s0378-7753(03)00300-8 · Cited by 223
V2O5 Polysulfide Anion Barrier for Long-Lived Li–S Batteries
Li, W., Hicks-Garner, J., Wang, J., et al. (2014) · Chemistry of Materials · doi:10.1021/cm500575q · Cited by 217
Park, J., Yamauchi, K., Takashima, E., Tachikawa, N., Ueno, K., Dokko, K., & Watanabe, M. (2013) · The Journal of Physical Chemistry C · doi:10.1021/jp400153m · Cited by 216
High Energy Rechargeable Li-S Cells for EV Application: Status, Remaining Problems and Solutions
Mikhaylik, Y., Kovalev, I. P., Schock, R., Kumaresan, K., Xu, J., & Affinito, J. (2010) · ECS Transactions · doi:10.1149/1.3414001 · Cited by 215
Room-Temperature Solid-State Sodium∕Sulfur Battery
Park, C.-W., Ahn, J., Ryu, H.-S., et al. (2006) · Electrochemical and Solid-State Letters · doi:10.1149/1.2164607 · Cited by 214
Electron and Ion Transport In Li 2 O 2
Gerbig, O., Merkle, R., & Maier, J. (2013) · Advanced Materials · doi:10.1002/adma.201300264 · Cited by 212
Meini, S., Tsiouvaras, N., Schwenke, K. U., et al. (2013) · Physical Chemistry Chemical Physics · doi:10.1039/c3cp51112j · Cited by 211
Xu, W., Xu, K., Viswanathan, V., Towne, S. A., Hardy, J. S., Xiao, J., Nie, Z., Hu, D., Wang, D., & Zhang, J. (2011) · Journal of Power Sources · doi:10.1016/j.jpowsour.2011.06.099 · Cited by 210
Room temperature Na/S batteries with sulfur composite cathode materials
Wang, J., Yang, J., NuLi, Y., et al. (2006) · Electrochemistry Communications · doi:10.1016/j.elecom.2006.08.029 · Cited by 209
Chang, D.-R., Lee, S., Kim, S., et al. (2002) · Journal of Power Sources · doi:10.1016/s0378-7753(02)00418-4 · Cited by 205
Bender, C. L., Hartmann, P., Vračar, M., et al. (2014) · Advanced Energy Materials · doi:10.1002/aenm.201301863 · Cited by 205
Self-citationYe, H., Yin, Y., Xin, S., & Guo, Y. (2013) · Journal of Materials Chemistry A · doi:10.1039/c3ta10735c · Cited by 201
Chemical and Electrochemical Differences in Nonaqueous Li–O2 and Na–O2 Batteries
McCloskey, B. D., Garcı́a, J. M., & Luntz, A. C. (2014) · The Journal of Physical Chemistry Letters · doi:10.1021/jz500494s · Cited by 200
Lu, X., Li, G., Kim, J. Y., et al. (2014) · Nature Communications · doi:10.1038/ncomms5578 · Cited by 198
Ryu, H.-S., Kim, T.-B., Kim, K.-W., et al. (2011) · Journal of Power Sources · doi:10.1016/j.jpowsour.2011.01.109 · Cited by 192
Application of gelatin as a binder for the sulfur cathode in lithium–sulfur batteries
Sun, J., Huang, Y., Wang, W., et al. (2008) · Electrochimica Acta · doi:10.1016/j.electacta.2008.05.022 · Cited by 189
Research on sodium sulfur battery for energy storage
Wen, Z., Cao, J., Gu, Z., Xu, X., Zhang, F., & Lin, Z. (2008) · Solid State Ionics · doi:10.1016/j.ssi.2008.01.070 · Cited by 189
Advanced intermediate-temperature Na–S battery
Lu, X., Kirby, B., Xu, W., et al. (2012) · Energy & Environmental Science · doi:10.1039/c2ee23606k · Cited by 186
Self-weaving sulfur–carbon composite cathodes for high rate lithium–sulfur batteries
Su, Y., Fu, Y., & Manthiram, A. (2012) · Physical Chemistry Chemical Physics · doi:10.1039/c2cp42796f · Cited by 185
Carbon‐Based Anodes for Lithium Sulfur Full Cells with High Cycle Stability
Brückner, J., Thieme, S., Böttger‐Hiller, F., Bauer, I., Grossmann, H. T., Strubel, P., Althues, H., Spange, S., & Kaskel, S. (2013) · Advanced Functional Materials · doi:10.1002/adfm.201302169 · Cited by 185
Li–O 2 Kinetic Overpotentials: Tafel Plots from Experiment and First-Principles Theory
Viswanathan, V., Nørskov, J. K., Speidel, A., et al. (2013) · The Journal of Physical Chemistry Letters · doi:10.1021/jz400019y · Cited by 185
Sodium–oxygen batteries: a new class of metal–air batteries
Das, S. K., Lau, S., & Archer, L. A. (2014) · Journal of Materials Chemistry A · doi:10.1039/c4ta02176b · Cited by 183
Electrochemical sodium storage of TiO2(B) nanotubes for sodium ion batteries
Huang, J., Yuan, D., Zhang, H. Z., et al. (2013) · RSC Advances · doi:10.1039/c3ra42413h · Cited by 181
Electrochemical properties of room temperature sodium–air batteries with non-aqueous electrolyte
Sun, Q., Yang, Y., & Fu, Z. (2011) · Electrochemistry Communications · doi:10.1016/j.elecom.2011.12.019 · Cited by 180
Wenzel, S., Metelmann, H., Raiß, C., et al. (2013) · Journal of Power Sources · doi:10.1016/j.jpowsour.2013.05.194 · Cited by 177
Cell energy density and electrolyte/sulfur ratio in Li–S cells
Hagen, M., Fanz, P., & Tübke, J. (2014) · Journal of Power Sources · doi:10.1016/j.jpowsour.2014.04.018 · Cited by 176
Tsiouvaras, N., Meini, S., Buchberger, I., et al. (2013) · Journal of The Electrochemical Society · doi:10.1149/2.042303jes · Cited by 176
Zhang, Z., Lu, J. B., Assary, R. S., Du, P., Wang, H., Sun, Y., Qin, Y. F., Lau, K. C., Greeley, J., Redfern, P. C., et al. (2011) · The Journal of Physical Chemistry C · doi:10.1021/jp2087412 · Cited by 173
Nanoscale Stabilization of Sodium Oxides: Implications for Na–O2 Batteries
Kang, S., Mo, Y., Ong, S. P., et al. (2014) · Nano Letters · doi:10.1021/nl404557w · Cited by 173
DFT+U Study of Polaronic Conduction in Li2O2 and Li2CO3: Implications for Li–Air Batteries
García-Lastra, J. M., Mýrdal, J. S. G., Christensen, R., Thygesen, K. S., & Vegge, T. (2013) · The Journal of Physical Chemistry C · doi:10.1021/jp3107809 · Cited by 172
Tunneling and Polaron Charge Transport through Li 2 O 2 in Li–O 2 Batteries
Luntz, A. C., Viswanathan, V., Voss, J., et al. (2013) · The Journal of Physical Chemistry Letters · doi:10.1021/jz401926f · Cited by 170
Parameter analysis of a practical lithium- and sodium-air electric vehicle battery
Peled, E., Golodnitsky, D., Mazor, H., et al. (2010) · Journal of Power Sources · doi:10.1016/j.jpowsour.2010.09.104 · Cited by 169
On rechargeability and reaction kinetics of sodium–air batteries
Yadegari, H., Li, Y., Banis, M. N., et al. (2014) · Energy & Environmental Science · doi:10.1039/c4ee01654h · Cited by 166
New approaches to improve cycle life characteristics of lithium–sulfur cells
Jung, Y. S., & Kim, S. (2006) · Electrochemistry Communications · doi:10.1016/j.elecom.2006.09.013 · Cited by 165
Hassoun, J., Kim, J., Lee, D., et al. (2011) · Journal of Power Sources · doi:10.1016/j.jpowsour.2011.11.060 · Cited by 161
Discharge properties of all-solid sodium–sulfur battery using poly (ethylene oxide) electrolyte
Park, C.-W., Ryu, H.-S., Kim, K.-W., et al. (2007) · Journal of Power Sources · doi:10.1016/j.jpowsour.2006.11.083 · Cited by 160
Liu, W., Sun, Q., Yang, Y., et al. (2013) · Chemical Communications · doi:10.1039/c3cc00085k · Cited by 159
Zhao, N., Li, C., & Guo, X. (2014) · Physical Chemistry Chemical Physics · doi:10.1039/c4cp01961j · Cited by 159
Alternative materials for sodium ion–sulphur batteries
Lee, D., Park, J.-W., Hasa, I., Sun, Y., Scrosati, B., & Hassoun, J. (2013) · Journal of Materials Chemistry A · doi:10.1039/c3ta10241f · Cited by 158
Bauer, I., Kohl, M., Althues, H., et al. (2014) · Chemical Communications · doi:10.1039/c4cc00161c · Cited by 158
Sharon, D., Etacheri, V., Garsuch, A., Afri, M., Frimer, A. A., & Aurbach, D. (2012) · The Journal of Physical Chemistry Letters · doi:10.1021/jz3017842 · Cited by 158
Brückner, J., Thieme, S., Grossmann, H. T., et al. (2014) · Journal of Power Sources · doi:10.1016/j.jpowsour.2014.05.143 · Cited by 156
Jin, L., Xu, L., Morein, C., et al. (2010) · Advanced Functional Materials · doi:10.1002/adfm.201001080 · Cited by 155
Oxygen Electrode Rechargeability in an Ionic Liquid for the Li–Air Battery
Allen, C. J., Mukerjee, S., Plichta, E. J., et al. (2011) · The Journal of Physical Chemistry Letters · doi:10.1021/jz201070t · Cited by 152
Rechargeable lithium sulfide electrode for a polymer tin/sulfur lithium-ion battery
Hassoun, J., Sun, Y., & Scrosati, B. (2010) · Journal of Power Sources · doi:10.1016/j.jpowsour.2010.06.093 · Cited by 148
Advanced in situ methods for the characterization of practical electrodes in lithium-ion batteries
Novák, P., Panitz, J., Joho, F., et al. (2000) · Journal of Power Sources · doi:10.1016/s0378-7753(00)00447-x · Cited by 147
Advanced Electrodes for High Power Li-ion Batteries
Zaghib, K., Mauger, A., Groult, H., Goodenough, J. B., & Julien, C. M. (2013) · Materials · doi:10.3390/ma6031028 · Cited by 147
Discharge process of Li/PVdF/S cells at room temperature
Ryu, H.-S., Ahn, H., Kim, K.-W., et al. (2005) · Journal of Power Sources · doi:10.1016/j.jpowsour.2005.05.037 · Cited by 146
Electrochemical properties of ether-based electrolytes for lithium/sulfur rechargeable batteries
Barchasz, C., Leprêtre, J., Patoux, S., et al. (2012) · Electrochimica Acta · doi:10.1016/j.electacta.2012.11.001 · Cited by 143
Investigation of discharge reaction mechanism of lithium|liquid electrolyte|sulfur battery
Ryu, H.-S., Guo, Z., Ahn, H. J., Cho, G.-B., & Liu, H. (2008) · Journal of Power Sources · doi:10.1016/j.jpowsour.2008.12.073 · Cited by 143
Yang, Z., Guo, J., Das, S. K., et al. (2012) · Journal of Materials Chemistry A · doi:10.1039/c2ta00779g · Cited by 141
Highly Reversible Room-Temperature Sulfur/Long-Chain Sodium Polysulfide Batteries
Yu, X., & Manthiram, A. (2014) · The Journal of Physical Chemistry Letters · doi:10.1021/jz500848x · Cited by 140
Sodium–oxygen batteries with alkyl-carbonate and ether based electrolytes
Kim, J., Lim, H., Gwon, H., et al. (2013) · Physical Chemistry Chemical Physics · doi:10.1039/c3cp43225d · Cited by 137
Polymer lithium cells with sulfur composites as cathode materials
Wang, J., Liu, L., Ling, Z., et al. (2003) · Electrochimica Acta · doi:10.1016/s0013-4686(03)00258-5 · Cited by 136
Carbon dioxide assist for non-aqueous sodium–oxygen batteries
Das, S. K., Xu, S., & Archer, L. A. (2012) · Electrochemistry Communications · doi:10.1016/j.elecom.2012.10.036 · Cited by 136
Zheng, S., Han, P., Han, Z., et al. (2014) · Advanced Energy Materials · doi:10.1002/aenm.201400226 · Cited by 136
Influence of Lithium Salts on the Discharge Chemistry of Li–Air Cells
Veith, G. M., Nanda, J., Delmau, L. H., & Dudney, N. J. (2012) · The Journal of Physical Chemistry Letters · doi:10.1021/jz300430s · Cited by 135
Rao, M., Song, X., & Cairns, E. J. (2012) · Journal of Power Sources · doi:10.1016/j.jpowsour.2012.01.047 · Cited by 134
Understanding Side Reactions in K–O2 Batteries for Improved Cycle Life
Ren, X., Lau, K. C., Yu, M., et al. (2014) · ACS Applied Materials & Interfaces · doi:10.1021/am505351s · Cited by 130
High capacity Na–O2 batteries with carbon nanotube paper as binder-free air cathode
Jian, Z., Chen, Y., Li, F., et al. (2013) · Journal of Power Sources · doi:10.1016/j.jpowsour.2013.11.091 · Cited by 125
Cheon, S.-E., Cho, J., Ko, K.-S., et al. (2002) · Journal of The Electrochemical Society · doi:10.1149/1.1511187 · Cited by 123
Research works printed but not linked: 4
- Aetukuri, 2014, arXiv [Condensed Matter - Materials Sciences], 1406.3335
- Doughty, 2011, Linden’s Handbook of Batteries
- Greenwood, 1997, Chemistry of the Elements
- 10.1007/s10008-014-2427-x · DOI
Cited by
Sorted by citations
A Review on Electric Vehicles: Technologies and Challenges
Sanguesa, J. A., Torres-Sanz, V., Garrido, P., Martinez, F. J., & Marquez-Barja, J. M. (2021) · Smart Cities · doi:10.3390/smartcities4010022 · Cited by 1,367
Metadata
- Authors
- Adelhelm, P., Hartmann, P., Bender, C. L., Busche, M., Eufinger, C., & Janek, J.
- Affiliations
- Justus-Liebig-Universität Gießen (DE)
- Corresponding author
- Adelhelm, Philipp
- Venue
- Beilstein Journal of Nanotechnology
- Publisher
- Beilstein Institut
- Published
- 2015-04-23
- Volume
- 6
- Pages
- 1016-1055
- ISSN
- 2190-4286 (ISSN-L)
- PMC
- PMC4419580
- OpenAlex
- W2004683913
- Cited by
- 478
- References
- 255
- Citations by year
- 2026: 26 · 2025: 31 · 2024: 40 · 2023: 34 · 2022: 41 · 2021: 43 · 2020: 59 · 2019: 57 · 2018: 50 · 2017: 46 · 2016: 41 · 2015: 10
- FWCI
- 3.44
- Type
- journal article
- Language
- en
- Open access
- diamond
- doi.org
- Licence
- Locations
- Beilstein Journal of Nanotechnology (publishedVersion, cc-by)
- PubMed Central (publishedVersion, cc-by)
- Repository KITopen (Karlsruhe Institute of Technology) (publishedVersion, other-oa)
- PubMed (publishedVersion)
- DOAJ (DOAJ: Directory of Open Access Journals) (submittedVersion, cc-by-sa)
- KITopen (other-oa)
- Topics
- Physical Sciences › Engineering › Electrical and Electronic Engineering › Advanced Battery Materials and Technologies
- Physical Sciences › Engineering › Electrical and Electronic Engineering › Advancements in Battery Materials
- Physical Sciences › Materials Science › Materials Chemistry › Thermal Expansion and Ionic Conductivity
- Keywords
- sodium-sulfur batteries, sodium-oxygen batteries, lithium-sulfur batteries, lithium-oxygen batteries, room-temperature batteries, cell chemistry, ion transport, phase stability, electrode potential, energy density, rechargeable batteries
About these checks
Registry, retraction, Cites and statistics results are computed, not judged, with one exception: a printed reference that no index lists is read once by a model before it counts as a citation error. Claims are extracted by a model and kept only when their quote appears verbatim in the text; each cited source is then checked, with a model’s help, for whether it says what the claim relies on. Those verdicts can be wrong — read the claim’s quote and the cited source before relying on one.
Statistics and arithmetic are recomputed, not judged.
Confidence bands are shown only for fields calibrated on our annotated test set. None is calibrated yet, so no band is shown.
What counts as a claim ›How we measure confidence ›How we check this ›
Are you an author, or do you see a problem with this page? Request a review
