

The DOI matches its Crossref record; 28 of the 29 references it cites were found in a registry or an index.
Ridge Regression and Other Kernels for Genomic Selection with R Package rrBLUP
Open accessAbstract
Many important traits in plant breeding are polygenic and therefore recalcitrant to traditional marker-assisted selection. Genomic selection addresses this complexity by including all markers in the prediction model. A key method for the genomic prediction of breeding values is ridge regression (RR), which is equivalent to best linear unbiased prediction (BLUP) when the genetic covariance between lines is proportional to their similarity in genotype space. This additive model can be broadened to include epistatic effects by using other kernels, such as the Gaussian, which represent inner products in a complex feature space. To facilitate the use of RR and nonadditive kernels in plant breeding, a new software package for R called rrBLUP has been developed. At its core is a fast maximum-likelihood algorithm for mixed models with a single variance component besides the residual error, which allows for efficient prediction with unreplicated training data. Use of the rrBLUP software is demonstrated through several examples, including the identification of optimal crosses based on superior progeny value. In cross-validation tests, the prediction accuracy with nonadditive kernels was significantly higher than RR for wheat (Triticum aestivum L.) grain yield but equivalent for several maize (Zea mays L.) traits.
Overview
The claims and statistics of this paper haven’t been checked yet.
Run the check — free, no account needed. It reads the open-access text and checks the sources it cites.
Integrity signals
Registry
Cites
Statistics
Figures
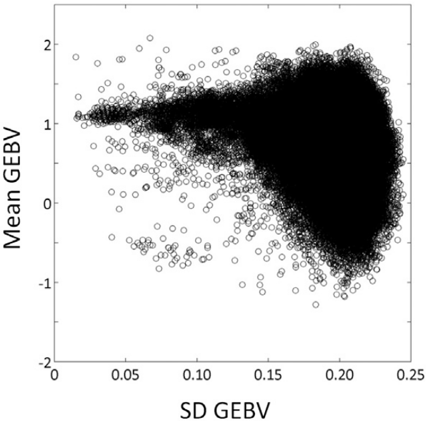
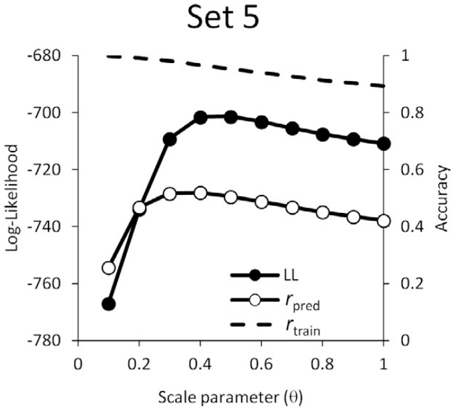
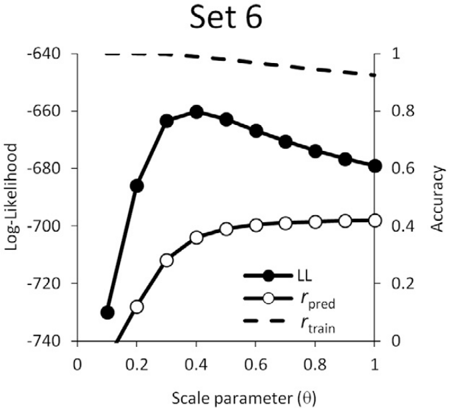
Verification
Claims the paper makes
The claims and statistics of this paper haven’t been checked yet.
Run the check — free, no account needed. It reads the open-access text and checks the sources it cites.
Claims other papers make about this one
Each is checked against this paper’s own text: does it say what the citing paper says it does?
The cited source says what the claim attributes to it.
In the citing paper
“Endelman (2011) developed the R -package rrBLUP that allows convenient restricted maximum likelihood (REML) estimation of the bandwidth, but only in the context of LMMs with a single genetic variance component, i.e., no G × E or G × E × M interaction models.”
From REML implementations of kernel-based genomic prediction models for genotype x environment x management interactions (2025) · cites this paper as Endelman (2011)
Self-check
Percentages, sums and reported differences re-computed from the paper’s own numbers.
The self-check needs the paper’s full text.
Citations
Cites
R: A Language and Environment for Statistical Computing
R Core Team (2000) · doi:10.32614/r.manuals · Cited by 355,893
Schölkopf, B., & Smola, A. J. (2001) · The MIT Press eBooks · doi:10.7551/mitpress/4175.001.0001 · Cited by 11,934
Prediction of Total Genetic Value Using Genome-Wide Dense Marker Maps
Meuwissen, T. H. E., Hayes, B. J., & Goddard, M. E. (2001) · Genetics · doi:10.1093/genetics/157.4.1819 · Cited by 7,917
TASSEL: software for association mapping of complex traits in diverse samples
Bradbury, P. J., Zhang, Z., Kroon, D. E., Casstevens, T. M., Ramdoss, Y., & Buckler, E. S. (2007) · Bioinformatics · doi:10.1093/bioinformatics/btm308 · Cited by 7,785
Ridge Regression: Biased Estimation for Nonorthogonal Problems
Hoerl, A. E., & Kennard, R. W. (2000) · Technometrics · doi:10.2307/1271436 · Cited by 7,001
Learning With Kernels: Support Vector Machines, Regularization, Optimization, and Beyond
Williams, C. K. I. (2003) · Journal of the American Statistical Association · doi:10.1198/jasa.2003.s269 · Cited by 4,390
Yu, J., Pressoir, G., Briggs, W. H., Bi, I. V., Yamasaki, M., Doebley, J., McMullen, M. D., Gaut, B. S., Nielsen, D. M., Holland, J. B., et al. (2005) · Nature Genetics · doi:10.1038/ng1702 · Cited by 4,155
Browning, S. R., & Browning, B. L. (2007) · The American Journal of Human Genetics · doi:10.1086/521987 · Cited by 3,217
Efficient Control of Population Structure in Model Organism Association Mapping
Kang, H. M., Zaitlen, N., Wade, C. M., Kirby, A. W., Heckerman, D. E., Daly, M. J., & Eskin, E. (2008) · Genetics · doi:10.1534/genetics.107.080101 · Cited by 1,869
Genomic Selection for Crop Improvement
Heffner, E. L., Sorrells, M. E., & Jannink, J. (2009) · Crop Science · doi:10.2135/cropsci2008.08.0512 · Cited by 1,753
Research works printed but not linked: 3
- Bernardo, 2010, Quantitative traits in plant breeding
- SAS Institute, 1994, SAS 9.2 for Windows
- Searle, 2006, Variance components
Cited by
Sorted by citations
Items 901–1,000 of 1,001
Hybrid Deep Learning Approaches for Improved Genomic Prediction in Crop Breeding
Li, R., Zhang, D., Han, Y., Liu, Z., Zhang, Q., Zhang, Q., Wang, X., Pan, S., Sun, J., & Wang, K. (2025) · Agriculture · doi:10.3390/agriculture15111171 · Cited by 16
Improving genomic prediction for plant disease using environmental covariates
Brault, C., Conley, E. J., Read, A. C., Green, A. J., Glover, K. D., Cook, J. P., Gill, H. S., Fiedler, J. D., & Anderson, J. A. (2025) · Plant Methods · doi:10.1186/s13007-025-01418-0 · Cited by 15
Lauer, E., Holland, J. B., & Işik, F. (2021) · G3 Genes Genomes Genetics · doi:10.1093/g3journal/jkab405 · Cited by 15
Genomics-Enabled Management of Genetic Resources in Radiata Pine
Klápště, J., Ismael, A., Paget, M., Graham, N. J., Stovold, G. T., Dungey, H. S., & Slavov, G. T. (2022) · Forests · doi:10.3390/f13020282 · Cited by 15
Multiallelic models for QTL mapping in diverse polyploid populations
Navarro, A. T., Tumino, G., Voorrips, R. E., Arens, P. F. P., SMULDERS, M. J. M., Weg, E. W. V. D., & Maliepaard, C. A. (2022) · BMC Bioinformatics · doi:10.1186/s12859-022-04607-z · Cited by 15
Merrick, L. F., Lozada, D. N., Chen, X., & Carter, A. H. (2022) · Frontiers in Genetics · doi:10.3389/fgene.2022.835781 · Cited by 15
Canopy cooling traits associated with yield performance in heat-stressed oat
López, J. R., Tamang, B. G., Monnens, D., Smith, K. P., & Sadok, W. (2022) · European Journal of Agronomy · doi:10.1016/j.eja.2022.126555 · Cited by 15
Akohoue, F., Koch, S., Plieske, J., & Miedaner, T. (2022) · Theoretical and Applied Genetics · doi:10.1007/s00122-022-04219-4 · Cited by 15
Bhattarai, G., Olaoye, D., Mou, B., Correll, J. C., & Shi, A. (2022) · Frontiers in Plant Science · doi:10.3389/fpls.2022.1012923 · Cited by 15
Wei, W., Li, S.-D., Li, P., Yu, K., Fan, G., Wang, Y., Zhao, F. J., Zhang, X., Feng, X., Shi, G., et al. (2023) · Frontiers in Plant Science · doi:10.3389/fpls.2022.1035906 · Cited by 15
Dallinger, H. G., Löschenberger, F., Azrak, N., Ametz, C., Michel, S., & Buerstmayr, H. (2023) · The Plant Genome · doi:10.1002/tpg2.20301 · Cited by 15
Islam, M. S., Corak, K., McCord, P. H., Hulse‐Kemp, A. M., & Lipka, A. E. (2023) · Frontiers in Plant Science · doi:10.3389/fpls.2023.1205999 · Cited by 15
A medium‐density genotyping platform for cultivated strawberry using DArTag technology
Hardigan, M. A., Feldmann, M. J., Carling, J., Zhu, A., Kilian, A., Famula, R. A., Cole, G. S., & Knapp, S. J. (2023) · The Plant Genome · doi:10.1002/tpg2.20399 · Cited by 15
Screening of potential donors for anaerobic stress tolerance during germination in rice
Mwakyusa, L., Heredia, M. C., Kilasi, N. L., Madege, R. R., Herzog, M., & Dixit, S. (2023) · Frontiers in Plant Science · doi:10.3389/fpls.2023.1261101 · Cited by 15
Yeon, J., Nguyen, T. T. P., Kim, M., & Sim, S. (2024) · BMC Plant Biology · doi:10.1186/s12870-024-04934-8 · Cited by 15
Integrating Bioinformatics and Machine Learning for Genomic Prediction in Chickens
Li, X., Chen, X., Wang, Q., Yang, N., & Sun, C. (2024) · Genes · doi:10.3390/genes15060690 · Cited by 15
Sabag, I., Bi, Y., Sahoo, M. M., Herrmann, I., Morota, G., & Peleg, Z. (2024) · The Plant Genome · doi:10.1002/tpg2.20481 · Cited by 15
Lin, Z., Yoshikawa, S., Hamasaki, M., Kikuchi, K., & Hosoya, S. (2024) · Aquaculture · doi:10.1016/j.aquaculture.2024.741491 · Cited by 15
Gille, D., Eenennaam, J. P. V., Famula, T. R., Schreier, A. D., Beer, K., Struffenegger, P., Renschler, B., Bishop, S., & Doroshov, S. I. (2017) · Aquaculture · doi:10.1016/j.aquaculture.2017.03.045 · Cited by 15
A targeted genotyping-by-sequencing tool (Rapture) for genomics-assisted breeding in oat
Bekele, W. A., Itaya, A., Boyle, B., Yan, W., Fetch, J. M., & Tinker, N. A. (2019) · Theoretical and Applied Genetics · doi:10.1007/s00122-019-03496-w · Cited by 15
Lubanga, N., Massawe, F. J., & Mayes, S. (2021) · Euphytica · doi:10.1007/s10681-021-02774-3 · Cited by 15
Akond, Z., Ahsan, M. A., Alam, M., & Mollah, M. N. H. (2021) · Scientific Reports · doi:10.1038/s41598-021-90774-7 · Cited by 15
Laviola, B. G., dos Santos, A., Rodrigues, E. V., Teodoro, L. P. R., Teodoro, P. E., Rosado, T. B., Guimarães, C. G., & da Conceição, L. D. H. C. S. (2021) · Genetic Resources and Crop Evolution · doi:10.1007/s10722-021-01295-1 · Cited by 15
Sallam, A. H., Smith, K. P., Hu, G., Sherman, J., Baenziger, P. S., Wiersma, J., Duley, C., Stockinger, E. J., Sorrells, M. E., Szinyei, T., et al. (2021) · Frontiers in Plant Science · doi:10.3389/fpls.2021.800284 · Cited by 15
Feldmann, M. J., Piepho, H., & Knapp, S. J. (2022) · G3 Genes Genomes Genetics · doi:10.1093/g3journal/jkac080 · Cited by 16
Roy, J. K., Mendoza, L. E. D. R., Bandillo, N. B., McClean, P. E., & Rahman, M. (2022) · Theoretical and Applied Genetics · doi:10.1007/s00122-022-04104-0 · Cited by 15
Genetic control of grain amino acid composition in a UK soft wheat mapping population
Oddy, J., Chhetry, M., Awal, R., Addy, J., Wilkinson, M., Smith, D. P., King, R., Hall, C., Testa, R., Murray, E., et al. (2023) · The Plant Genome · doi:10.1002/tpg2.20335 · Cited by 16
Zhang, G., Bi, Z., Jiang, J., Lu, J., Li, K., Bai, D., Wang, X., Zhao, X., Li, M., Zhao, X., et al. (2023) · Frontiers in Plant Science · doi:10.3389/fpls.2023.1170641 · Cited by 15
Salsman, E., Liu, Y., Hosseinirad, S., Kumar, A., Manthey, F. A., Elias, E. M., & Li, X. (2021) · Crop Science · doi:10.1002/csc2.20449 · Cited by 15
Lee, Y. S., Shin, D., Lee, W., Taye, M., Cho, K., Park, K.-D., & Kim, H. (2015) · Asian-Australasian Journal of Animal Sciences · doi:10.5713/ajas.15.0476 · Cited by 15
Sweeney, D. W., Sun, J., Taagen, E., & Sorrells, M. E. (2019) · Elsevier eBooks · doi:10.1016/b978-0-08-102163-7.00013-2 · Cited by 15
Wang, J., Chen, Y., Shu, G., Zhao, M., Zheng, A., Chang, X., Li, G., Wang, Y., & Zhang, Y. (2025) · Plant Communications · doi:10.1016/j.xplc.2025.101385 · Cited by 14
Plant disease epidemiology in the age of artificial intelligence and machine learning
Neik, T. X., Dolatabadian, A., Danilevicz, M. F., Upadhyaya, S. R., Zhang, F., Batley, J., & Edwards, D. (2025) · Agriculture Communications · doi:10.1016/j.agrcom.2025.100089 · Cited by 15
Huster, A. R., Wallace, L. T., & Myers, J. R. (2021) · Frontiers in Plant Science · doi:10.3389/fpls.2021.697615 · Cited by 14
Monnot, S., Cantet, M., Mary‐Huard, T., Moreau, L., Lowdon, R. F., Haesendonck, M. V., Ricard, A., & Boissot, N. (2022) · Horticulture Research · doi:10.1093/hr/uhac184 · Cited by 14
Accuracy of Genomic Prediction of Yield and Sugar Traits in Saccharum spp. Hybrids
Islam, M. S., McCord, P. H., Read, Q. D., Qin, L., Lipka, A. E., Sood, S. G., Todd, J., & Olatoye, M. O. (2022) · Agriculture · doi:10.3390/agriculture12091436 · Cited by 14
Ballén‐Taborda, C., Lyerly, J. H., Smith, J. H., Howell, K., Brown‐Guedira, G., Babar, M. A., Harrison, S. A., Mason, R. E., Mergoum, M., Murphy, J. P., et al. (2022) · Frontiers in Genetics · doi:10.3389/fgene.2022.964684 · Cited by 14
Simulations of rate of genetic gain in dry bean breeding programs
Lin, J., Arief, V. N., Jahufer, M. Z. Z., Osorno, J. M., McClean, P., Jarquín, D., & Hoyos‐Villegas, V. (2023) · Theoretical and Applied Genetics · doi:10.1007/s00122-023-04244-x · Cited by 14
Xiong, H., Chen, Y., Pan, Y., & Shi, A. (2023) · Plants · doi:10.3390/plants12051041 · Cited by 14
Two simple methods to improve the accuracy of the genomic selection methodology
Montesinos-López, O. A., KISMIANTINI, K., & Montesinos‐López, A. (2023) · BMC Genomics · doi:10.1186/s12864-023-09294-5 · Cited by 14
Use of remote sensing for linkage mapping and genomic prediction for common rust resistance in maize
Loladze, A., Rodrigues, F. A., Petroli, C. D., Muñoz, C., Naranjo, S., Vicente, F. S., Gerard, B. G., Montesinos-López, O. A., Crossa, J. L., & Martini, J. W. R. (2024) · Field Crops Research · doi:10.1016/j.fcr.2024.109281 · Cited by 14
Genetic control of abiotic stress-related specialized metabolites in sunflower
Moroldo, M., Blanchet, N., Duruflé, H., Bernillon, S., Berton, T., Fernández, O., Gibon, Y., Moing, A., & Langlade, N. (2024) · BMC Genomics · doi:10.1186/s12864-024-10104-9 · Cited by 14
Morales, N., Anche, M. T., Kaczmar, N. S., Lepak, N. K., Ni, P., Romay, M. C., Santantonio, N., Buckler, E. S., Gore, M. A., Mueller, L. A., et al. (2024) · Genetics · doi:10.1093/genetics/iyae037 · Cited by 14
Nazzicari, N., Franguelli, N., Ferrari, B., Pecetti, L., & Annicchiarico, P. (2024) · Genes · doi:10.3390/genes15040449 · Cited by 14
Dual-Model GWAS Analysis and Genomic Selection of Maize Flowering Time-Related Traits
Fan, Z., Lin, S., Jiang, J., Zeng, Y., Meng, Y., Ren, J., & Wu, P. (2024) · Genes · doi:10.3390/genes15060740 · Cited by 14
Wang, X., Stein, L. A., Black, M. C., Kubenka, K., Randall, J. J., & Ding, C. (2024) · Scientific Reports · doi:10.1038/s41598-024-69521-1 · Cited by 14
Herrera, J. M., Häner, L. L., Holzkämper, A., & Pellet, D. (2018) · Agricultural and Forest Meteorology · doi:10.1016/j.agrformet.2017.12.263 · Cited by 14
Gaire, R., Huang, M. F., Sneller, C., Griffey, C. A., Brown‐Guedira, G., & Mohammadi, M. (2019) · Crop Science · doi:10.2135/cropsci2018.12.0751 · Cited by 14
Combining Partially Overlapping Multi-Omics Data in Databases Using Relationship Matrices
Akdemir, D., Knox, R. E., & y Sánchez, J. I. (2020) · Frontiers in Plant Science · doi:10.3389/fpls.2020.00947 · Cited by 14
Towards Mapping Images to Text Using Deep-Learning Architectures
Onita, D., Birlutiu, A., & Dinu, L. P. (2020) · Mathematics · doi:10.3390/math8091606 · Cited by 14
Genome‐wide association analysis of natural variation in seed tocochromanols of barley
Mahalingam, R., Sallam, A. H., Steffenson, B. J., Fiedler, J. D., & Walling, J. G. (2020) · The Plant Genome · doi:10.1002/tpg2.20039 · Cited by 14
Araki, Y., & Sota, T. (2020) · Molecular Ecology · doi:10.1111/mec.15758 · Cited by 14
Altendorf, K. R., Larson, S. R., DeHaan, L. R., Crain, J. L., Neyhart, J., Dorn, K., & Anderson, J. A. (2021) · G3 Genes Genomes Genetics · doi:10.1093/g3journal/jkab025 · Cited by 14
Orchard, C. J., Cooperstone, J. L., Gas‐Pascual, E., Andrade, M. C., Abud, G., Schwartz, S. J., & Francis, D. M. (2021) · The Plant Genome · doi:10.1002/tpg2.20085 · Cited by 14
Aoun, M., Carter, A. H., Thompson, Y. A., Ward, B., & Morris, C. F. (2021) · The Plant Genome · doi:10.1002/tpg2.20128 · Cited by 16
Gain from genomic selection for a selection index in two‐row spring barley
Sweeney, D. W., Rooney, T. E., & Sorrells, M. E. (2021) · The Plant Genome · doi:10.1002/tpg2.20138 · Cited by 14
Patel, A., García‐Closas, M., Olshan, A. F., Perou, C. M., Troester, M. A., Love, M. I., & Bhattacharya, A. (2021) · Cancer Research · doi:10.1158/0008-5472.can-21-1207 · Cited by 14
Genomic Prediction of Green Fraction Dynamics in Soybean Using Unmanned Aerial Vehicles Observations
Toda, Y., Sasaki, G., Ohmori, Y., Yamasaki, Y., Takahashi, H., Takanashi, H., Tsuda, M., Kajiya‐Kanegae, H., López‐Lozano, R., Tsujimoto, H., et al. (2022) · Frontiers in Plant Science · doi:10.3389/fpls.2022.828864 · Cited by 14
The genetic basis of transpiration sensitivity to vapor pressure deficit in wheat
Tamang, B. G., Monnens, D., Anderson, J. A., Steffenson, B. J., & Sadok, W. (2022) · Physiologia Plantarum · doi:10.1111/ppl.13752 · Cited by 14
Molecular insights into the dynamics of species invasion by hybridisation in Tasmanian eucalypts
Pfeilsticker, T. R., Jones, R. C., Steane, D. A., Vaillancourt, R. E., & Potts, B. M. (2023) · Molecular Ecology · doi:10.1111/mec.16892 · Cited by 14
Cruppe, G., Silva, P., da Silva, C. L., Peterson, G. L., Pedley, K. F., Cruz, C. D., Asif, M., Lollato, R. P., Fritz, A. K., & Valent, B. S. (2020) · Crop Science · doi:10.1002/csc2.20397 · Cited by 14
Cao, S., Song, J., Yuan, Y., Zhang, A., Ren, J., Liu, Y., Qu, J., Hu, G., Zhang, J., Wang, C., et al. (2021) · Frontiers in Plant Science · doi:10.3389/fpls.2021.672525 · Cited by 14
Viana, J. M. S., Piepho, H., & Silva, F. F. E. (2016) · Scientia Agricola · doi:10.1590/1678-992x-2015-0479 · Cited by 14
Cabezas, J. A., González‐Martínez, S. C., Collada, C., Guevara, M. Á., Boury, C., de María, N., Eveno, E., Aranda, I., Garnier‐Géré, P. H., Brach, J., et al. (2015) · Tree Physiology · doi:10.1093/treephys/tpv050 · Cited by 14
Genome-wide association analysis and genomic selection for leaf-related traits of maize
Zeng, Y., Xu, X., Jiang, J., Lin, S., Fan, Z., Meng, Y., Maimaiti, A., Wu, P., & Ren, J. (2025) · PLoS ONE · doi:10.1371/journal.pone.0323140 · Cited by 13
Carlson, C. H., Fiedler, J. D., Naraghi, S. M., Nazareno, E. S., Ardayfio, N. K., McMullen, M. S., & Kianian, S. F. (2022) · Genetics · doi:10.1093/genetics/iyac128 · Cited by 13
Lima, D. C., de León, N., & Kaeppler, S. M. (2022) · Crop Science · doi:10.1002/csc2.20854 · Cited by 13
Ozimati, A., Esuma, W., Manze, F., Iragaba, P., Kanaabi, M., Ano, C. U., Egesi, C. N., & Kawuki, R. (2022) · Frontiers in Plant Science · doi:10.3389/fpls.2022.1018156 · Cited by 13
Liang, M., Cao, S., Deng, T., Du, L., Li, K., An, B., Du, Y., Xu, L., Zhang, L., Gao, X., et al. (2023) · Briefings in Bioinformatics · doi:10.1093/bib/bbad043 · Cited by 13
Annicchiarico, P., de Buck, A., Vlachostergios, D. Ν., Heupink, D., Koskosidis, A., Nazzicari, N., & Crosta, M. (2023) · Plants · doi:10.3390/plants12051139 · Cited by 13
Predicting phenotypes from novel genomic markers using deep learning
Sehrawat, S., Najafian, K., & Jin, L. (2023) · Bioinformatics Advances · doi:10.1093/bioadv/vbad028 · Cited by 15
Buchanan, J. W., Flagel, L., MacNeil, M. D., Nilles, A. R., Hoff, J. L., Pickrell, J. K., & Raymond, R. C. (2023) · Frontiers in Genetics · doi:10.3389/fgene.2023.1148301 · Cited by 13
GWAS and genomic selection for marker-assisted development of sucrose enriched soybean cultivars
Riaz, A., Raza, Q. S., Kumar, A., Dean, D., Chiwina, K. E., Phiri, T. M., Thomas, J., & Shi, A. (2023) · Euphytica · doi:10.1007/s10681-023-03224-y · Cited by 13
Construction of a strawberry breeding core collection to capture and exploit genetic variation
Koorevaar, T., Willemsen, J. H., Visser, R. G. F., Arens, P. F. P., & Maliepaard, C. A. (2023) · BMC Genomics · doi:10.1186/s12864-023-09824-1 · Cited by 13
Rossi, N., Powell, W., Mackay, I., Hickey, L. T., Maurer, A., Pillen, K., Halliday, K., & Sharma, R. K. (2024) · Theoretical and Applied Genetics · doi:10.1007/s00122-024-04618-9 · Cited by 13
Li, H., Zhang, C., Wen, H., Qi, X., Dong, Y., Liu, C., Zhang, Y., Niu, C., & Li, Y. (2024) · Aquaculture · doi:10.1016/j.aquaculture.2024.741962 · Cited by 13
Shi, A., Xiong, H., Michaels, T. E., & Chen, S. (2025) · Frontiers in Plant Science · doi:10.3389/fpls.2025.1520087 · Cited by 13
Ji, L., Hou, W., Zhou, H., Xiong, L., Liu, C., Yuan, Z., & Li, L. (2025) · Theoretical and Applied Genetics · doi:10.1007/s00122-025-04894-z · Cited by 13
Han, L., Wang, X., Benke, R., Tibbs‐Cortes, L. E., Zhao, P., Sanguinet, K. A., Zhang, Z., Xu, S., Yu, J., & Li, X. (2025) · Genome biology · doi:10.1186/s13059-025-03740-1 · Cited by 13
Genomewide prediction of tropical maize single-crosses
Mendes, M. P., & de Souza, C. L. (2016) · Euphytica · doi:10.1007/s10681-016-1642-1 · Cited by 13
The Accuracy of Genomic Prediction between Environments and Populations for Soft Wheat Traits
Huang, M. F., Ward, B., Griffey, C. A., Sanford, D. A. V., McKendry, A. L., Brown‐Guedira, G., Tyagi, P., & Sneller, C. (2018) · Crop Science · doi:10.2135/cropsci2017.10.0638 · Cited by 13
Liu, Q., Hobbs, H. A., & Domier, L. L. (2019) · Theoretical and Applied Genetics · doi:10.1007/s00122-019-03434-w · Cited by 13
Persa, R., Bernardeli, A., & Jarquín, D. (2020) · Agriculture · doi:10.3390/agriculture10080308 · Cited by 13
Zhao, X., Nie, G., Yao, Y., Ji, Z., Gao, J., Wang, X., & Jiang, Y. (2020) · Journal of Experimental Botany · doi:10.1093/jxb/eraa388 · Cited by 13
Ross, E. M., Hayes, B. J., Tucker, D. J., Bond, J. J., Denman, S. E., & Oddy, V. H. (2020) · Journal of Animal Science · doi:10.1093/jas/skaa262 · Cited by 18
No outbreeding depression in a trial of targeted gene flow in an endangered Australian marsupial
Kelly, E. L., Rangers, K. T. O. A., Jolly, C. J., Indigo, N., Smart, A. S., Webb, J. K., & Phillips, B. L. (2020) · Conservation Genetics · doi:10.1007/s10592-020-01316-z · Cited by 13
High density genotype storage for plant breeding in the Chado schema of Breedbase
Morales, N., Bauchet, G. J., Tantikanjana, T., Powell, A. F., Ellerbrock, B. J., Tecle, I., & Mueller, L. A. (2020) · PLoS ONE · doi:10.1371/journal.pone.0240059 · Cited by 13
Multi-trait genomic selection indexes applied to identification of superior genotypes
Silva, L. A., Peixoto, M. A., Peixoto, L. D. A., Romero, J. V., & Bhering, L. L. (2021) · Bragantia · doi:10.1590/1678-4499.20200381 · Cited by 13
Liu, C., Liu, X., Han, Y., Wang, X. L., Ding, Y., Meng, H., & Cheng, Z. (2021) · Frontiers in Plant Science · doi:10.3389/fpls.2021.729328 · Cited by 14
Cazenave, X., Petit, B., Lateur, M., Nybom, H., Sedlák, J., Tartarini, S., Laurens, F. N. D., Durel, C.-É., & Muranty, H. (2021) · G3 Genes Genomes Genetics · doi:10.1093/g3journal/jkab420 · Cited by 13
Katz, A., Byrne, P. F., Reid, S., Bratschun, S., Haley, S. D., & Pearce, S. P. (2022) · Molecular Breeding · doi:10.1007/s11032-022-01288-7 · Cited by 13
Keller, B., Ariza-Suárez, D., Benavides, A. E. P., Buendía, H. F., Aparicio, J. S., Amongi, W., Mbiu, J., Msolla, S. N., Miklas, P. N., Porch, T. G., et al. (2022) · Frontiers in Plant Science · doi:10.3389/fpls.2022.830896 · Cited by 13
Accurate predictions of barley phenotypes using genomewide markers and environmental covariates
Neyhart, J., Silverstein, K. A. T., & Smith, K. P. (2022) · Crop Science · doi:10.1002/csc2.20782 · Cited by 13
Accuracy of genomic selection for alfalfa biomass yield in two full-sib populations
He, X., Zhang, F., He, F., Shen, Y., Yu, L., Zhang, T., & Kang, J. (2022) · Frontiers in Plant Science · doi:10.3389/fpls.2022.1037272 · Cited by 15
Suganami, M., Kojima, S., Wang, F., Yoshida, H., Miura, K., Morinaka, Y., Watanabe, M., Matsuda, T., Yamamoto, E., & Matsuoka, M. (2023) · PLANT PHYSIOLOGY · doi:10.1093/plphys/kiad018 · Cited by 13
Fradgley, N. S., Bentley, A. R., Gardner, K. A., Swarbreck, S. M., & Kerton, M. (2023) · The Plant Genome · doi:10.1002/tpg2.20326 · Cited by 14
Exploration of high‐throughput data for heat tolerance selection in Capsicum annuum
Fumia, N., Kantar, M. B., Lin, Y., Schafleitner, R., Lefèbvre, V., Paran, I., Börner, A., Díez, M. J., Prohens, J., Bovy, A. G., et al. (2023) · The Plant Phenome Journal · doi:10.1002/ppj2.20071 · Cited by 13
Tempelman, R. J. (2015) · Journal of Agricultural Biological and Environmental Statistics · doi:10.1007/s13253-015-0225-2 · Cited by 13
Naturalgwas: An R package for evaluating genomewide association methods with empirical data
François, O., & Caye, K. (2018) · Molecular Ecology Resources · doi:10.1111/1755-0998.12892 · Cited by 13
Kuki, M. C., Pinto, R. J. B., Bertagna, F. A. B., Tessmann, D. J., Júnior, A. T. D. A., Scapim, C. A., & Holland, J. B. (2020) · Crop Science · doi:10.1002/csc2.20272 · Cited by 13
Metadata
- Authors
- Endelman, J. B.
- Affiliations
- Washington State University (US)
- Corresponding author
- Endelman, Jeffrey B.
- ORCID
- Endelman, Jeffrey B.
- Venue
- The Plant Genome
- Publisher
- Wiley
- Published
- 2011-11
- Volume
- 4
- Issue
- 3
- Pages
- 250-255
- ISSN
- 1940-3372 (ISSN-L)
- OpenAlex
- W2064013109
- Cited by
- 2,094
- References
- 29
- Citations by year
- 2026: 198 · 2025: 202 · 2024: 204 · 2023: 206 · 2022: 226 · 2021: 234 · 2020: 204 · 2019: 144 · 2018: 110 · 2017: 112 · 2016: 99 · 2015: 82 · 2014: 36 · 2013: 23 · 2012: 9
- FWCI
- 14.37
- Type
- journal article
- Language
- en
- Open access
- gold
- doi.org
- Licence
- cc-by-nc-nd
- doi.wiley.com/10.1002/tdm_license_1.1 (tdm)
- Locations
- The Plant Genome (publishedVersion, cc-by-nc-nd)
- DOAJ (DOAJ: Directory of Open Access Journals) (submittedVersion, cc-by-sa)
- Topics
- Life Sciences › Biochemistry, Genetics and Molecular Biology › Genetics › Genetic and phenotypic traits in livestock
- Life Sciences › Biochemistry, Genetics and Molecular Biology › Genetics › Genetic Mapping and Diversity in Plants and Animals
- Life Sciences › Agricultural and Biological Sciences › Plant Science › Genetics and Plant Breeding
- Keywords
- genomic selection, ridge regression, BLUP, Gaussian kernel, breeding value estimation, plant breeding, wheat grain yield, cross-validation
About these checks
Registry, retraction, Cites and statistics results are computed, not judged, with one exception: a printed reference that no index lists is read once by a model before it counts as a citation error. Claims are extracted by a model and kept only when their quote appears verbatim in the text; each cited source is then checked, with a model’s help, for whether it says what the claim relies on. Those verdicts can be wrong — read the claim’s quote and the cited source before relying on one.
Statistics and arithmetic are recomputed, not judged.
Confidence bands are shown only for fields calibrated on our annotated test set. None is calibrated yet, so no band is shown.
What counts as a claim ›How we measure confidence ›How we check this ›
Are you an author, or do you see a problem with this page? Request a review
