Student or educator? Sign up with your school email and get 6 months of Pro free.
Cited by 33

The DOI matches its Crossref record; 56 of the 56 references it cites were found in a registry or an index.

Small extracellular vesicles secreted by induced pluripotent stem cell-derived mesenchymal stem cells improve postoperative cognitive dysfunction in mice with diabetes

Lang, Hai-Li, Zhao, Yan-Zhi, Xiao, Ren-Jie, Sun, Jing, Chen, Yong, Hu, Guo-Wen, Xu, Guo-Hai·2023·Neural Regeneration Research

Abstract

JOURNAL/nrgr/04.03/01300535-202303000-00039/figure1/v/2026-05-25T154646Z/r/image-tiff Postoperative cognitive dysfunction (POCD) is a common surgical complication. Diabetes mellitus (DM) increases risk of developing POCD after surgery. DM patients with POCD seriously threaten the quality of patients’ life, however, the intrinsic mechanism is unclear, and the effective treatment is deficiency. Previous studies have demonstrated neuronal loss and reduced neurogenesis in the hippocampus in mouse models of POCD. In this study, we constructed a mouse model of DM by intraperitoneal injection of streptozotocin, and then induced postoperative cognitive dysfunction by transient bilateral common carotid artery occlusion. We found that mouse models of DM-POCD exhibited the most serious cognitive impairment, as well as the most hippocampal neural stem cells (H-NSCs) loss and neurogenesis decline. Subsequently, we hypothesized that small extracellular vesicles secreted by induced pluripotent stem cell-derived mesenchymal stem cells (iMSC-sEVs) might promote neurogenesis and restore cognitive function in patients with DM-POCD. iMSC-sEVs were administered via the tail vein beginning on day 2 after surgery, and then once every 3 days for 1 month thereafter. Our results showed that iMSC-sEVs treatment significantly recovered compromised proliferation and neuronal-differentiation capacity in H-NSCs, and reversed cognitive impairment in mouse models of DM-POCD. Furthermore, miRNA sequencing and qPCR showed miR-21-5p and miR-486-5p were the highest expression in iMSC-sEVs. We found iMSC-sEVs mainly transferred miR-21-5p and miR-486-5p to promote H-NSCs proliferation and neurogenesis. As miR-21-5p was demonstrated to directly targete Epha4 and CDKN2C, while miR-486-5p can inhibit FoxO1 in NSCs. We then demonstrated iMSC-sEVs can transfer miR-21-5p and miR-486-5p to inhibit EphA4, CDKN2C, and FoxO1 expression in H-NSCs. Collectively, these results indicate significant H-NSC loss and neurogenesis reduction lead to DM-POCD, the application of iMSC-sEVs may represent a novel cell-free therapeutic tool for diabetic patients with postoperative cognitive dysfunction.

Overview

The claims and statistics of this paper haven’t been checked yet.

Run the check — free, no account needed. It reads the open-access text and checks the sources it cites.

A few free checks a day · papers already verified open instantly · results are public

Integrity signals

Registry

Crossref · 10.4103/1673-5374.350205

Cites

56 of 56 references verified0 citation errors · 0 not checkable

Statistics

Figures

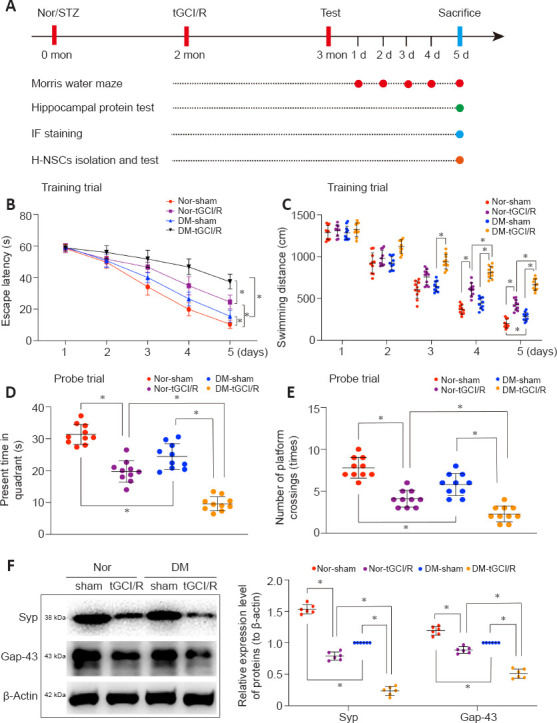
Figure 1 Cognitive impairment in DM-tGCI/R mice. (A) In vivo experiments. (B–E) Spatial learning and memory abilities in mice were tested by Morris water maze (n = 10/group). Mice in the DM + tGCI/R group showed the worst spatial learning and memory abilities among the four groups. (F) Western blot analysis of hippocampal SYP and Gap43 in mice (n = 6/group). Mice in the DM + tGCI/R group showed the lowest expression levels of hippocampal SYP and Gap43 among the four groups. All data are presented as mean ± SEM. *P < 0.05 (one-way analysis of variance followed by Bonferroni post hoc test). DM: Diabetes mellitus; Gap43: growth associated protein 43; SYP: Synaptophysin; tGCI/R: transient global cerebral ischemia/reperfusion.
Figure 1 Cognitive impairment in DM-tGCI/R mice. (A) In vivo experiments. (B–E) Spatial learning and memory abilities in mice were tested by Morris water maze (n = 10/group). Mice in the DM + tGCI/R group showed the worst spatial learning and memory abilities among the four groups. (F) Western blot analysis of hippocampal SYP and Gap43 in mice (n = 6/group). Mice in the DM + tGCI/R group showed the lowest expression levels of hippocampal SYP and Gap43 among the four groups. All data are presented as mean ± SEM. *P < 0.05 (one-way analysis of variance followed by Bonferroni post hoc test). DM: Diabetes mellitus; Gap43: growth associated protein 43; SYP: Synaptophysin; tGCI/R: transient global cerebral ischemia/reperfusion.CC BY-NC-SA · PubMed Central
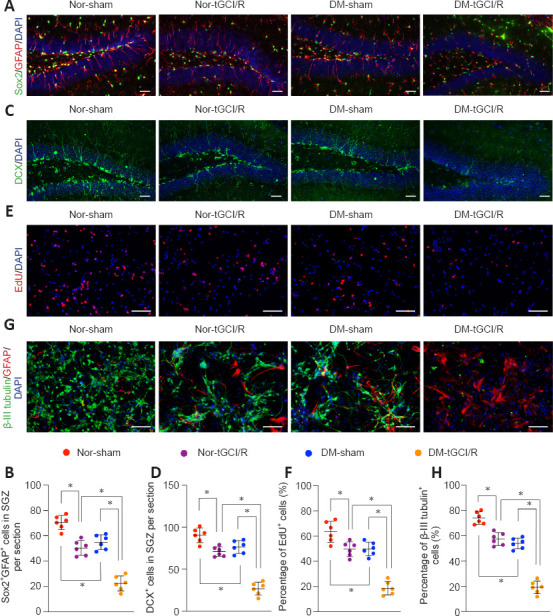
Figure 2 H-NSC proliferation and neuronal differentiation deficits in DM-tGCI/R mice. (A) Immunofluorescence (IF) staining of Sox2+ (Alexa Fluor 488, green) and GFAP+ (Alexa Fluor 594, red), and DAPI nuclear staining (blue) in the hippocampus and (B) estimated numbers of Sox2+/GFAP+ cells. The number was lowest in the DM + tGCI/R group. (C) IF staining of hippocampal proliferative immature neurons (DCX+; Alexa Fluor 488, green) and DAPI nuclear staining (blue) and (D) estimated numbers of DCX+ cells. The number was lowest in the DM + tGCI/R group. (E) IF staining of EdU (Alexa Fluor 594, red) incorporation and DAPI nuclear staining (blue) in isolated H-NSCs and (F) quantification of EdU+/DAPI+ cells in DAPI+ cells. The percentage of proliferating H-NSCs (EdU+/DAPI+ cells) was lowest in the DM + tGCI/R group. (G) IF staining of neuronal differentiation (β-III tubulin+, Alexa Fluor 488, green; GFAP+, Alexa Fluor 594, red; DAPI, blue) in isolated H-NSCs and (H) quantification of β-III tubulin+ (Alexa Fluor 488, green)/DAPI+ cells among DAPI+ cells. The percentage of differentiated neurons (β-III tubulin+ cells) was lowest in the DM + tGCI/R group. Scale bars: 50 μm in A, B; 100 μm in C, D. All data are presented as mean ± SEM (n = 6/group). *P < 0.05 (one-way analysis of variance followed by Bonferroni post hoc test). DCX: Doublecortin; DM: diabetes mellitus; EdU: 5-ethynyl-2'-deoxyuridine; GFAP: glial fibrillary acidic protein; H-NSCs: hippocampal neural stem cells; IF: immunofluorescence; tGCI/R: transient global cerebral ischemia/reperfusion.
Figure 2 H-NSC proliferation and neuronal differentiation deficits in DM-tGCI/R mice. (A) Immunofluorescence (IF) staining of Sox2+ (Alexa Fluor 488, green) and GFAP+ (Alexa Fluor 594, red), and DAPI nuclear staining (blue) in the hippocampus and (B) estimated numbers of Sox2+/GFAP+ cells. The number was lowest in the DM + tGCI/R group. (C) IF staining of hippocampal proliferative immature neurons (DCX+; Alexa Fluor 488, green) and DAPI nuclear staining (blue) and (D) estimated numbers of DCX+ cells. The number was lowest in the DM + tGCI/R group. (E) IF staining of EdU (Alexa Fluor 594, red) incorporation and DAPI nuclear staining (blue) in isolated H-NSCs and (F) quantification of EdU+/DAPI+ cells in DAPI+ cells. The percentage of proliferating H-NSCs (EdU+/DAPI+ cells) was lowest in the DM + tGCI/R group. (G) IF staining of neuronal differentiation (β-III tubulin+, Alexa Fluor 488, green; GFAP+, Alexa Fluor 594, red; DAPI, blue) in isolated H-NSCs and (H) quantification of β-III tubulin+ (Alexa Fluor 488, green)/DAPI+ cells among DAPI+ cells. The percentage of differentiated neurons (β-III tubulin+ cells) was lowest in the DM + tGCI/R group. Scale bars: 50 μm in A, B; 100 μm in C, D. All data are presented as mean ± SEM (n = 6/group). *P < 0.05 (one-way analysis of variance followed by Bonferroni post hoc test). DCX: Doublecortin; DM: diabetes mellitus; EdU: 5-ethynyl-2'-deoxyuridine; GFAP: glial fibrillary acidic protein; H-NSCs: hippocampal neural stem cells; IF: immunofluorescence; tGCI/R: transient global cerebral ischemia/reperfusion.CC BY-NC-SA · PubMed Central
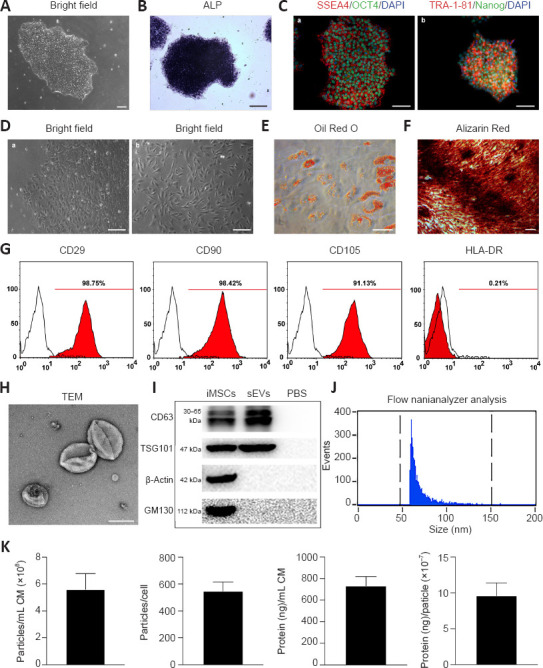
Figure 3 Generation of iMSCs and characterization of iMSC-sEVs. (A) Morphology of clonally grown iPSC colonies in bright field. (B) Alkaline phosphatase staining of iPSCs. (C) IF staining of OCT4 (Alexa Fluor 488, green), Nanog (Alexa Fluor 488, green), TRA-1-81 (Alexa Fluor 594, red), and SSEA4 (Alexa Fluor 594, red) in iPSCs. iPSCs were positive for pluripotency-related markers, including OCT4, Nanog, TRA-1-81, and SSEA4. (D) Intermediate phase of differentiation of iPSCs into iMSCs (a) and complete differentiation into fibroblast-like cells (b). After induction in MSC-induction medium, iPSCs began to lose their typical morphology and formed a monolayer of larger spindle-shaped cells at the border of the colonies. (E) Oil Red O staining of small lipid droplets in multi-differentiated iMSCs on day 21. (F) Alizarin red staining of osteogenic mineralization in multi-differentiated iMSCs on day 14. (G) Flow cytometric analysis of mesenchymal positive markers including CD29, CD90, and CD105, and negative markers including HLA-DR. Black histograms represent isotype controls and red solid peak represents the marker indicated. (H) Morphology of iMSC-sEVs observed by transmission electron microscopy. Scale bars: 100 μm in A, C, F; 150 μm in B; 500 μm in D; 50 μm in E; 100 nm in H. (I) Western blot showing presence of sEV markers including CD63 and TSG101, and negative for GM130 and β-actin. (J) Particle size distribution and concentration of iMSC-sEVs measured by nanoflow cytometry. (K) Yield of iMSC-sEVs was evaluated in terms of particle concentration and protein concentration: the mean particle concentration was 5.62 ± 1.17 × 10⁸ particles/mL iMSC-CM and 547.4 ± 64.6 particles/per cell; the mean protein concentration was 731.9 ± 86.2 ng/mL iMSC-CM and 9.6 ± 1.8 × 10⁻⁷ ng/particle. All data presented as mean ± SEM (n = 6). ALP: Alkaline phosphatase; CM: conditioned medium; iMSCs: induced pluripotent stem cell-derived mesenchymal stem cells; iPSCs: induced pluripotent stem cell; sEVs: small extracellular vesicles; TEM: transmission electron microscope.
Figure 3 Generation of iMSCs and characterization of iMSC-sEVs. (A) Morphology of clonally grown iPSC colonies in bright field. (B) Alkaline phosphatase staining of iPSCs. (C) IF staining of OCT4 (Alexa Fluor 488, green), Nanog (Alexa Fluor 488, green), TRA-1-81 (Alexa Fluor 594, red), and SSEA4 (Alexa Fluor 594, red) in iPSCs. iPSCs were positive for pluripotency-related markers, including OCT4, Nanog, TRA-1-81, and SSEA4. (D) Intermediate phase of differentiation of iPSCs into iMSCs (a) and complete differentiation into fibroblast-like cells (b). After induction in MSC-induction medium, iPSCs began to lose their typical morphology and formed a monolayer of larger spindle-shaped cells at the border of the colonies. (E) Oil Red O staining of small lipid droplets in multi-differentiated iMSCs on day 21. (F) Alizarin red staining of osteogenic mineralization in multi-differentiated iMSCs on day 14. (G) Flow cytometric analysis of mesenchymal positive markers including CD29, CD90, and CD105, and negative markers including HLA-DR. Black histograms represent isotype controls and red solid peak represents the marker indicated. (H) Morphology of iMSC-sEVs observed by transmission electron microscopy. Scale bars: 100 μm in A, C, F; 150 μm in B; 500 μm in D; 50 μm in E; 100 nm in H. (I) Western blot showing presence of sEV markers including CD63 and TSG101, and negative for GM130 and β-actin. (J) Particle size distribution and concentration of iMSC-sEVs measured by nanoflow cytometry. (K) Yield of iMSC-sEVs was evaluated in terms of particle concentration and protein concentration: the mean particle concentration was 5.62 ± 1.17 × 10⁸ particles/mL iMSC-CM and 547.4 ± 64.6 particles/per cell; the mean protein concentration was 731.9 ± 86.2 ng/mL iMSC-CM and 9.6 ± 1.8 × 10⁻⁷ ng/particle. All data presented as mean ± SEM (n = 6). ALP: Alkaline phosphatase; CM: conditioned medium; iMSCs: induced pluripotent stem cell-derived mesenchymal stem cells; iPSCs: induced pluripotent stem cell; sEVs: small extracellular vesicles; TEM: transmission electron microscope.CC BY-NC-SA · PubMed Central
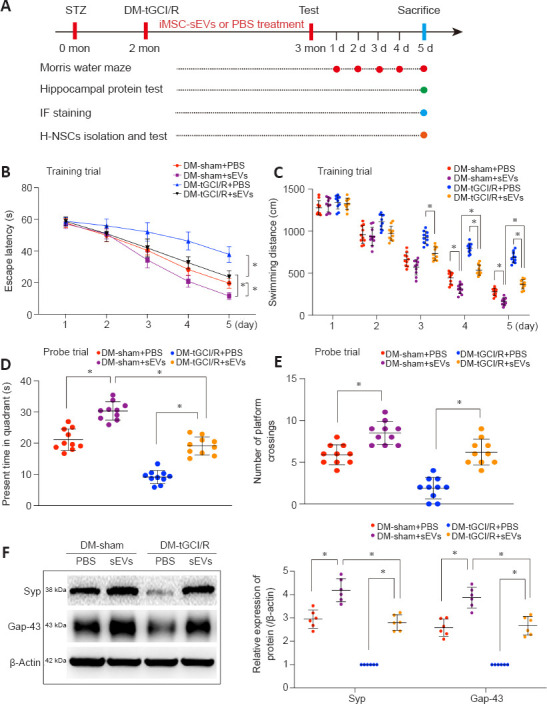
Figure 4 iMSC-sEVs reverse cognitive impairment in DM-tGCI/R mice. (A) In vivo experiments. (B–E) Spatial learning and memory abilities in mice were tested by Morris water maze (n = 10/group). iMSC-sEVs reversed spatial learning and memory deficits in DM mice suffering from tGCI/R injury. (F) Western blot analysis of hippocampal SYP and Gap43 in mice (n = 6/group). iMSC-sEVs increased expression levels of hippocampal SYP and Gap43 in DM mice suffering from tGCI/R injury. All data presented as mean ± SEM. *P < 0.05 (one-way analysis of variance followed by Bonferroni post hoc test). DM: Diabetes mellitus; Gap43: growth associated protein 43; (iMSC-)sEVs: induced pluripotent stem cell-derived mesenchymal stem cells-derived small extracellular vesicles; PBS: phosphate buffer saline; SYP: synaptophysin; tGCI/R: transient global cerebral ischemia/reperfusion.
Figure 4 iMSC-sEVs reverse cognitive impairment in DM-tGCI/R mice. (A) In vivo experiments. (B–E) Spatial learning and memory abilities in mice were tested by Morris water maze (n = 10/group). iMSC-sEVs reversed spatial learning and memory deficits in DM mice suffering from tGCI/R injury. (F) Western blot analysis of hippocampal SYP and Gap43 in mice (n = 6/group). iMSC-sEVs increased expression levels of hippocampal SYP and Gap43 in DM mice suffering from tGCI/R injury. All data presented as mean ± SEM. *P < 0.05 (one-way analysis of variance followed by Bonferroni post hoc test). DM: Diabetes mellitus; Gap43: growth associated protein 43; (iMSC-)sEVs: induced pluripotent stem cell-derived mesenchymal stem cells-derived small extracellular vesicles; PBS: phosphate buffer saline; SYP: synaptophysin; tGCI/R: transient global cerebral ischemia/reperfusion.CC BY-NC-SA · PubMed Central
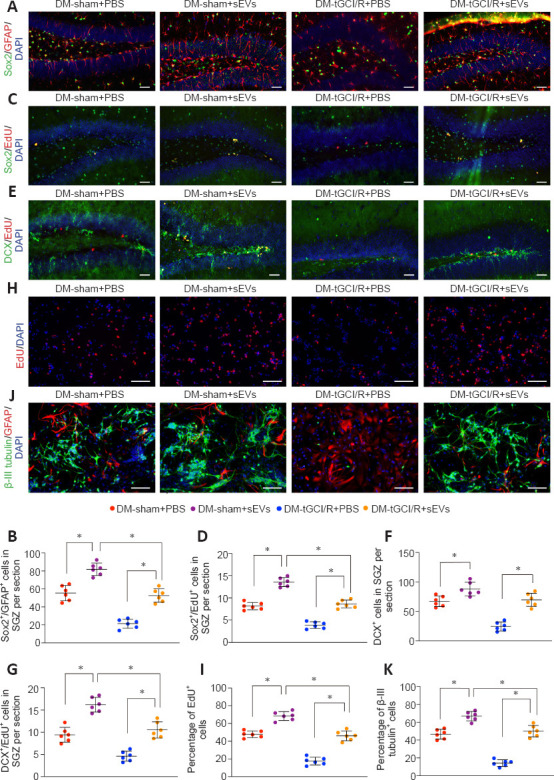
Figure 5 iMSC-sEVs promote H-NSC proliferation and neurogenesis in the SGZ in DM-tGCI/R mice. (A) IF staining of Sox2+ (Alexa Fluor 488, green) and GFAP+ (Alexa Fluor 594, red) in the hippocampus and (B) estimated numbers of Sox2+/GFAP+ cells. iMSC-sEVs improved the number of H-NSCs in DM mice suffering from tGCI/R injury. (C) IF staining of proliferative H-NSCs (EdU+, Alexa Fluor 594, red; Sox2+, Alexa Fluor 488, green) in the hippocampus and (D) estimated numbers of EdU+/Sox2+ cells Alexa. iMSC-sEVs promoted H-NSC proliferation in DM mice suffering from tGCI/R injury. (E) IF staining of hippocampal proliferative immature neurons (EdU+, Alexa Fluor 594, red; DCX+, Alexa Fluor 488, green) and (F, G) estimated numbers. iMSC-sEVs promoted hippocampal neurogenesis in DM mice suffering from tGCI/R injury. (H) IF staining of EdU incorporation in isolated H-NSCs and (I) quantification of EdU+/DAPI+ cells among DAPI+ cells. iMSC-sEVs promoted H-NSC proliferation in H-NSCs isolated from DM mice suffering from tGCI/R injury. (J) IF staining of neuronal differentiation in isolated H-NSCs and (K) quantification of β-III tubulin+/DAPI+ cells among DAPI+ cells. iMSC-sEVs promoted H-NSC neuronal differentiation in H-NSCs isolated from DM mice suffering from tGCI/R injury. Scale bars: 50 μm in A–C; 100 μm in D, E. All data presented as mean ± SEM (n = 6/group). *P < 0.05 (one-way analysis of variance followed by Bonferroni post hoc test). DCX: Doublecortin; DM: diabetes mellitus; EdU: 5-ethynyl-2'-deoxyuridine; GFAP: glial fibrillary acidic protein; H-NSCs: hippocampal neural stem cells; IF: immunofluorescence; (iMSC-)sEVs: induced pluripotent stem cell-derived mesenchymal stem cells-derived small extracellular vesicles; SGZ: subgranular zone; tGCI/R: transient global cerebral ischemia/reperfusion.
Figure 5 iMSC-sEVs promote H-NSC proliferation and neurogenesis in the SGZ in DM-tGCI/R mice. (A) IF staining of Sox2+ (Alexa Fluor 488, green) and GFAP+ (Alexa Fluor 594, red) in the hippocampus and (B) estimated numbers of Sox2+/GFAP+ cells. iMSC-sEVs improved the number of H-NSCs in DM mice suffering from tGCI/R injury. (C) IF staining of proliferative H-NSCs (EdU+, Alexa Fluor 594, red; Sox2+, Alexa Fluor 488, green) in the hippocampus and (D) estimated numbers of EdU+/Sox2+ cells Alexa. iMSC-sEVs promoted H-NSC proliferation in DM mice suffering from tGCI/R injury. (E) IF staining of hippocampal proliferative immature neurons (EdU+, Alexa Fluor 594, red; DCX+, Alexa Fluor 488, green) and (F, G) estimated numbers. iMSC-sEVs promoted hippocampal neurogenesis in DM mice suffering from tGCI/R injury. (H) IF staining of EdU incorporation in isolated H-NSCs and (I) quantification of EdU+/DAPI+ cells among DAPI+ cells. iMSC-sEVs promoted H-NSC proliferation in H-NSCs isolated from DM mice suffering from tGCI/R injury. (J) IF staining of neuronal differentiation in isolated H-NSCs and (K) quantification of β-III tubulin+/DAPI+ cells among DAPI+ cells. iMSC-sEVs promoted H-NSC neuronal differentiation in H-NSCs isolated from DM mice suffering from tGCI/R injury. Scale bars: 50 μm in A–C; 100 μm in D, E. All data presented as mean ± SEM (n = 6/group). *P < 0.05 (one-way analysis of variance followed by Bonferroni post hoc test). DCX: Doublecortin; DM: diabetes mellitus; EdU: 5-ethynyl-2'-deoxyuridine; GFAP: glial fibrillary acidic protein; H-NSCs: hippocampal neural stem cells; IF: immunofluorescence; (iMSC-)sEVs: induced pluripotent stem cell-derived mesenchymal stem cells-derived small extracellular vesicles; SGZ: subgranular zone; tGCI/R: transient global cerebral ischemia/reperfusion.CC BY-NC-SA · PubMed Central
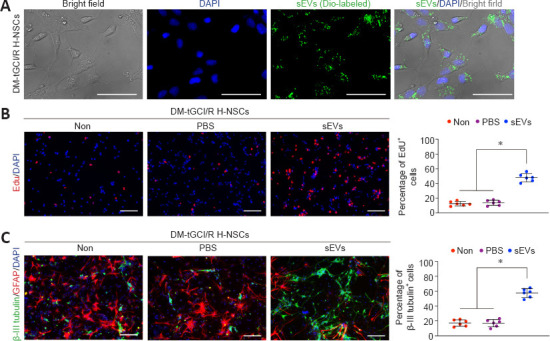
Figure 6 iMSC-sEVs promote H-NSC neurogenesis in vitro. (A) IF staining of DiO-labeled iMSC-sEVs (Alexa Fluor 488, green) internalized by DM-tGCI/R H-NSCs. (B) IF staining of EdU incorporation in DM-tGCI/R H-NSCs and quantification of EdU+ (Alexa Fluor 594, red) /DAPI+ cells among DAPI+ cells (n = 6/group). iMSC-sEVs promoted proliferation of H-NSCs isolated from DM mice suffering from tGCI/R injury. (C) IF staining of neuronal differentiation in DM-tGCI/R H-NSCs and quantification of β-III tubulin+ (Alexa Fluor 488, green)/DAPI+ cells among DAPI+ cells (n = 6/group). iMSC-sEVs promoted neuronal differentiation of H-NSCs isolated from DM mice suffering from tGCI/R injury. Scale bars: 50 μm in A; 100 μm in B, C. All data presented as mean ± SEM. *P < 0.05 (one-way analysis of variance followed by Bonferroni post hoc test). DM: diabetes mellitus; Edu: 5-ethynyl-2'-deoxyuridine; H-NSCs: hippocampal neural stem cells; IF: immunofluorescence; (iMSC-)sEVs: induced pluripotent stem cell-derived mesenchymal stem cells-derived small extracellular vesicles; tGCI/R: transient global cerebral ischemia/reperfusion.
Figure 6 iMSC-sEVs promote H-NSC neurogenesis in vitro. (A) IF staining of DiO-labeled iMSC-sEVs (Alexa Fluor 488, green) internalized by DM-tGCI/R H-NSCs. (B) IF staining of EdU incorporation in DM-tGCI/R H-NSCs and quantification of EdU+ (Alexa Fluor 594, red) /DAPI+ cells among DAPI+ cells (n = 6/group). iMSC-sEVs promoted proliferation of H-NSCs isolated from DM mice suffering from tGCI/R injury. (C) IF staining of neuronal differentiation in DM-tGCI/R H-NSCs and quantification of β-III tubulin+ (Alexa Fluor 488, green)/DAPI+ cells among DAPI+ cells (n = 6/group). iMSC-sEVs promoted neuronal differentiation of H-NSCs isolated from DM mice suffering from tGCI/R injury. Scale bars: 50 μm in A; 100 μm in B, C. All data presented as mean ± SEM. *P < 0.05 (one-way analysis of variance followed by Bonferroni post hoc test). DM: diabetes mellitus; Edu: 5-ethynyl-2'-deoxyuridine; H-NSCs: hippocampal neural stem cells; IF: immunofluorescence; (iMSC-)sEVs: induced pluripotent stem cell-derived mesenchymal stem cells-derived small extracellular vesicles; tGCI/R: transient global cerebral ischemia/reperfusion.CC BY-NC-SA · PubMed Central
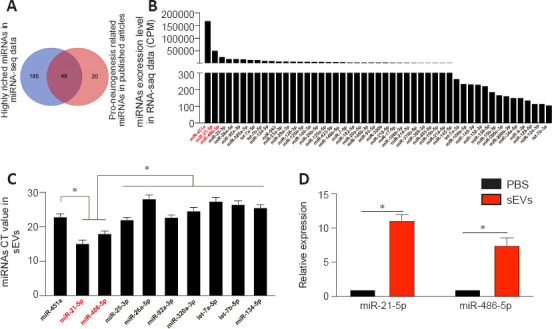
Figure 7 miRNA expression profile in iMSC-sEVs. (A) Comparison of highly enriched miRNAs in iMSC-sEVs and neurogenesis-promoting-related miRNAs in literature search. (B) Counts per million values of co-expressed miRNAs (n = 3). (C) Ct values of the 10 most highly expressed miRNAs were validated by qPCR (n = 3). Expression levels of miR-21-5p and miR-486-5p were significantly higher than those of the other miRNAs. (D) qPCR analysis and quantification of miR-21-5p and miR-486-5p in PBS- or iMSC-sEV-treated DM-tGCI/R H-NSCs (n = 3 per group). All data presented as mean ± SEM. *P < 0.05 (one-way analysis of variance followed by Bonferroni post hoc test). CPM: Counts per million; DM: diabetes mellitus; H-NSCs: hippocampal neural stem cells; (iMSC-)sEVs: induced pluripotent stem cell-derived mesenchymal stem cells-derived small extracellular vesicles; qPCR: real-time quantitative polymerase chain reaction analysis; tGCI/R: transient global cerebral ischemia/reperfusion.
Figure 7 miRNA expression profile in iMSC-sEVs. (A) Comparison of highly enriched miRNAs in iMSC-sEVs and neurogenesis-promoting-related miRNAs in literature search. (B) Counts per million values of co-expressed miRNAs (n = 3). (C) Ct values of the 10 most highly expressed miRNAs were validated by qPCR (n = 3). Expression levels of miR-21-5p and miR-486-5p were significantly higher than those of the other miRNAs. (D) qPCR analysis and quantification of miR-21-5p and miR-486-5p in PBS- or iMSC-sEV-treated DM-tGCI/R H-NSCs (n = 3 per group). All data presented as mean ± SEM. *P < 0.05 (one-way analysis of variance followed by Bonferroni post hoc test). CPM: Counts per million; DM: diabetes mellitus; H-NSCs: hippocampal neural stem cells; (iMSC-)sEVs: induced pluripotent stem cell-derived mesenchymal stem cells-derived small extracellular vesicles; qPCR: real-time quantitative polymerase chain reaction analysis; tGCI/R: transient global cerebral ischemia/reperfusion.CC BY-NC-SA · PubMed Central
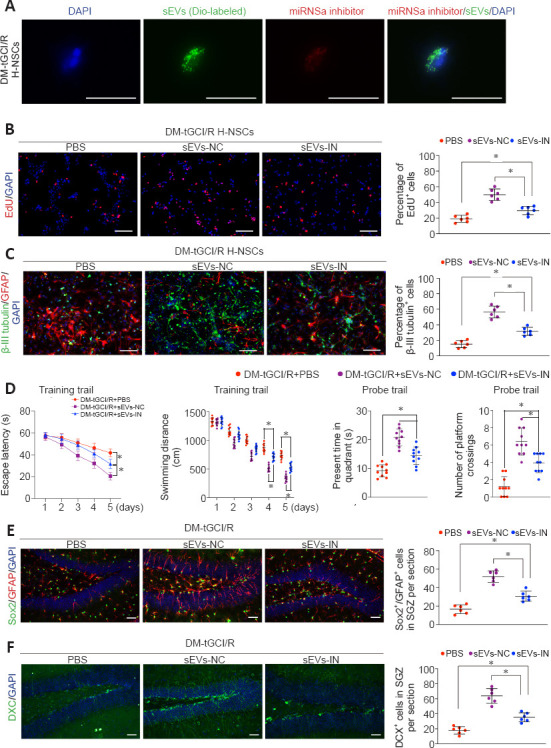
Figure 8 iMSC-sEVs transfer miR-21-5P and miR-486-5P to promote H-NSC proliferation and neuronal differentiation. (A) IF staining of DiO-labeled iMSC-sEVs (green) overlapped with Cy3-labeled miRNA inhibitors (red) internalized by H-NSCs isolated from DM-tGCI/R mice (n = 3). miRNA inhibitors were successfully loaded into iMSC-sEVs and transferred to DM-tGCI/R H-NSCs. (B) IF staining of EdU incorporation into isolated H-NSCs and quantification of EdU+/DAPI+ cells among DAPI+ cells (n = 6/group). The proliferation-promoting function of iMSC-sEVs on DM-tGCI/R H-NSCs was abolished when miR-21-5p and miR-486-5p were inhibited in iMSC-sEVs. (C) IF staining of neuronal differentiation in isolated H-NSCs and quantification of β-III tubulin+ (Alexa Fluor 488, green)/DAPI+ cells among DAPI+ cells (n = 6/group). The neuronal differentiation-promoting function of iMSC-sEVs on DM-tGCI/R H-NSCs was abolished when miR-21-5p and miR-486-5p were inhibited in iMSC-sEVs. (D) Spatial learning and memory abilities in DM-tGCI/R mice were tested by Morris water maze (n = 10/group). Spatial learning and memory abilities were damaged when miR-21-5p and miR-486-5p were inhibited in iMSC-sEVs. (E) IF staining of Sox2+ (Alexa Fluor 488, green) and GFAP+ (Alexa Fluor 594, red) in the hippocampus and estimated number sof Sox2+/GFAP+ cells (n = 6/group). The proliferation-promoting function of iMSC-sEVs on DM-tGCI/R H-NSCs was abolished when miR-21-5p and miR-486-5p were inhibited in iMSC-sEVs. (F) IF staining of hippocampal proliferative immature neurons (DCX+, Alexa Fluor 488, green) and estimated numbers (n = 6/group). The neuronal differentiation-promoting function of iMSC-sEVs on DM-tGCI/R H-NSCs was abolished when miR-21-5p and miR-486-5p were inhibited in iMSC-sEVs. Scale bars: 50 μm in A, E, F; 100 μm in B, C. All data presented as mean ± SEM. *P < 0.05 (one-way analysis of variance followed by Bonferroni post hoc test). DCX: Doublecortin; Dio: 3,3′-dioctadecyloxacarbocyanine perchlorate; DM: diabetes mellitus; Edu: 5-ethynyl-2'-deoxyuridine; GFAP: glial fibrillary acidic protein; H-NSCs: hippocampal neural stem cells; IF: immunofluorescence; (iMSC-)sEVs: induced pluripotent stem cell-derived mesenchymal stem cells-derived small extracellular vesicles; IN: inhibitor; miRNA: microRNA; NC: negative control; tGCI/R: transient global cerebral ischemia/reperfusion.
Figure 8 iMSC-sEVs transfer miR-21-5P and miR-486-5P to promote H-NSC proliferation and neuronal differentiation. (A) IF staining of DiO-labeled iMSC-sEVs (green) overlapped with Cy3-labeled miRNA inhibitors (red) internalized by H-NSCs isolated from DM-tGCI/R mice (n = 3). miRNA inhibitors were successfully loaded into iMSC-sEVs and transferred to DM-tGCI/R H-NSCs. (B) IF staining of EdU incorporation into isolated H-NSCs and quantification of EdU+/DAPI+ cells among DAPI+ cells (n = 6/group). The proliferation-promoting function of iMSC-sEVs on DM-tGCI/R H-NSCs was abolished when miR-21-5p and miR-486-5p were inhibited in iMSC-sEVs. (C) IF staining of neuronal differentiation in isolated H-NSCs and quantification of β-III tubulin+ (Alexa Fluor 488, green)/DAPI+ cells among DAPI+ cells (n = 6/group). The neuronal differentiation-promoting function of iMSC-sEVs on DM-tGCI/R H-NSCs was abolished when miR-21-5p and miR-486-5p were inhibited in iMSC-sEVs. (D) Spatial learning and memory abilities in DM-tGCI/R mice were tested by Morris water maze (n = 10/group). Spatial learning and memory abilities were damaged when miR-21-5p and miR-486-5p were inhibited in iMSC-sEVs. (E) IF staining of Sox2+ (Alexa Fluor 488, green) and GFAP+ (Alexa Fluor 594, red) in the hippocampus and estimated number sof Sox2+/GFAP+ cells (n = 6/group). The proliferation-promoting function of iMSC-sEVs on DM-tGCI/R H-NSCs was abolished when miR-21-5p and miR-486-5p were inhibited in iMSC-sEVs. (F) IF staining of hippocampal proliferative immature neurons (DCX+, Alexa Fluor 488, green) and estimated numbers (n = 6/group). The neuronal differentiation-promoting function of iMSC-sEVs on DM-tGCI/R H-NSCs was abolished when miR-21-5p and miR-486-5p were inhibited in iMSC-sEVs. Scale bars: 50 μm in A, E, F; 100 μm in B, C. All data presented as mean ± SEM. *P < 0.05 (one-way analysis of variance followed by Bonferroni post hoc test). DCX: Doublecortin; Dio: 3,3′-dioctadecyloxacarbocyanine perchlorate; DM: diabetes mellitus; Edu: 5-ethynyl-2'-deoxyuridine; GFAP: glial fibrillary acidic protein; H-NSCs: hippocampal neural stem cells; IF: immunofluorescence; (iMSC-)sEVs: induced pluripotent stem cell-derived mesenchymal stem cells-derived small extracellular vesicles; IN: inhibitor; miRNA: microRNA; NC: negative control; tGCI/R: transient global cerebral ischemia/reperfusion.CC BY-NC-SA · PubMed Central
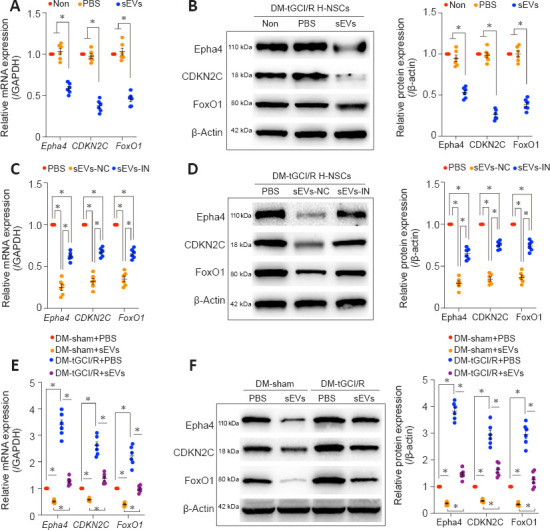
Figure 9 iMSC-sEVs transfer miRNAs to inhibit Epha4, CDKN2C, and FoxO1 to promote hippocampal neurogenesis in DM-tGCI/R mice. (A) qPCR and (B) western blot analyses of Epha4, CDKN2C, and FoxO1 in DM-tGCI/R H-NSCs. Administration of sEVs significantly decreased gene and protein expression levels of Epha4, CDKN2C, and FoxO1. (C) qPCR and (D) western blot analyses of Epha4, CDKN2C, and FoxO1 in DM-tGCI/R H-NSCs from PBS, sEVs-NC, and sEVs-IN groups. The inhibitory effects of iMSC-sEVs on Epha4, CDKN2C, and FoxO1 in DM-tGCI/R H-NSCs were largely abolished when miR-21-5p and miR-486-5p were inhibited in iMSC-sEVs. (E) qPCR and (F) western blot analyses of Epha4, CDKN2C, and FoxO1 in H-NSCs isolated from DM-tGCI/R mice. Administration of sEVs significantly decreased gene and protein expression levels of Epha4, CDKN2C, and FoxO1 in H-NSCs isolated from DM-tGCI/R mice. All data presented as mean ± SEM (n = 6/group). *P < 0.05 (one-way analysis of variance followed by Bonferroni post hoc test). CDKN2C: Cyclin-dependent kinase inhibitor 2C; DM: diabetes mellitus; Epha4: Eph receptor A4, FoxO1: forkhead box O1; H-NSCs: hippocampal neural stem cells; IF: immunofluorescence; (iMSC-)sEVs: induced pluripotent stem cell-derived mesenchymal stem cells-derived small extracellular vesicles; IN: inhibitor; miRNA: microRNA; NC: negative control; PBS: phosphate buffer saline; qPCR: real-time quantitative polymerase chain reaction analysis; tGCI/R: transient global cerebral ischemia/reperfusion.
Figure 9 iMSC-sEVs transfer miRNAs to inhibit Epha4, CDKN2C, and FoxO1 to promote hippocampal neurogenesis in DM-tGCI/R mice. (A) qPCR and (B) western blot analyses of Epha4, CDKN2C, and FoxO1 in DM-tGCI/R H-NSCs. Administration of sEVs significantly decreased gene and protein expression levels of Epha4, CDKN2C, and FoxO1. (C) qPCR and (D) western blot analyses of Epha4, CDKN2C, and FoxO1 in DM-tGCI/R H-NSCs from PBS, sEVs-NC, and sEVs-IN groups. The inhibitory effects of iMSC-sEVs on Epha4, CDKN2C, and FoxO1 in DM-tGCI/R H-NSCs were largely abolished when miR-21-5p and miR-486-5p were inhibited in iMSC-sEVs. (E) qPCR and (F) western blot analyses of Epha4, CDKN2C, and FoxO1 in H-NSCs isolated from DM-tGCI/R mice. Administration of sEVs significantly decreased gene and protein expression levels of Epha4, CDKN2C, and FoxO1 in H-NSCs isolated from DM-tGCI/R mice. All data presented as mean ± SEM (n = 6/group). *P < 0.05 (one-way analysis of variance followed by Bonferroni post hoc test). CDKN2C: Cyclin-dependent kinase inhibitor 2C; DM: diabetes mellitus; Epha4: Eph receptor A4, FoxO1: forkhead box O1; H-NSCs: hippocampal neural stem cells; IF: immunofluorescence; (iMSC-)sEVs: induced pluripotent stem cell-derived mesenchymal stem cells-derived small extracellular vesicles; IN: inhibitor; miRNA: microRNA; NC: negative control; PBS: phosphate buffer saline; qPCR: real-time quantitative polymerase chain reaction analysis; tGCI/R: transient global cerebral ischemia/reperfusion.CC BY-NC-SA · PubMed Central

Verification

Claims the paper makes

The claims and statistics of this paper haven’t been checked yet.

Run the check — free, no account needed. It reads the open-access text and checks the sources it cites.

A few free checks a day · papers already verified open instantly · results are public

Claims other papers make about this one

Each is checked against this paper’s own text: does it say what the citing paper says it does?

Self-check

Percentages, sums and reported differences re-computed from the paper’s own numbers.

The self-check needs the paper’s full text.

Citations

Cites

Show all 56 references

Research works printed but not linked: 1

  1. Zhang, 2022, Novel nano-delivery system:engineered small extracellular vesicles, Zhongguo Zuzhi Gongcheng Yanjiu, 26, 4417

Cited by

Metadata

Authors
Lang, H.-L., Zhao, Y.-Z., Xiao, R.-J., Sun, J., Chen, Y., Hu, G.-W., & Xu, G.-H.
Affiliations
  • Department of Anesthesiology, The Second Affiliated Hospital of Nanchang University, Nanchang, Jiangxi Province, China
  • The First Clinical Medical College of Nanchang University, Nanchang, Jiangxi Province, China
  • Department of Neurosurgery, The Second Affiliated Hospital of Nanchang University, Nanchang, Jiangxi Province, China
Venue
Neural Regeneration Research
Published
2022-08-02
Volume
18
Issue
3
Pages
609-617
ISSN
  • 1673-5374
  • 1876-7958
Cited by
33
References
56
Language
en

About these checks

Registry, retraction, Cites and statistics results are computed, not judged, with one exception: a printed reference that no index lists is read once by a model before it counts as a citation error. Claims are extracted by a model and kept only when their quote appears verbatim in the text; each cited source is then checked, with a model’s help, for whether it says what the claim relies on. Those verdicts can be wrong — read the claim’s quote and the cited source before relying on one.

Statistics and arithmetic are recomputed, not judged.

Confidence bands are shown only for fields calibrated on our annotated test set. None is calibrated yet, so no band is shown.

What counts as a claim ›How we measure confidence ›How we check this ›

Are you an author, or do you see a problem with this page? Request a review

Data sources

Bibliographic data: Semantic Scholar, OpenAlex, Crossref.

Contains information from the Semantic Scholar Academic Graph Datasets, made available under the ODC Attribution License (ODC-BY 1.0).

Semantic Scholar’s data is described in: Kinney, R., et al. (2023). The Semantic Scholar Open Data Platform. arXiv:2301.10140.