

The DOI matches its Crossref record; 51 of the 51 references it cites were found in a registry or an index.
Multi-Field-of-View Deep Learning Model Predicts Nonsmall Cell Lung Cancer Programmed Death-Ligand 1 Status from Whole-Slide Hematoxylin and Eosin Images
Open accessAbstract
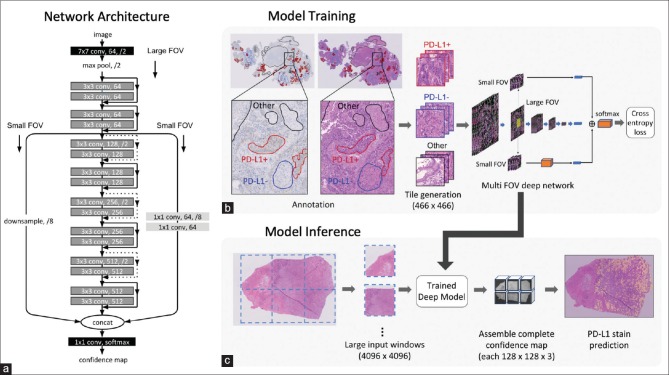
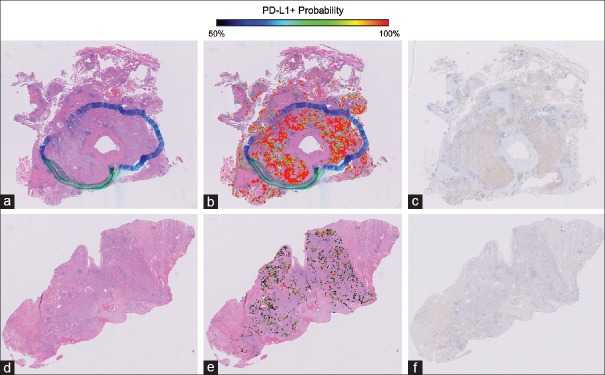
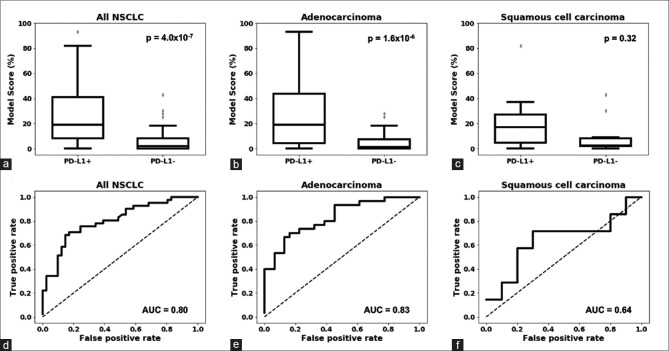
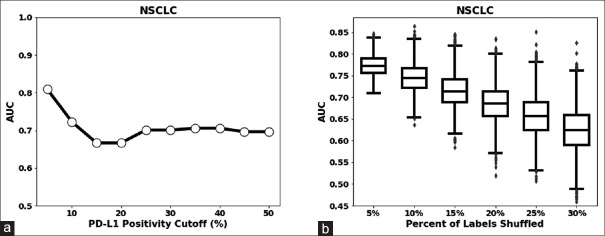
Background: Tumor programmed death-ligand 1 (PD-L1) status is useful in determining which patients may benefit from programmed death-1 (PD-1)/PD-L1 inhibitors. However, little is known about the association between PD-L1 status and tumor histopathological patterns. Using deep learning, we predicted PD-L1 status from hematoxylin and eosin (H and E) whole-slide images (WSIs) of nonsmall cell lung cancer (NSCLC) tumor samples. Materials and Methods: One hundred and thirty NSCLC patients were randomly assigned to training (n = 48) or test (n = 82) cohorts. A pair of H and E and PD-L1-immunostained WSIs was obtained for each patient. A pathologist annotated PD-L1 positive and negative tumor regions on the training samples using immunostained WSIs for reference. From the H and E WSIs, over 145,000 training tiles were generated and used to train a multi-field-of-view deep learning model with a residual neural network backbone. Results: The trained model accurately predicted tumor PD-L1 status on the held-out test cohort of H and E WSIs, which was balanced for PD-L1 status (area under the receiver operating characteristic curve [AUC] =0.80, P<< 0.01). The model remained effective over a range of PD-L1 cutoff thresholds (AUC = 0.67-0.81, P ≤ 0.01) and when different proportions of the labels were randomly shuffled to simulate interpathologist disagreement (AUC = 0.63-0.77, P ≤ 0.03). Conclusions: A robust deep learning model was developed to predict tumor PD-L1 status from H and E WSIs in NSCLC. These results suggest that PD-L1 expression is correlated with the morphological features of the tumor microenvironment.
Overview
The claims and statistics of this paper haven’t been checked yet.
Run the check — free, no account needed. It reads the open-access text and checks the sources it cites.
Integrity signals
Registry
Cites
Statistics
Figures
Verification
Claims the paper makes
The claims and statistics of this paper haven’t been checked yet.
Run the check — free, no account needed. It reads the open-access text and checks the sources it cites.
Claims other papers make about this one
Each is checked against this paper’s own text: does it say what the citing paper says it does?
The source backs part of the claim, not all of it — or backs it for a different population, condition or comparison.
In the citing paper
“While numerous deep learning studies have emerged for predicting ICI responses in NSCLC from H&E images, they are primarily focused on refining PD-L1 quantification56–58.”
From Predicting the tumor microenvironment composition and immunotherapy response in non-small cell lung cancer from digital histopathology images (2024) · cites this paper as [57]
Experimental — accuracy not yet measuredIn the citing paper
“Numerous studies have demonstrated the potential for using AI to predict immunotherapy biomarkers from H&E images of patients with NSCLC, including tumor mutation burden (TMB; ref. 76), PD-L1 expression (105), and TILs (106, 107).”
From Artificial Intelligence in Oncology: Current Landscape, Challenges, and Future Directions (2024) · cites this paper as [105]
Self-check
Percentages, sums and reported differences re-computed from the paper’s own numbers.
The self-check needs the paper’s full text.
Citations
Cites
Very Deep Convolutional Networks for Large-Scale Image Recognition
Simonyan, K., & Zisserman, A. (2014) · arXiv · doi:10.48550/arxiv.1409.1556 · Cited by 114,148
Bray, F., Ferlay, J., Soerjomataram, I., Siegel, R. L., Torre, L. A., & Jemal, A. (2018) · CA: A Cancer Journal for Clinicians · doi:10.3322/caac.21492 · Cited by 84,109
PD-1 and PD-L1 Immune Checkpoint Blockade to Treat Breast Cancer
Hartkopf, A. D., Taran, F., Wallwiener, M., Walter, C. B., Krämer, B., Grischke, E., & Brucker, S. Y. (2016) · Breast Care · doi:10.1159/000453569 · Cited by 30,989
Batch Normalization: Accelerating Deep Network Training by Reducing Internal Covariate Shift
Ioffe, S., & Szegedy, C. (2015) · arXiv · doi:10.48550/arxiv.1502.03167 · Cited by 27,818
Deep learning in neural networks: an overview
Schmidhuber, J. (2015) · Neural Networks · doi:10.1016/j.neunet.2014.09.003 · Cited by 18,570
A survey on deep learning in medical image analysis
Litjens, G., Kooi, T., Bejnordi, B. E., Setio, A. A. A., Ciompi, F., Ghafoorian, M., van der Laak, J. A. W. M., van Ginneken, B., & Sánchez, C. I. (2017) · Medical Image Analysis · doi:10.1016/j.media.2017.07.005 · Cited by 15,332
Adverse Renal Effects of Immune Checkpoint Inhibitors: A Narrative Review
Wanchoo, R., Karam, S., Uppal, N. N., Barta, V. S., Deray, G., Devoe, C., Launay‐Vacher, V., Jhaveri, K. D., & on behalf of Cancer and Kidney International Network Workgroup on Immune Checkpoint Inhibitors (2017) · American Journal of Nephrology · doi:10.1159/000455014 · Cited by 15,320
Nivolumab versus docetaxel in advanced nonsquamous non-small-cell lung cancer
Borghaei, H., Paz-Ares, L., Horn, L., Spigel, D. R., Steins, M., Ready, N. E., Chow, L. Q., Vokes, E. E., Felip, E., Holgado, E., et al. (2015) · New England Journal of Medicine · doi:10.1056/nejmoa1507643 · Cited by 9,335
QuPath: Open source software for digital pathology image analysis
Bankhead, P., Loughrey, M. B., Fernández, J. A., Dombrowski, Y., McArt, D. G., Dunne, P. D., McQuaid, S., Gray, R. T., Murray, L. J., Coleman, H. G., et al. (2017) · Scientific Reports · doi:10.1038/s41598-017-17204-5 · Cited by 8,908
Safety and activity of anti-PD-L1 antibody in patients with advanced cancer
Brahmer, J. R., Tykodi, S. S., Chow, L. Q. M., Hwu, W.-J., Topalian, S. L., Hwu, P., Drake, C. G., Camacho, L. H., Kauh, J., Odunsi, K., et al. (2012) · New England Journal of Medicine · doi:10.1056/nejmoa1200694 · Cited by 7,945 · cited 2×
“[8-10] Anti-PD-1 and anti-PD-L1 antibodies restore antitumor immune response by disrupting the interaction between PD-1 and PD-L1.”
BackgroundHerbst, R. S., Baas, P., Kim, D.-W., Felip, E., Pérez-Gracia, J. L., Han, J.-Y., Molina, J., Kim, J.-H., Arvis, C. D., Ahn, M.-J., et al. (2016) · The Lancet · doi:10.1016/s0140-6736(15)01281-7 · Cited by 6,449
Predictive correlates of response to the anti-PD-L1 antibody MPDL3280A in cancer patients
Herbst, R. S., Soria, J.-C., Kowanetz, M., Fine, G. D., Hamid, O., Gordon, M. S., Sosman, J. A., McDermott, D. F., Powderly, J. D., Gettinger, S. N., et al. (2014) · Nature · doi:10.1038/nature14011 · Cited by 5,231
Deep Residual Learning for Image Recognition
He, K., Zhang, X., Ren, S., & Sun, J. (2015) · arXiv · doi:10.48550/arxiv.1512.03385 · Cited by 4,196
Ehteshami Bejnordi, B., Veta, M., Johannes van Diest, P., van Ginneken, B., Karssemeijer, N., Litjens, G., van der Laak, J. A. W. M., and the CAMELYON16 Consortium, Hermsen, M., Manson, Q. F., et al. (2017) · JAMA · doi:10.1001/jama.2017.14585 · Cited by 3,293
Coudray, N., Ocampo, P. S., Sakellaropoulos, T., Narula, N., Snuderl, M., Fenyö, D., Moreira, A. L., Razavian, N., & Tsirigos, A. (2018) · Nature Medicine · doi:10.1038/s41591-018-0177-5 · Cited by 2,930
PD-L1 expression as a predictive biomarker in cancer immunotherapy
Patel, S. P., & Kurzrock, R. (2015) · Molecular Cancer Therapeutics · doi:10.1158/1535-7163.mct-14-0983 · Cited by 2,291
Classifying Cancers Based on T-cell Infiltration and PD-L1
Teng, M. W. L., Ngiow, S. F., Ribas, A., & Smyth, M. J. (2015) · Cancer Research · doi:10.1158/0008-5472.can-15-0255 · Cited by 1,436
Predicting cancer outcomes from histology and genomics using convolutional networks
Mobadersany, P., Yousefi, S., Amgad, M., Gutman, D. A., Barnholtz-Sloan, J. S., Velázquez Vega, J. E., Brat, D. J., & Cooper, L. A. D. (2018) · Proceedings of the National Academy of Sciences · doi:10.1073/pnas.1717139115 · Cited by 1,084
Tissue Processing and Hematoxylin and Eosin Staining
Feldman, A. T., & Wolfe, D. (2014) · Methods in molecular biology · doi:10.1007/978-1-4939-1050-2_3 · Cited by 1,071
Deep learning as a tool for increased accuracy and efficiency of histopathological diagnosis
Litjens, G., Sánchez, C. I., Timofeeva, N., Hermsen, M., Nagtegaal, I., Kovacs, I., Hulsbergen - van de Kaa, C., Bult, P., van Ginneken, B., & van der Laak, J. (2016) · Scientific Reports · doi:10.1038/srep26286 · Cited by 1,069
Manual Hematoxylin and Eosin Staining of Mouse Tissue SectionsPreprint
Cardiff, R. D., Miller, C. H., & Munn, R. J. (2014) · Cold Spring Harbor Protocols · doi:10.1101/pdb.prot073411 · Cited by 926
Quantitative Assessment of the Heterogeneity of PD-L1 Expression in Non–Small-Cell Lung Cancer
McLaughlin, J. F., Han, G., Schalper, K. A., Carvajal‐Hausdorf, D., Pelekanou, V., Rehman, J., Velcheti, V., Herbst, R. S., LoRusso, P. M., & Rimm, D. L. (2015) · JAMA Oncology · doi:10.1001/jamaoncol.2015.3638 · Cited by 845
Structure-Preserving Color Normalization and Sparse Stain Separation for Histological Images
Vahadane, A., Peng, T., Sethi, A., Albarqouni, S., Wang, L., Baust, M., Steiger, K., Schlitter, A. M., Esposito, I., & Navab, N. (2016) · IEEE Transactions on Medical Imaging · doi:10.1109/tmi.2016.2529665 · Cited by 833
Rimm, D. L., Han, G., Taube, J. M., Yi, E. S., Bridge, J. A., Flieder, D. B., Homer, R., West, W. W., Wu, H., Roden, A. C., et al. (2017) · JAMA Oncology · doi:10.1001/jamaoncol.2017.0013 · Cited by 764
Programmed death ligand-1 expression in non-small cell lung cancer
Velcheti, V., Schalper, K. A., Carvajal, D. E., Anagnostou, V., Syrigos, K. N., Sznol, M., Herbst, R. S., Gettinger, S. N., Chen, L., & Rimm, D. L. (2013) · Laboratory Investigation · doi:10.1038/labinvest.2013.130 · Cited by 758
Pantanowitz, L., Sinard, J. H., Henricks, W. H., Fatheree, L. A., Carter, A. B., Contis, L. C., Beckwith, B. A., Evans, A. J., Lal, A., & Parwani, A. V. (2013) · Archives of Pathology & Laboratory Medicine · doi:10.5858/arpa.2013-0093-cp · Cited by 622
PD-1 and PD-L1 expression in molecularly selected non-small-cell lung cancer patients
D’Incecco, A., Andreozzi, M., Ludovini, V., Rossi, E., Capodanno, A., Landi, L. M., Tibaldi, C., Minuti, G., Salvini, J., Coppi, E., et al. (2014) · British Journal of Cancer · doi:10.1038/bjc.2014.555 · Cited by 602
ImageNet Large Scale Visual Recognition Challenge
Russakovsky, O., Deng, J., Su, H., Krause, J., Satheesh, S., Ma, S., Huang, Z., Karpathy, A., Khosla, A., Bernstein, M., et al. (2014) · arXiv · doi:10.48550/arxiv.1409.0575 · Cited by 567
Kazandjian, D. G., Suzman, D. L., Blumenthal, G. M., Mushti, S. L., He, K., Libeg, M., Keegan, P., & Pazdur, R. (2016) · The Oncologist · doi:10.1634/theoncologist.2015-0507 · Cited by 489
Chemotherapy, chemoresistance and the changing treatment landscape for NSCLC
Chang, A. Y. (2010) · Lung Cancer · doi:10.1016/j.lungcan.2010.08.022 · Cited by 444
Predictive biomarkers in PD-1/PD-L1 checkpoint blockade immunotherapy
Meng, X., Huang, Z., Teng, F., Xing, L., & Yu, J. (2015) · Cancer Treatment Reviews · doi:10.1016/j.ctrv.2015.11.001 · Cited by 407
Wimberly, H., Brown, J. R., Schalper, K. A., Haack, H., Silver, M. R., Nixon, C., Bossuyt, V., Pusztai, L., Lannin, D. R., & Rimm, D. L. (2014) · Cancer Immunology Research · doi:10.1158/2326-6066.cir-14-0133 · Cited by 403
Büttner, R., Gosney, J. R., Skov, B. G., Adam, J., Motoi, N., Bloom, K. J., Dietel, M., Longshore, J. W., López‐Ríos, F., Penault-Llorca, F. M., et al. (2017) · Journal of Clinical Oncology · doi:10.1200/jco.2017.74.7642 · Cited by 398
Sul, J., Blumenthal, G. M., Jiang, X., He, K., Keegan, P., & Pazdur, R. (2016) · The Oncologist · doi:10.1634/theoncologist.2015-0498 · Cited by 364
Roach, C. M., Zhang, N., Corigliano, E., Jansson, M., Toland, G., Ponto, G., Dolled-Filhart, M. P., Emancipator, K., Stanforth, D., & Kulangara, K. (2016) · Applied immunohistochemistry & molecular morphology · doi:10.1097/pai.0000000000000408 · Cited by 345
Couture, H. D., Williams, L. A., Geradts, J., Nyante, S. J., Butler, E. N., Marron, J. S., Perou, C. M., Troester, M. A., & Niethammer, M. (2018) · npj Breast Cancer · doi:10.1038/s41523-018-0079-1 · Cited by 327
Ratcliffe, M., Sharpe, A. D., Midha, A., Barker, C., Scott, M. L. J., Scorer, P., Al‐Masri, H., Rebelatto, M. C., & Walker, J. (2017) · Clinical Cancer Research · doi:10.1158/1078-0432.ccr-16-2375 · Cited by 303
Stain Specific Standardization of Whole-Slide Histopathological Images
Bejnordi, B. E., Litjens, G. J. S., Timofeeva, N., Otte‐Höller, I., Homeyer, A., Karssemeijer, N., & van der Laak, J. A. W. M. (2015) · IEEE Transactions on Medical Imaging · doi:10.1109/tmi.2015.2476509 · Cited by 291
Denkert, C., Wienert, S., Poterie, A., Loibl, S., Budczies, J., Badve, S., Bagó-Horváth, Z., Bane, A. L., Bedri, S. A., Brock, J. E., et al. (2016) · Modern Pathology · doi:10.1038/modpathol.2016.109 · Cited by 285
Nivolumab in NSCLC: latest evidence and clinical potential
Sundar, R., Cho, B. C., Brahmer, J. R., & Soo, R. A. (2015) · Therapeutic Advances in Medical Oncology · doi:10.1177/1758834014567470 · Cited by 234
Vassilakopoulou, M., Avgeris, M., Velcheti, V., Kotoula, V., Rampias, T., Chatzopoulos, K., Perisanidis, C., Kontos, C. K., Giotakis, A. Ι., Scorilas, A., et al. (2015) · Clinical Cancer Research · doi:10.1158/1078-0432.ccr-15-1543 · Cited by 218
Gertych, A., Świderska-Chadaj, Ż., Ma, Z., Ing, N., Markiewicz, T., Cierniak, S., Salemi, H., Guzman, S. J., Walts, A. E., & Knudsen, B. S. (2019) · Scientific Reports · doi:10.1038/s41598-018-37638-9 · Cited by 189
Kitano, A., Ono, M., Yoshida, M., Noguchi, E., Shimomura, A., Shimoi, T., Kodaira, M., Yunokawa, M., Yonemori, K., Shimizu, C., et al. (2017) · ESMO Open · doi:10.1136/esmoopen-2016-000150 · Cited by 158
Programmed Death Ligand-1 Immunohistochemistry: Friend or Foe?
Kerr, K. M., & Hirsch, F. R. (2016) · Archives of Pathology & Laboratory Medicine · doi:10.5858/arpa.2015-0522-sa · Cited by 135
Abdel-Rahman, O. M. (2016) · Critical Reviews in Oncology/Hematology · doi:10.1016/j.critrevonc.2016.03.007 · Cited by 124
PD-L1 expression in squamous-cell carcinoma and adenocarcinoma of the lung
Janžič, U., Kern, I., Janžič, A., Čavka, L., & Čufer, T. (2017) · Radiology and Oncology · doi:10.1515/raon-2017-0037 · Cited by 54
Pathology services in developing countries-the West African experience.
Adeyi, O. A. (2011) · PubMed · doi:10.5858/2008-0432-ccr.1 · Cited by 49
O'Rourke, N., & Macbeth, F. R. (2010) · Clinical Oncology · doi:10.1016/j.clon.2010.03.007 · Cited by 40
Garg, S., Gielda, B. T., Kiel, K. D., Turian, J. V., Fidler, M. J., Batus, M., Bonomi, P., & Sher, D. J. (2014) · Practical Radiation Oncology · doi:10.1016/j.prro.2013.12.002 · Cited by 34
Patel, K. T., Strother, R. M., Ndiangui, F., Chumba, D., Jacobson, W., Dodson, C., Resnic, M. B., Strate, R. W., & Smith, J. W. (2016) · African Journal of Laboratory Medicine · doi:10.4102/ajlm.v5i1.187 · Cited by 19
Baas, P., Garon, E. B., Herbst, R. S., Felip, E., Perez‐Gracia, J. L., Han, J., Molina, J. R., Kim, J.-H., Arvis, C. D., Ahn, M., et al. (2016) · Journal of Clinical Oncology · doi:10.1200/jco.2016.34.15_suppl.9015 · Cited by 14
Research works printed but not linked: 1
- Schaumberg, 2018, H and E-stained Whole Slide Image Deep Learning Predicts SPOP Mutation State in Prostate Cancer, bioRxiv, 064279
Cited by
Sorted by citations
Deep learning in histopathology: the path to the clinic
van der Laak, J., Litjens, G., & Ciompi, F. (2021) · Nature Medicine · doi:10.1038/s41591-021-01343-4 · Cited by 902
Deep learning in cancer pathology: a new generation of clinical biomarkers
Echle, A., Rindtorff, N. T., Brinker, T. J., Luedde, T., Pearson, A. T., & Kather, J. N. (2021) · British Journal of Cancer · doi:10.1038/s41416-020-01122-x · Cited by 667
Pan-cancer image-based detection of clinically actionable genetic alterations
Kather, J. N., Heij, L. R., Grabsch, H. I., Loeffler, C. M. L., Echle, A., Muti, H. S., Krause, J., Niehues, J., Sommer, K. A. J., Bankhead, P., et al. (2020) · Nature Cancer · doi:10.1038/s43018-020-0087-6 · Cited by 686
Emerging role of deep learning‐based artificial intelligence in tumor pathology
Jiang, Y., Yang, M., Wang, S., Li, X., & Sun, Y. K. (2020) · 癌症:英文版 · doi:10.1002/cac2.12012 · Cited by 460
Artificial Intelligence in Lung Cancer Pathology Image Analysis
Wang, S., Yang, D. M., Rong, R., Zhan, X., Fujimoto, J., Liu, H., Minna, J. D., Wistuba, I. I., Xie, Y., & Xiao, G. (2019) · Cancers · doi:10.3390/cancers11111673 · Cited by 296
Metadata
- Authors
- Sha, L., Osinski, B. L., Ho, I. Y., Tan, T. L., Willis, C., Weiss, H., Beaubier, N., Mahon, B. M., Taxter, T. J., & Yip, S. S. F.
- Affiliations
- Tempus Labs (United States) (US)
- Northwestern University (US)
- Corresponding author
- Yip, Stephen S. F
- Venue
- Journal of Pathology Informatics
- Publisher
- Elsevier BV
- Published
- 2019-01
- Volume
- 10
- Issue
- 1
- Pages
- 24
- ISSN
- 2153-3539 (ISSN-L)
- PMC
- PMC6669997
- OpenAlex
- W2963652908
- Cited by
- 130
- References
- 48
- Citations by year
- 2026: 9 · 2025: 21 · 2024: 25 · 2023: 13 · 2022: 27 · 2021: 16 · 2020: 18 · 2019: 1
- FWCI
- 7.30
- Type
- journal article
- Language
- en
- Open access
- gold
- doi.org
- Licence
- Locations
- Journal of Pathology Informatics (publishedVersion, cc-by-nc-sa)
- PubMed Central (publishedVersion, cc-by-nc-sa)
- PubMed (publishedVersion)
- DOAJ (DOAJ: Directory of Open Access Journals) (submittedVersion)
- Topics
- Physical Sciences › Computer Science › Artificial Intelligence › AI in cancer detection
- Health Sciences › Medicine › Radiology, Nuclear Medicine and Imaging › Radiomics and Machine Learning in Medical Imaging
- Health Sciences › Medicine › Oncology › Cancer Immunotherapy and Biomarkers
- Keywords
- non-small cell lung cancer, PD-L1 expression, whole slide images, H&E staining, deep learning, ResNet, tumor microenvironment, immunohistochemistry, PD-1/PD-L1 inhibitors, histopathological features
About these checks
Registry, retraction, Cites and statistics results are computed, not judged, with one exception: a printed reference that no index lists is read once by a model before it counts as a citation error. Claims are extracted by a model and kept only when their quote appears verbatim in the text; each cited source is then checked, with a model’s help, for whether it says what the claim relies on. Those verdicts can be wrong — read the claim’s quote and the cited source before relying on one.
Statistics and arithmetic are recomputed, not judged.
Confidence bands are shown only for fields calibrated on our annotated test set. None is calibrated yet, so no band is shown.
What counts as a claim ›How we measure confidence ›How we check this ›
Are you an author, or do you see a problem with this page? Request a review
