Cited by 86

The DOI matches its Crossref record; 6 of the 6 references it cites were found in a registry or an index.

Autophagy fosters myofibroblast differentiation through MTORC2 activation and downstream upregulation of CTGF

Bernard, Monique, Dieudé, Mélanie, Yang, Bing, Hamelin, Katia, Underwood, Katy, Hébert, Marie-Josée·2014·Autophagy

Overview

The claims and statistics of this paper haven’t been checked yet.

Run the check — free, no account needed. It reads the open-access text and checks the sources it cites.

A few free checks a day · papers already verified open instantly · results are public

Integrity signals

Registry

Crossref · 10.4161/15548627.2014.981786

Cites

6 of 6 references verified0 citation errors · 0 not checkable

Statistics

Figures

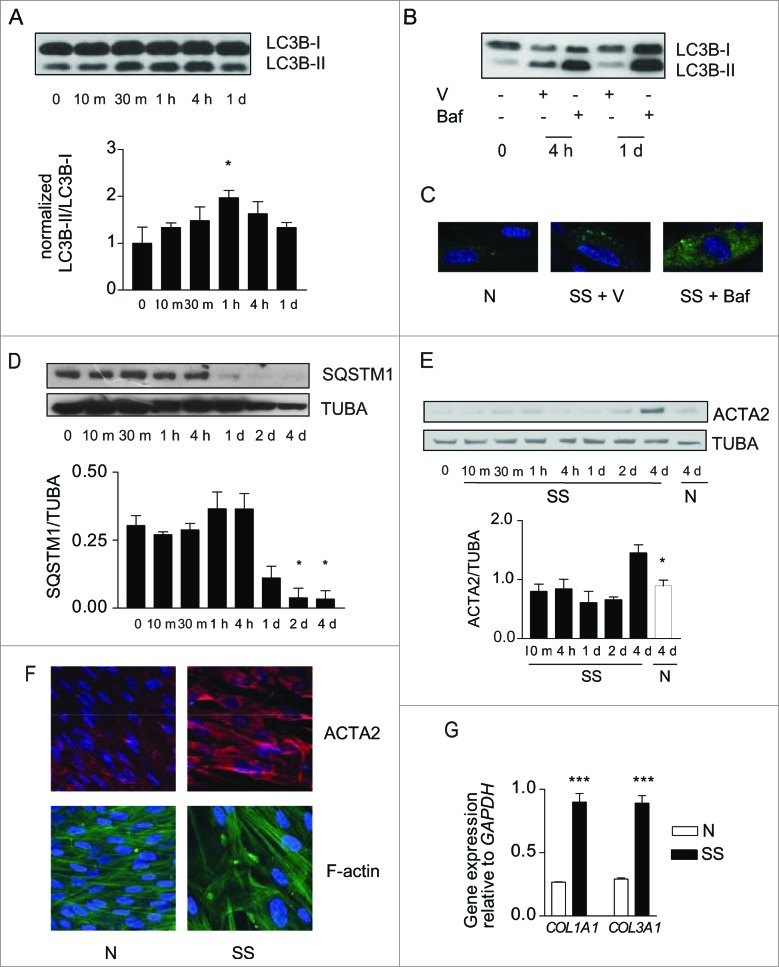
Figure 1. (See previous page). Starvation induces autophagy and myofibroblast differentiation. (A) Upper panel: Western blot showing LC3B-I and -II protein levels in WI-38 fibroblasts exposed to serum-free (starvation) medium (SS). Lower panel: Densitometric analysis of LC3B-II relative to LC3B-I normalized to time 0 (representative of 4 independent experiments, *P < 0.05 t = 0 vs 1 h). (B) Western blot showing LC3B-I and -II protein levels in WI-38 fibroblasts at baseline, starved for 4 h or 1 d and exposed to DMSO (V) or bafilomycin A1 (20 nM; Baf). Representative of 3 independent experiments. (C) Evaluation of LC3B puncta by confocal microscopy in WI-38 fibroblasts infected with a baculovirus vector expressing GFP-LC3B and exposed to normal conditions (medium with 10% FBS; N), serum-free medium with DMSO (V) or serum-free medium with bafilomycin A1 (20 nM) for 1 d. Representative of 3 independent experiments. (D) Upper panel: Western blot showing SQSTM1 and tubulin (TUBA) protein levels in starved WI-38 fibroblasts. Lower panel: Densitometric analysis of SQSTM1 protein levels relative to tubulin. Data are presented as mean ± s.e.m. (representative of 4 independent experiments, *p = 0.02 4 h vs 2 d and 4 h vs 4 d). (E) Upper panel: Western blot showing ACTA2 protein levels in WI-38 fibroblasts exposed to SS medium or grown under normal conditions (N). Tubulin was used as a loading control. Lower panel: Densitometric analysis of ACTA2 protein levels relative to tubulin normalized to time 0 (representative of 4 independent experiments; *p = 0.0170 SS vs N at 4 d). (F) Evaluation of the myofibroblast markers ACTA2 (red) and stress fiber (green) by immunofluorescence microscopy in cells grown in normal medium (N) or maintained without serum (SS) for 4 d. Representative of 3 independent experiments. (G) Real-time qPCR evaluation of mRNA levels of COL1A1 and COL3A1 after 4 d in N or SS. GAPDH was used as the reference gene (***P < 0.001 N vs SS, representative of 2 independent experiments performed in triplicate).
Figure 1. (See previous page). Starvation induces autophagy and myofibroblast differentiation. (A) Upper panel: Western blot showing LC3B-I and -II protein levels in WI-38 fibroblasts exposed to serum-free (starvation) medium (SS). Lower panel: Densitometric analysis of LC3B-II relative to LC3B-I normalized to time 0 (representative of 4 independent experiments, *P < 0.05 t = 0 vs 1 h). (B) Western blot showing LC3B-I and -II protein levels in WI-38 fibroblasts at baseline, starved for 4 h or 1 d and exposed to DMSO (V) or bafilomycin A1 (20 nM; Baf). Representative of 3 independent experiments. (C) Evaluation of LC3B puncta by confocal microscopy in WI-38 fibroblasts infected with a baculovirus vector expressing GFP-LC3B and exposed to normal conditions (medium with 10% FBS; N), serum-free medium with DMSO (V) or serum-free medium with bafilomycin A1 (20 nM) for 1 d. Representative of 3 independent experiments. (D) Upper panel: Western blot showing SQSTM1 and tubulin (TUBA) protein levels in starved WI-38 fibroblasts. Lower panel: Densitometric analysis of SQSTM1 protein levels relative to tubulin. Data are presented as mean ± s.e.m. (representative of 4 independent experiments, *p = 0.02 4 h vs 2 d and 4 h vs 4 d). (E) Upper panel: Western blot showing ACTA2 protein levels in WI-38 fibroblasts exposed to SS medium or grown under normal conditions (N). Tubulin was used as a loading control. Lower panel: Densitometric analysis of ACTA2 protein levels relative to tubulin normalized to time 0 (representative of 4 independent experiments; *p = 0.0170 SS vs N at 4 d). (F) Evaluation of the myofibroblast markers ACTA2 (red) and stress fiber (green) by immunofluorescence microscopy in cells grown in normal medium (N) or maintained without serum (SS) for 4 d. Representative of 3 independent experiments. (G) Real-time qPCR evaluation of mRNA levels of COL1A1 and COL3A1 after 4 d in N or SS. GAPDH was used as the reference gene (***P < 0.001 N vs SS, representative of 2 independent experiments performed in triplicate).CC BY-NC · PubMed Central
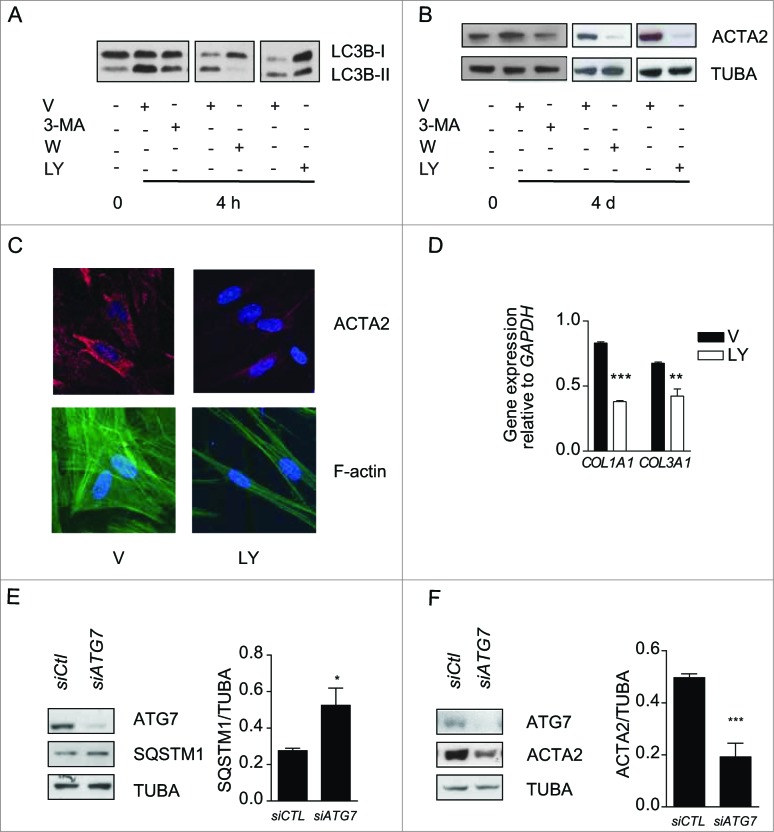
Figure 2. Autophagy induces myofibroblast differentiation in starved fibroblasts. (A) Western blot showing LC3B-I and -II protein levels in WI-38 fibroblasts at baseline or starved in the presence of 3-methyladenine (1 mM; 3-MA), wortmannin (100 nM; W), LY294002 (5 μM; LY) or vehicle (V) for 4 h. Representative of 4 independent experiments. (B) Western blot showing ACTA2 protein levels in WI-38 fibroblasts at baseline or starved and incubated with the same inhibitors as in A for 4 d. Representative of 4 independent experiments. (C) Evaluation of the myofibroblast markers ACTA2 (red) and stress fiber formation (green) by immunofluorescence microscopy in fibroblasts exposed to SS in the presence of LY or V for 4 d. Cell nuclei are visualized in blue. ACTA2 and stress fiber staining of fibroblasts grown in normal medium or starved for 4 d from the same experiment are shown in Figure 1F. Representative of 3 independent experiments. (D) COL1A1 and COL3A1 mRNA levels evaluated by real time qPCR in WI-38 fibroblasts serum starved for 4 d in the presence of the PtdIns3K inhibitor LY or vehicle. GAPDH was used as the reference gene (***P < 0.001 V vs LY for COL1A1 and **P < 0.01 V vs LY for COL3A1). Collagen mRNA levels of fibroblasts grown in normal medium or starved for 4 d from the same experiment are shown in Figure 1G. Representative of 2 independent experiments performed in triplicate. (E) Left panel: Western blot showing ATG7, SQSTM1 and tubulin (TUBA) protein levels in WI-38 fibroblasts starved for 2 d post-nucleofection with control siRNA (siCTL) or ATG7 siRNA (siATG7). Representative of 3 independent experiments. Right panel: Densitometric analysis of SQSTM1 protein level relative to tubulin (representative of 3 independent experiments, *p = 0.0318) in WI-38 fibroblasts silenced for ATG7 expression (ATG7 silencing is effective at 80.6% ± 6.0%, representative of 3 independent experiments, ***P < 0.0001). (F) Left panel: Western blot showing ATG7, ACTA2, and tubulin (TUBA) protein levels in WI-38 fibroblasts starved for 4 d post-nucleofection with control siRNA (siCTL) or ATG7 siRNA (siATG7). Representative of 4 independent experiments. Right panel: Densitometric analysis of ACTA2 level relative to tubulin (***p = 0.0005 representative of 4 independent experiments) in WI-38 fibroblasts silenced for ATG7 expression (ATG7 silencing is effective at 87.4% ± 4.4%, from 4 independent experiments, ***P < 0.0001).
Figure 2. Autophagy induces myofibroblast differentiation in starved fibroblasts. (A) Western blot showing LC3B-I and -II protein levels in WI-38 fibroblasts at baseline or starved in the presence of 3-methyladenine (1 mM; 3-MA), wortmannin (100 nM; W), LY294002 (5 μM; LY) or vehicle (V) for 4 h. Representative of 4 independent experiments. (B) Western blot showing ACTA2 protein levels in WI-38 fibroblasts at baseline or starved and incubated with the same inhibitors as in A for 4 d. Representative of 4 independent experiments. (C) Evaluation of the myofibroblast markers ACTA2 (red) and stress fiber formation (green) by immunofluorescence microscopy in fibroblasts exposed to SS in the presence of LY or V for 4 d. Cell nuclei are visualized in blue. ACTA2 and stress fiber staining of fibroblasts grown in normal medium or starved for 4 d from the same experiment are shown in Figure 1F. Representative of 3 independent experiments. (D) COL1A1 and COL3A1 mRNA levels evaluated by real time qPCR in WI-38 fibroblasts serum starved for 4 d in the presence of the PtdIns3K inhibitor LY or vehicle. GAPDH was used as the reference gene (***P < 0.001 V vs LY for COL1A1 and **P < 0.01 V vs LY for COL3A1). Collagen mRNA levels of fibroblasts grown in normal medium or starved for 4 d from the same experiment are shown in Figure 1G. Representative of 2 independent experiments performed in triplicate. (E) Left panel: Western blot showing ATG7, SQSTM1 and tubulin (TUBA) protein levels in WI-38 fibroblasts starved for 2 d post-nucleofection with control siRNA (siCTL) or ATG7 siRNA (siATG7). Representative of 3 independent experiments. Right panel: Densitometric analysis of SQSTM1 protein level relative to tubulin (representative of 3 independent experiments, *p = 0.0318) in WI-38 fibroblasts silenced for ATG7 expression (ATG7 silencing is effective at 80.6% ± 6.0%, representative of 3 independent experiments, ***P < 0.0001). (F) Left panel: Western blot showing ATG7, ACTA2, and tubulin (TUBA) protein levels in WI-38 fibroblasts starved for 4 d post-nucleofection with control siRNA (siCTL) or ATG7 siRNA (siATG7). Representative of 4 independent experiments. Right panel: Densitometric analysis of ACTA2 level relative to tubulin (***p = 0.0005 representative of 4 independent experiments) in WI-38 fibroblasts silenced for ATG7 expression (ATG7 silencing is effective at 87.4% ± 4.4%, from 4 independent experiments, ***P < 0.0001).CC BY-NC · PubMed Central
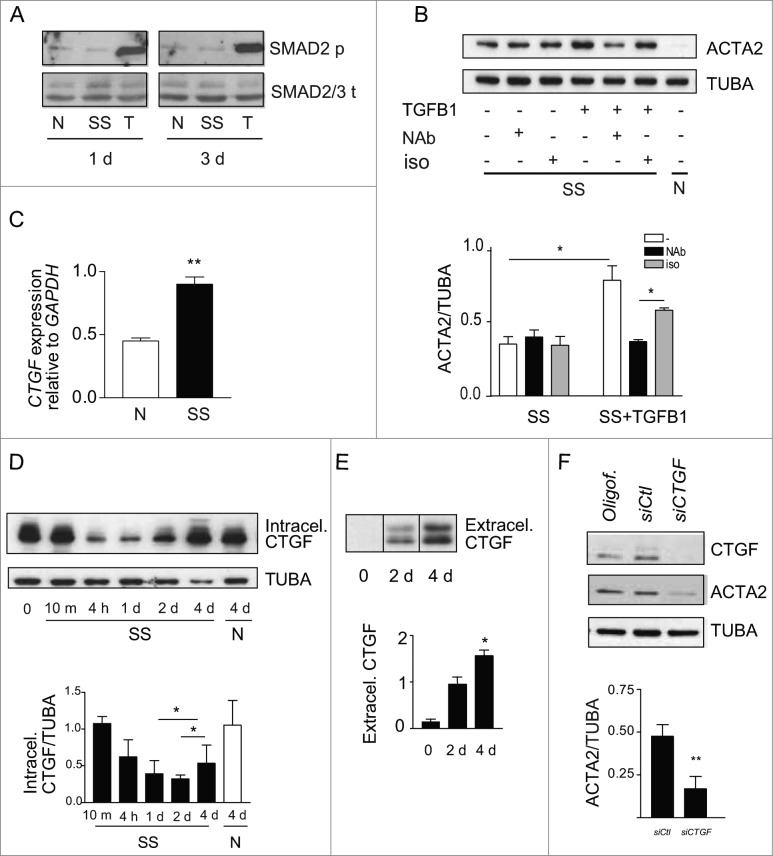
Figure 3. (See previous page). Myofibroblast differentiation induced by starvation is dependent on CTGF upregulation. (A) Western blot showing phosphorylated SMAD2 and total SMAD2/3 in WI-38 fibroblasts cultured under normal conditions (N), serum starved (SS) or incubated with human recombinant TGFB1 (2 ng/ml) in SS for 1 or 3 d. Incubation with TGFB1 was used as a positive control for SMAD signaling. Representative of 3 independent experiments. (B) Upper panel: Western blot showing ACTA2 protein levels in WI-38 fibroblasts exposed to SS for 4 d in the presence of a neutralizing antibody (NAb) against pan-TGFB, or isotype-matched control (iso), both at 10 ug/ml. Recombinant human TGFB1 (0.1 ng/ml) was used as a positive control for the neutralizing activity of the pan-TGFB antibody. Representative of 4 independent experiments. Lower panel: Densitometric analysis of ACTA2 relative to tubulin (TUBA) protein levels (representative of 4 independent experiments, *p = 0.03 neutralizing antibody vs iso in the presence of TGFB1, *p = 0.03 SS vs TGFB1 in SS). (C) Evaluation of CTGF expression by real time qPCR in WI-38 fibroblasts exposed to serum-free medium (SS) or grown in normal condition (N) for 4 d (**p = 0.002). Representative of 2 independent experiments performed in triplicate. (D) Upper panel: Western blot showing intracellular CTGF protein levels in WI-38 fibroblasts at baseline, starved for up to 4 d or maintained in normal medium for 4 d. Representative of 8 independent experiments. Lower panel: Densitometric analysis of intracellular CTGF relative to tubulin protein levels normalized to time 0 (representative of 8 independent experiments, *p = 0.01 1d vs 4 d and 2 d vs 4 d in SS). (E) Upper panel: Evaluation of extracellular CTGF by WB in media conditioned by WI-38 fibroblasts exposed to SS for 0, 2 or 4 d. Representative of 8 independent experiments. Lower panel: Densitometric analysis of extracellular CTGF (representative of 8 independent experiments, *p = 0.01 2 d vs 4 d). (F) Upper panel: Western blot showing intracellular CTGF and ACTA2 protein levels in WI-38 fibroblasts exposed to SS for 5 d post-transfection with control siRNA (siCTL) or siRNA specific to CTGF (siCTGF). Representative of 5 independent experiments. Lower panel: Densitometric analysis of ACTA2 level relative to tubulin (representative of 5 independent experiments, **p = 0.004) in WI-38 fibroblasts silenced for CTGF expression (CTGF silencing is effective at 77.3% ± 4.8%, representative of 5 independent experiments, ***p = 0.0002).
Figure 3. (See previous page). Myofibroblast differentiation induced by starvation is dependent on CTGF upregulation. (A) Western blot showing phosphorylated SMAD2 and total SMAD2/3 in WI-38 fibroblasts cultured under normal conditions (N), serum starved (SS) or incubated with human recombinant TGFB1 (2 ng/ml) in SS for 1 or 3 d. Incubation with TGFB1 was used as a positive control for SMAD signaling. Representative of 3 independent experiments. (B) Upper panel: Western blot showing ACTA2 protein levels in WI-38 fibroblasts exposed to SS for 4 d in the presence of a neutralizing antibody (NAb) against pan-TGFB, or isotype-matched control (iso), both at 10 ug/ml. Recombinant human TGFB1 (0.1 ng/ml) was used as a positive control for the neutralizing activity of the pan-TGFB antibody. Representative of 4 independent experiments. Lower panel: Densitometric analysis of ACTA2 relative to tubulin (TUBA) protein levels (representative of 4 independent experiments, *p = 0.03 neutralizing antibody vs iso in the presence of TGFB1, *p = 0.03 SS vs TGFB1 in SS). (C) Evaluation of CTGF expression by real time qPCR in WI-38 fibroblasts exposed to serum-free medium (SS) or grown in normal condition (N) for 4 d (**p = 0.002). Representative of 2 independent experiments performed in triplicate. (D) Upper panel: Western blot showing intracellular CTGF protein levels in WI-38 fibroblasts at baseline, starved for up to 4 d or maintained in normal medium for 4 d. Representative of 8 independent experiments. Lower panel: Densitometric analysis of intracellular CTGF relative to tubulin protein levels normalized to time 0 (representative of 8 independent experiments, *p = 0.01 1d vs 4 d and 2 d vs 4 d in SS). (E) Upper panel: Evaluation of extracellular CTGF by WB in media conditioned by WI-38 fibroblasts exposed to SS for 0, 2 or 4 d. Representative of 8 independent experiments. Lower panel: Densitometric analysis of extracellular CTGF (representative of 8 independent experiments, *p = 0.01 2 d vs 4 d). (F) Upper panel: Western blot showing intracellular CTGF and ACTA2 protein levels in WI-38 fibroblasts exposed to SS for 5 d post-transfection with control siRNA (siCTL) or siRNA specific to CTGF (siCTGF). Representative of 5 independent experiments. Lower panel: Densitometric analysis of ACTA2 level relative to tubulin (representative of 5 independent experiments, **p = 0.004) in WI-38 fibroblasts silenced for CTGF expression (CTGF silencing is effective at 77.3% ± 4.8%, representative of 5 independent experiments, ***p = 0.0002).CC BY-NC · PubMed Central
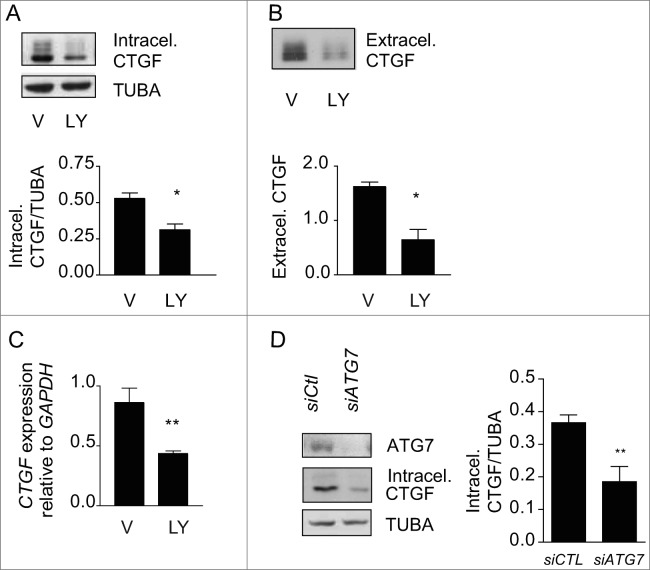
Figure 4. Autophagy is central for CTGF upregulation in starved fibroblasts. (A) Upper panel: Western blot showing intracellular CTGF protein levels in serum-starved WI-38 fibroblasts incubated with the autophagy inhibitor LY294002 5 uM (LY) or vehicle (V) for 4 d. Representative of 4 independent experiments. Lower panel: Densitometric analysis of intracellular CTGF protein levels relative to tubulin (representative of 4 independent experiments, *p = 0.0286). (B) Upper panel: Western blot of extracellular CTGF protein levels in media conditioned by starved WI-38 fibroblasts in the presence of the inhibitor LY294002 5 uM (LY) or vehicle (V) for 4 d. Representative of 4 independent experiments. Lower panel: Densitometric analysis of extracellular CTGF protein levels (representative of 4 independent experiments, *p = 0.03 V vs LY at 4 d). (C) Evaluation of CTGF expression by qPCR in WI-38 fibroblasts exposed to serum-free medium (SS) in the presence of LY294002 5 uM (LY) or vehicle (V) for 4 d (**p = 0.0036). CTGF expression was normalized to GAPDH. CTGF mRNA levels of fibroblasts grown in normal medium or starved for 4 d from the same experiment are shown in Figure 3C. Representative of 2 independent experiments performed in triplicate. (D) Left panel: Western blot showing ATG7, CTGF and tubulin (TUBA) protein levels in WI-38 fibroblasts exposed to SS for 4 d post-nucleofection with control siRNA (siCTL) or siRNA specific to ATG7 (siATG7). Representative of 4 independent experiments. Right panel: Densitometric analysis of CTGF level relative to tubulin (**p = 0.0087 representative of 4 independent experiments) in WI-38 fibroblasts silenced for ATG7 expression (ATG7 silencing is effective at 87.4% ± 4.4%, representative of 4 independent experiments, *** P < 0.0001).
Figure 4. Autophagy is central for CTGF upregulation in starved fibroblasts. (A) Upper panel: Western blot showing intracellular CTGF protein levels in serum-starved WI-38 fibroblasts incubated with the autophagy inhibitor LY294002 5 uM (LY) or vehicle (V) for 4 d. Representative of 4 independent experiments. Lower panel: Densitometric analysis of intracellular CTGF protein levels relative to tubulin (representative of 4 independent experiments, *p = 0.0286). (B) Upper panel: Western blot of extracellular CTGF protein levels in media conditioned by starved WI-38 fibroblasts in the presence of the inhibitor LY294002 5 uM (LY) or vehicle (V) for 4 d. Representative of 4 independent experiments. Lower panel: Densitometric analysis of extracellular CTGF protein levels (representative of 4 independent experiments, *p = 0.03 V vs LY at 4 d). (C) Evaluation of CTGF expression by qPCR in WI-38 fibroblasts exposed to serum-free medium (SS) in the presence of LY294002 5 uM (LY) or vehicle (V) for 4 d (**p = 0.0036). CTGF expression was normalized to GAPDH. CTGF mRNA levels of fibroblasts grown in normal medium or starved for 4 d from the same experiment are shown in Figure 3C. Representative of 2 independent experiments performed in triplicate. (D) Left panel: Western blot showing ATG7, CTGF and tubulin (TUBA) protein levels in WI-38 fibroblasts exposed to SS for 4 d post-nucleofection with control siRNA (siCTL) or siRNA specific to ATG7 (siATG7). Representative of 4 independent experiments. Right panel: Densitometric analysis of CTGF level relative to tubulin (**p = 0.0087 representative of 4 independent experiments) in WI-38 fibroblasts silenced for ATG7 expression (ATG7 silencing is effective at 87.4% ± 4.4%, representative of 4 independent experiments, *** P < 0.0001).CC BY-NC · PubMed Central
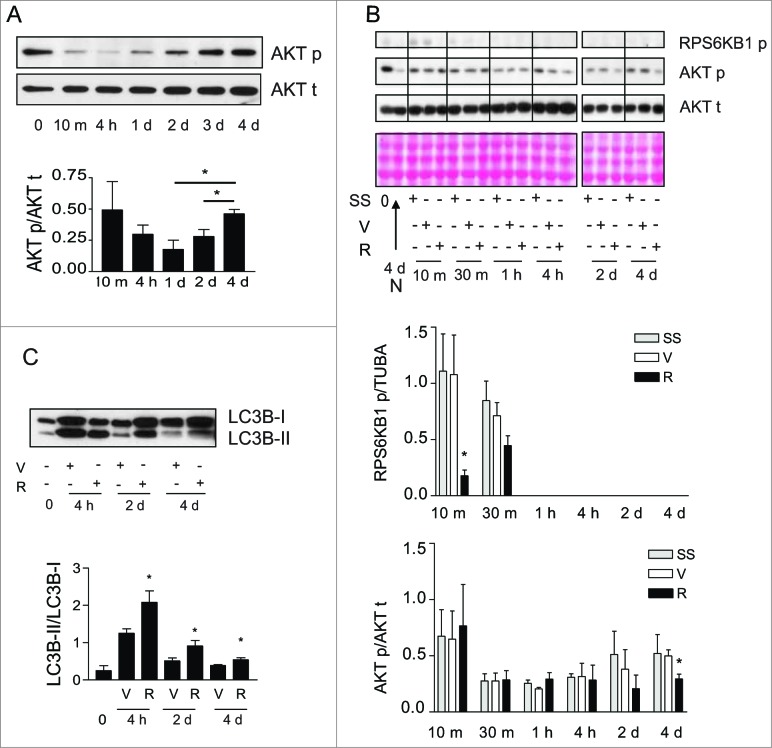
Figure 5. Activation of MTORC2 signaling in starved fibroblasts. (A) Upper panel: Western blot showing phosphorylation of AKT Ser473 (AKT p) and total AKT (AKT t) in WI-38 fibroblasts at baseline and exposed to serum-free medium (SS) for up to 4 d. Representative of 5 independent experiments. Lower panel: Densitometric analysis of AKT p relative to AKT t normalized to time 0 (representative of 5 independent experiments, *p = 0.0189 2 d vs 4 d and *p = 0.0238 1d vs 4 d). (B) Upper panel: Western blot showing phosphorylation of RPS6KB1 (MTORC1 downstream target) and phosphorylation of AKT Ser473 (MTORC2 target) in WI-38 fibroblasts at baseline and starved (SS) for up to 4 d in the presence of rapamycin (10 nM; R) or vehicle (V). Total AKT level was also evaluated by WB. Ponceau Red staining was used as loading control. Representative of 4 independent experiments. Middle panel: Densitometric analysis of phosphorylated RPS6KB1 relative to tubulin (representative of 4 independent experiments, *p = 0.0286 V vs R at 10 min). Data were normalized to baseline. Lower panel: Densitometric analysis of AKT p relative to AKT t (representative of 4 independent experiments, *p = 0.0237 V vs R at d 4). Data were normalized to baseline. (C) Upper panel: Western blot showing LC3B-I and -II protein levels in WI-38 fibroblasts at baseline or exposed to SS for 4 h, 2 d or 4 d in the presence of rapamycin (10 nM; R) or vehicle (V). Representative of 5 independent experiments. Lower panel: Densitometric analysis of LC3B-II relative to LC3B-I (representative of 5 independent experiments; *p = 0.0456 V vs R at 4 h, *p = 0.0444 V vs R at 2 d, *p = 0.0266 V vs R at 4 d).
Figure 5. Activation of MTORC2 signaling in starved fibroblasts. (A) Upper panel: Western blot showing phosphorylation of AKT Ser473 (AKT p) and total AKT (AKT t) in WI-38 fibroblasts at baseline and exposed to serum-free medium (SS) for up to 4 d. Representative of 5 independent experiments. Lower panel: Densitometric analysis of AKT p relative to AKT t normalized to time 0 (representative of 5 independent experiments, *p = 0.0189 2 d vs 4 d and *p = 0.0238 1d vs 4 d). (B) Upper panel: Western blot showing phosphorylation of RPS6KB1 (MTORC1 downstream target) and phosphorylation of AKT Ser473 (MTORC2 target) in WI-38 fibroblasts at baseline and starved (SS) for up to 4 d in the presence of rapamycin (10 nM; R) or vehicle (V). Total AKT level was also evaluated by WB. Ponceau Red staining was used as loading control. Representative of 4 independent experiments. Middle panel: Densitometric analysis of phosphorylated RPS6KB1 relative to tubulin (representative of 4 independent experiments, *p = 0.0286 V vs R at 10 min). Data were normalized to baseline. Lower panel: Densitometric analysis of AKT p relative to AKT t (representative of 4 independent experiments, *p = 0.0237 V vs R at d 4). Data were normalized to baseline. (C) Upper panel: Western blot showing LC3B-I and -II protein levels in WI-38 fibroblasts at baseline or exposed to SS for 4 h, 2 d or 4 d in the presence of rapamycin (10 nM; R) or vehicle (V). Representative of 5 independent experiments. Lower panel: Densitometric analysis of LC3B-II relative to LC3B-I (representative of 5 independent experiments; *p = 0.0456 V vs R at 4 h, *p = 0.0444 V vs R at 2 d, *p = 0.0266 V vs R at 4 d).CC BY-NC · PubMed Central
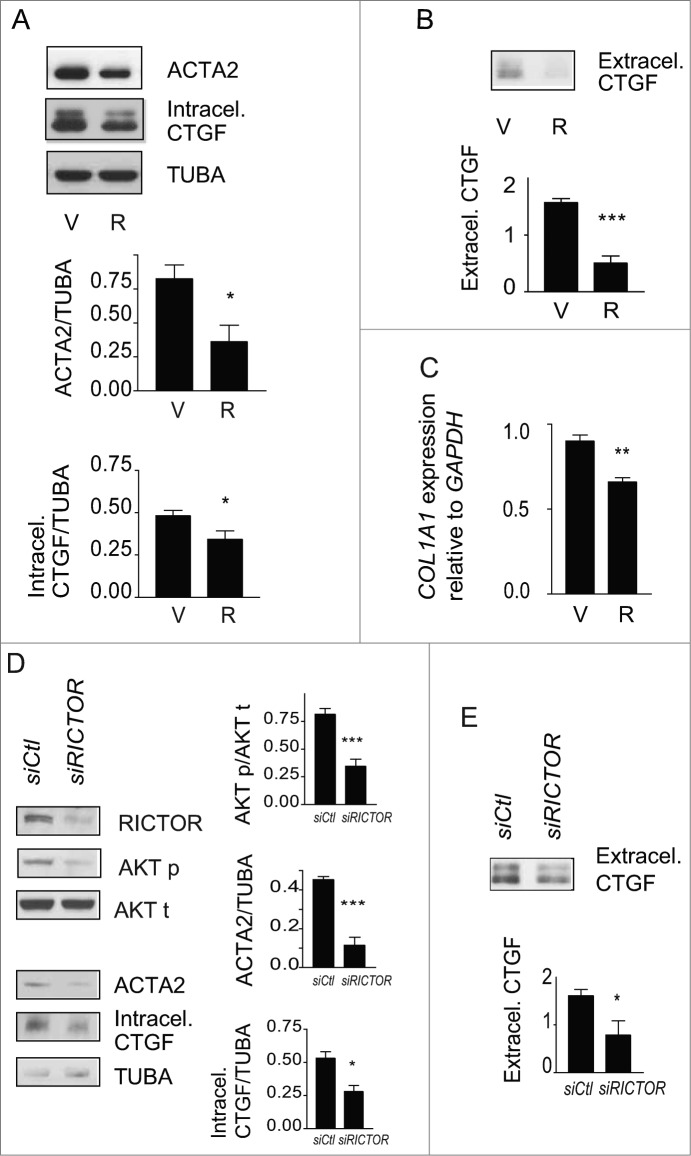
Figure 6. Blockade of autophagy-induced myofibroblast differentiation by rapamycin. (A) Upper panel: Western blot showing ACTA2 and intracellular CTGF protein levels in serum-starved WI-38 fibroblasts incubated with the MTOR inhibitor rapamycin (10 nM; R) or vehicle (V) for 4 d. Representative of 5 independent experiments. Middle panel: Densitometric analysis of ACTA2 protein levels relative to tubulin (representative of 5 independent experiments; *p = 0.0189). Lower panel: Densitometric analysis of intracellular CTGF protein levels relative to tubulin (representative of 5 independent experiments, *p = 0.0485). (B) Upper panel: Western blot showing extracellular CTGF protein levels in media conditioned by WI-38 fibroblasts starved in the presence of rapamycin (R) or vehicle (V) for 4 d. Representative of 5 independent experiments. Lower panel: Densitometric analysis of extracellular CTGF, representative of 5 independent experiments, ***P < 0.0001 V vs R. (C) Evaluation of the expression of the myofibroblast marker COL1A1 by real-time qPCR in WI-38 fibroblasts serum starved for 4 d in the presence of rapamycin (10 nM; R) or vehicle (V) (**p = 0.005 V vs R). Collagen mRNA levels of fibroblasts grown in normal medium or starved for 4 d from the same experiment are shown in Figure 1G. Representative of 2 independent experiments performed in triplicate. (D) Effects of MTORC2 inhibition by RICTOR silencing on levels of downstream target AKT phosphorylation, myofibroblast marker ACTA2, and intracellular CTGF. Left panel: Cells were incubated in SS for 4 d after electroporation with control siRNA (siCTL) or siRICTOR. Cell lysates were analyzed by WB. Inhibition of RICTOR expression (82.3 +/- 17.3%, representative of 4 independent experiments, ***P < 0.0001) was achieved over siCTL. Right upper panel: Densitometric analysis of AKT p relative to total AKT (representative of 4 independent experiments; ***p = 0.0002). Right middle panel: Densitometric analysis of ACTA2 relative to tubulin (representative of 4 independent experiments; ***p = 0.0003). Right lower panel: Densitometric analysis of intracellular CTGF relative to tubulin (representative of 4 independent experiments; *p = 0.0286). (E) Upper panel: Evaluation of extracellular CTGF by WB in conditioned media from the experiment described in (C). Lower panel: Densitometric analysis of extracellular CTGF (representative of 4 independent experiments; *p = 0.0286).
Figure 6. Blockade of autophagy-induced myofibroblast differentiation by rapamycin. (A) Upper panel: Western blot showing ACTA2 and intracellular CTGF protein levels in serum-starved WI-38 fibroblasts incubated with the MTOR inhibitor rapamycin (10 nM; R) or vehicle (V) for 4 d. Representative of 5 independent experiments. Middle panel: Densitometric analysis of ACTA2 protein levels relative to tubulin (representative of 5 independent experiments; *p = 0.0189). Lower panel: Densitometric analysis of intracellular CTGF protein levels relative to tubulin (representative of 5 independent experiments, *p = 0.0485). (B) Upper panel: Western blot showing extracellular CTGF protein levels in media conditioned by WI-38 fibroblasts starved in the presence of rapamycin (R) or vehicle (V) for 4 d. Representative of 5 independent experiments. Lower panel: Densitometric analysis of extracellular CTGF, representative of 5 independent experiments, ***P < 0.0001 V vs R. (C) Evaluation of the expression of the myofibroblast marker COL1A1 by real-time qPCR in WI-38 fibroblasts serum starved for 4 d in the presence of rapamycin (10 nM; R) or vehicle (V) (**p = 0.005 V vs R). Collagen mRNA levels of fibroblasts grown in normal medium or starved for 4 d from the same experiment are shown in Figure 1G. Representative of 2 independent experiments performed in triplicate. (D) Effects of MTORC2 inhibition by RICTOR silencing on levels of downstream target AKT phosphorylation, myofibroblast marker ACTA2, and intracellular CTGF. Left panel: Cells were incubated in SS for 4 d after electroporation with control siRNA (siCTL) or siRICTOR. Cell lysates were analyzed by WB. Inhibition of RICTOR expression (82.3 +/- 17.3%, representative of 4 independent experiments, ***P < 0.0001) was achieved over siCTL. Right upper panel: Densitometric analysis of AKT p relative to total AKT (representative of 4 independent experiments; ***p = 0.0002). Right middle panel: Densitometric analysis of ACTA2 relative to tubulin (representative of 4 independent experiments; ***p = 0.0003). Right lower panel: Densitometric analysis of intracellular CTGF relative to tubulin (representative of 4 independent experiments; *p = 0.0286). (E) Upper panel: Evaluation of extracellular CTGF by WB in conditioned media from the experiment described in (C). Lower panel: Densitometric analysis of extracellular CTGF (representative of 4 independent experiments; *p = 0.0286).CC BY-NC · PubMed Central
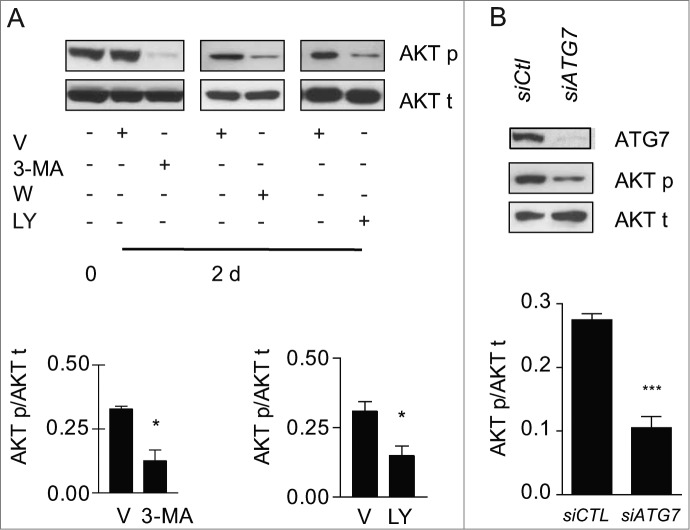
Figure 7. Autophagy is essential for MTORC2 activity induced by serum starvation. (A) Upper panel: Evaluation of AKT Ser473 phosphorylation (AKT p) and total AKT (AKT t) by WB in WI-38 fibroblasts at baseline or exposed to SS plus vehicle for 2 d or maintained in SS with the autophagy inhibitors 3-methyladenine (1 mM; 3-MA), wortmannin (100 nM; W), or LY294002 (5 μM; LY). Representative of 4 independent experiments. Lower left panel: Densitometric analysis of AKT p relative to AKT t in cells exposed to DMSO or 3-MA (representative of 4 independent experiments, *p = 0.0286). Lower right panel: Densitometric analysis of AKT p relative to AKT t in cells exposed to DMSO or LY (representative of 4 independent experiments, *p = 0.0114 V vs LY at d 2). (B) Upper panel: Evaluation of AKT Ser473 phosphorylation (AKT p) and total AKT (AKT t) by WB in WI-38 fibroblasts exposed to SS for 2 d post-transfection with control siRNA (siCTL) or siRNA specific to ATG7 (siATG7). Representative of 3 independent experiments. Lower panel: Densitometric analysis of AKT p protein level relative to AKT t (representative of 3 independent experiments, ***P < 0.0001) in WI-38 fibroblasts silenced for ATG7 expression (ATG7 silencing is effective at 80.6% ± 6.0%, representative of 3 independent experiments, ***P < 0.0001).
Figure 7. Autophagy is essential for MTORC2 activity induced by serum starvation. (A) Upper panel: Evaluation of AKT Ser473 phosphorylation (AKT p) and total AKT (AKT t) by WB in WI-38 fibroblasts at baseline or exposed to SS plus vehicle for 2 d or maintained in SS with the autophagy inhibitors 3-methyladenine (1 mM; 3-MA), wortmannin (100 nM; W), or LY294002 (5 μM; LY). Representative of 4 independent experiments. Lower left panel: Densitometric analysis of AKT p relative to AKT t in cells exposed to DMSO or 3-MA (representative of 4 independent experiments, *p = 0.0286). Lower right panel: Densitometric analysis of AKT p relative to AKT t in cells exposed to DMSO or LY (representative of 4 independent experiments, *p = 0.0114 V vs LY at d 2). (B) Upper panel: Evaluation of AKT Ser473 phosphorylation (AKT p) and total AKT (AKT t) by WB in WI-38 fibroblasts exposed to SS for 2 d post-transfection with control siRNA (siCTL) or siRNA specific to ATG7 (siATG7). Representative of 3 independent experiments. Lower panel: Densitometric analysis of AKT p protein level relative to AKT t (representative of 3 independent experiments, ***P < 0.0001) in WI-38 fibroblasts silenced for ATG7 expression (ATG7 silencing is effective at 80.6% ± 6.0%, representative of 3 independent experiments, ***P < 0.0001).CC BY-NC · PubMed Central
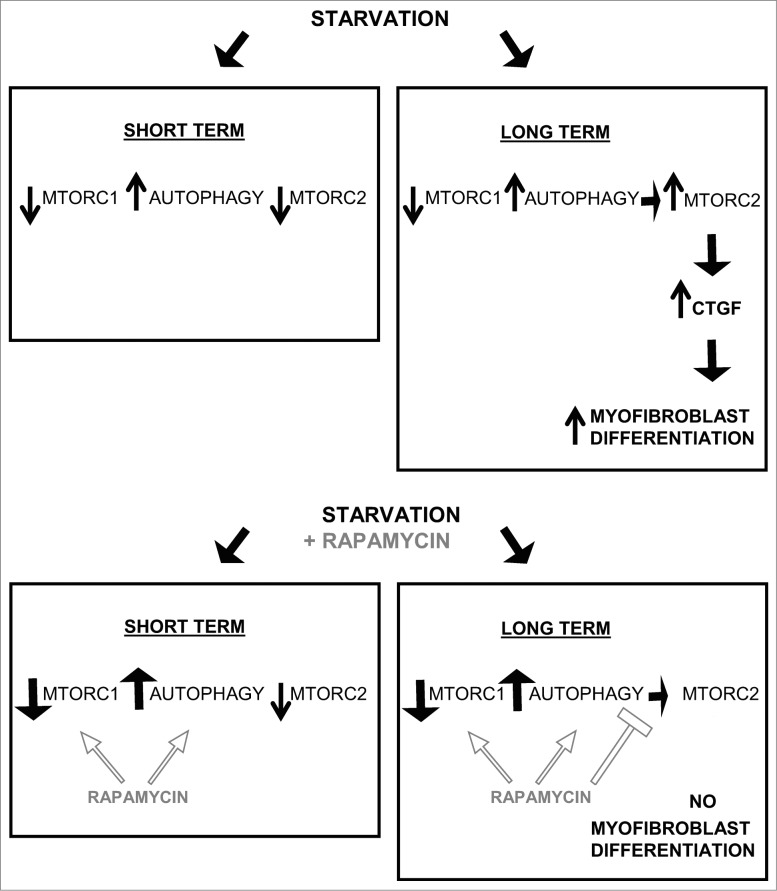
Figure 8. Long-term autophagy favors MTORC2 activation leading to enhanced CTGF production and myofibroblast differentiation. Short-term serum starvation inactivates MTORC1 and MTORC2 signaling leading to dephosphorylation of RPS6KB1 (Thr389) and AKT (Ser473). MTORC1 inhibition induces autophagy, demonstrated by a higher LC3B-II/-I ratio and lower SQSTM1 level. Rapamycin increases autophagy by further inhibiting MTORC1. A sustained autophagic response is responsible for the MTORC2 reactivation when fibroblasts are starved for 2 d or more (long term), as measured by rephosphorylation of AKT at Ser473. In turn, MTORC2 activity drives the production and secretion of the pro-fibrotic cytokine CTGF leading to myofibroblast differentiation. Long-term exposure to rapamycin inactivates MTORC1 leading to an increased autophagic response, but prevents MTORC2 activation and downstream CTGF induction and myofibroblast differentiation.
Figure 8. Long-term autophagy favors MTORC2 activation leading to enhanced CTGF production and myofibroblast differentiation. Short-term serum starvation inactivates MTORC1 and MTORC2 signaling leading to dephosphorylation of RPS6KB1 (Thr389) and AKT (Ser473). MTORC1 inhibition induces autophagy, demonstrated by a higher LC3B-II/-I ratio and lower SQSTM1 level. Rapamycin increases autophagy by further inhibiting MTORC1. A sustained autophagic response is responsible for the MTORC2 reactivation when fibroblasts are starved for 2 d or more (long term), as measured by rephosphorylation of AKT at Ser473. In turn, MTORC2 activity drives the production and secretion of the pro-fibrotic cytokine CTGF leading to myofibroblast differentiation. Long-term exposure to rapamycin inactivates MTORC1 leading to an increased autophagic response, but prevents MTORC2 activation and downstream CTGF induction and myofibroblast differentiation.CC BY-NC · PubMed Central

Verification

Claims the paper makes

The claims and statistics of this paper haven’t been checked yet.

Run the check — free, no account needed. It reads the open-access text and checks the sources it cites.

A few free checks a day · papers already verified open instantly · results are public

Claims other papers make about this one

Each is checked against this paper’s own text: does it say what the citing paper says it does?

Self-check

Percentages, sums and reported differences re-computed from the paper’s own numbers.

The self-check needs the paper’s full text.

Citations

Cites

Research works printed but not linked: 55

  1. 10.1172/JCI31487 · DOI
  2. 10.3410/B2-78 · DOI
  3. 10.1097/01.LAB.0000101911.53973.90 · DOI
  4. 10.3109/08977194.2011.595714 · DOI
  5. 10.1172/JCI114793 · DOI
  6. 10.1111/j.1440-1681.2011.05487.x · DOI
  7. 10.1006/clim.2001.5008 · DOI
  8. 10.2741/gressner · DOI
  9. 10.1002/(SICI)1097-4652(199910)181:1%3c153::AID-JCP16%3e3.0.CO;2-K · DOI
  10. Abreu JG, 2002, Nat Cell Biol, 4, 599, 10.1038/ncb826 · DOI
  11. 10.1111/1523-1747.ep12363389 · DOI
  12. 10.1007/s12079-009-0037-7 · DOI
  13. 10.1002/art.30074 · DOI
  14. 10.1159/000262316 · DOI
  15. 10.1111/1523-1747.ep12345771 · DOI
  16. 10.2741/4067 · DOI
  17. 10.1038/cdd.2009.124 · DOI
  18. 10.1111/j.1365-2249.2006.03199.x · DOI
  19. 10.1152/ajprenal.00245.2004 · DOI
  20. 10.1038/bjc.2011.226 · DOI
  21. 10.1038/ncb2708 · DOI
  22. 10.1002/path.4115 · DOI
  23. 10.4161/auto.19947 · DOI
  24. 10.1053/j.gastro.2011.12.044 · DOI · Paper page
  25. 10.1111/j.1432-1033.1997.0240a.x · DOI
  26. 10.1074/jbc.275.2.992 · DOI
  27. 10.4049/jimmunol.174.9.5740 · DOI
  28. 10.1074/jbc.M606412200 · DOI
  29. 10.1016/S0092-8674(03)00432-X · DOI
  30. 10.1007/s12079-011-0125-3 · DOI
  31. 10.1007/s12079-009-0071-5 · DOI
  32. 10.1371/journal.pone.0033626 · DOI
  33. 10.4161/cbt.2.3.360 · DOI
  34. 10.1016/j.molcel.2006.03.029 · DOI · Paper page
  35. 10.1016/j.cell.2012.03.017 · DOI · Paper page
  36. 10.1128/MCB.00601-09 · DOI
  37. 10.1681/ASN.2010080793 · DOI
  38. 10.1097/MCP.0b013e328356800f · DOI
  39. 10.1371/journal.pone.0041394 · DOI
  40. 10.1002/art.27498 · DOI
  41. Grotendorst GR, 1996, Cell Growth Differ, 7, 469
  42. 10.1002/art.24620 · DOI
  43. 10.1186/1755-1536-5-S1-S24 · DOI
  44. 10.1186/1755-1536-4-4 · DOI
  45. 10.1097/01.ASN.0000130565.69170.85 · DOI
  46. 10.1002/jgm.894 · DOI
  47. 10.1165/ajrcmb.21.6.3719 · DOI
  48. 10.1002/hep.510300425 · DOI
  49. Sato S, 2000, J Rheumatol, 27, 149
  50. 10.1097/TP.0b013e31829b07e1 · DOI
  51. 10.1111/j.1600-6143.2006.01493.x · DOI
  52. 10.2337/diacare.29.01.06.dc05-1670 · DOI
  53. 10.1038/onc.2012.333 · DOI
  54. 10.1152/ajplung.00213.2012 · DOI
  55. 10.1074/jbc.M801164200 · DOI

Cited by

Sorted by citations

See all 86

Metadata

Authors
Bernard, M., Dieudé, M., Yang, B., Hamelin, K., Underwood, K., & Hébert, M.-J.
Venue
Autophagy
Published
2014-12-02
Volume
10
Issue
12
Pages
2193-2207
ISSN
  • 1554-8627
  • 1554-8635
Cited by
86
References
6
Language
en

About these checks

Registry, retraction, Cites and statistics results are computed, not judged, with one exception: a printed reference that no index lists is read once by a model before it counts as a citation error. Claims are extracted by a model and kept only when their quote appears verbatim in the text; each cited source is then checked, with a model’s help, for whether it says what the claim relies on. Those verdicts can be wrong — read the claim’s quote and the cited source before relying on one.

Statistics and arithmetic are recomputed, not judged.

Confidence bands are shown only for fields calibrated on our annotated test set. None is calibrated yet, so no band is shown.

What counts as a claim ›How we measure confidence ›How we check this ›

Are you an author, or do you see a problem with this page? Request a review