

Network meta-analysis: application and practice using Stata
Open accessThe DOI matches its Crossref record; 47 of the 47 references it cites were found in a registry or an index.
Abstract
This review aimed to arrange the concepts of a network meta-analysis (NMA) and to demonstrate the analytical process of NMA using Stata software under frequentist framework. The NMA tries to synthesize evidences for a decision making by evaluating the comparative effectiveness of more than two alternative interventions for the same condition. Before conducting a NMA, 3 major assumptions-similarity, transitivity, and consistency-should be checked. The statistical analysis consists of 5 steps. The first step is to draw a network geometry to provide an overview of the network relationship. The second step checks the assumption of consistency. The third step is to make the network forest plot or interval plot in order to illustrate the summary size of comparative effectiveness among various interventions. The fourth step calculates cumulative rankings for identifying superiority among interventions. The last step evaluates publication bias or effect modifiers for a valid inference from results. The synthesized evidences through five steps would be very useful to evidence-based decision-making in healthcare. Thus, NMA should be activated in order to guarantee the quality of healthcare system.
Overview
The claims and statistics of this paper haven’t been checked yet.
Free: it reads the open-access text and checks the first 5 claims that cite a source we can check. Create a free account to check every claim.
Integrity signals
Registry
Cites
Statistics
Figures
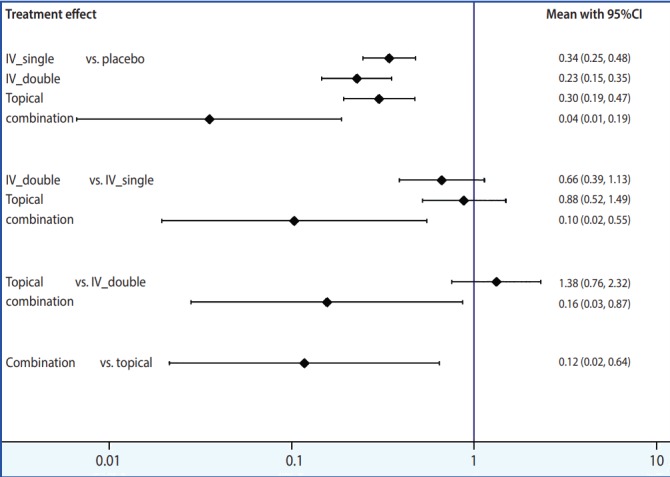
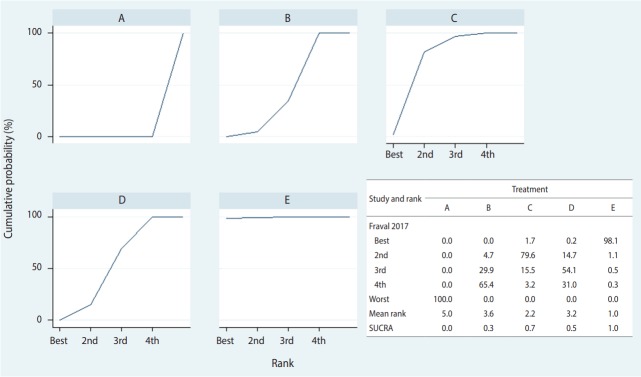
Verification
Claims the paper makes
The claims and statistics of this paper haven’t been checked yet.
Free: it reads the open-access text and checks the first 5 claims that cite a source we can check. Create a free account to check every claim.
Claims other papers make about this one
Each is checked against this paper’s own text: does it say what the citing paper says it does?
In the citing paper
“The network meta-analysis was performed following the current Preferred Reporting Items for Systematic Reviews and Meta-Analyses guideline items (26,27): 1) a network geometry was created to explore the comparisons between resistance training loads; 2) transitivity was tested by fitting a network inconsistency assumption along with Q test and side-splitting analyses between indirect and direct”
From Resistance training load effects on muscle hypertrophy and strength gain: systematic review and network meta-analysis. (2021) · cites this paper as [26]
Self-check
Percentages, sums and reported differences re-computed from the paper’s own numbers.
The self-check needs the paper’s full text.
Citations
Cites
Hutton, B., Salanti, G., Caldwell, D. M., Chaimani, A., Schmid, C. H., Cameron, C., Ioannidis, J. P. A., Straus, S., Thorlund, K., Jansen, J. P., et al. (2015) · Annals of Internal Medicine · doi:10.7326/m14-2385 · Cited by 8,269
Salanti, G., Ades, A. E., & Ioannidis, J. P. A. (2011) · Journal of Clinical Epidemiology · doi:10.1016/j.jclinepi.2010.03.016 · Cited by 3,766
Checking consistency in mixed treatment comparison meta-analysis
Dias, S., Welton, N. J., Caldwell, D. M., & Ades, A. E. (2010) · Statistics in Medicine · doi:10.1002/sim.3767 · Cited by 2,521
Combination of direct and indirect evidence in mixed treatment comparisons
Lu, G., & Ades, A. E. (2004) · Statistics in Medicine · doi:10.1002/sim.1875 · Cited by 2,166
Consistency and inconsistency in network meta-analysis: concepts and models for multi-arm studies
Higgins, J. P. T., Jackson, D., Barrett, J. K., Lu, G., Ades, A. E., & White, I. R. (2012) · Research Synthesis Methods · doi:10.1002/jrsm.1044 · Cited by 2,098
Bucher, H. C., Guyatt, G. H., Griffith, L. E., & Walter, S. D. (1997) · Journal of Clinical Epidemiology · doi:10.1016/s0895-4356(97)00049-8 · Cited by 2,052
Salanti, G. (2012) · Research Synthesis Methods · doi:10.1002/jrsm.1037 · Cited by 1,729
Cipriani, A., Furukawa, T. A., Salanti, G., Geddes, J. R., Higgins, J. P., Churchill, R., Watanabe, N., Nakagawa, A., Omori, I. M., McGuire, H., et al. (2009) · The Lancet · doi:10.1016/s0140-6736(09)60046-5 · Cited by 1,654
Network meta‐analysis for indirect treatment comparisons
Lumley, T. (2002) · Statistics in Medicine · doi:10.1002/sim.1201 · Cited by 1,206
White, I. R., Barrett, J. K., Jackson, D., & Higgins, J. P. T. (2012) · Research Synthesis Methods · doi:10.1002/jrsm.1045 · Cited by 1,114
Cited by
Items 301–400 of 663
Lasers and Intense Pulsed Light for the Treatment of Pathological Scars: A Network Meta-Analysis
Liu, X., Liu, W., Fang, S.-W., Zhou, X.-L., Xu, J.-X., & Li, G. (2022) · Aesthetic Surgery Journal · doi:10.1093/asj/sjac175 · Cited by 8
Guo, C.-H., Zhong, J., Jin, X., & Zhang, J.-E. (2023) · International Journal of Nursing Studies · doi:10.1016/j.ijnurstu.2023.104680 · Cited by 8
Tsai, C.-S., Huang, M.-T., Jou, I., Wu, P., & Ko, P. (2024) · Foot and Ankle Surgery · doi:10.1016/j.fas.2024.05.008 · Cited by 8
Cui, J., Yin, Y., Xu, Y., & Wu, H. (2025) · Frontiers in Physiology · doi:10.3389/fphys.2025.1568247 · Cited by 9
“Sensitivity analysis (Shim et al., 2017) was performed to examine the robustness of individual studies, and a funnel plot was created to evaluate publication bias, using Begg and Egger tests to quantify publication bias; with P < 0.1 as the significance level (Phua et al., 2022).”
InfluentialDu, D., Tang, Q., Han, Q., Zhang, J., Liang, X., Tan, Y., Liu, K., & Xiang, B. (2020) · Pharmacogenomics · doi:10.2217/pgs-2020-0037 · Cited by 8
Salari, N., Shohaimi, S., Kiaei, A., Far, A. H., Mansouri, K., Ahmadi, A., & Mohammadi, M. (2023) · Biology Methods and Protocols · doi:10.1093/biomethods/bpac038 · Cited by 8
Lee, S., Shim, S. R., Jeong, S. Y., & Kim, S. (2022) · Clinical Nuclear Medicine · doi:10.1097/rlu.0000000000004323 · Cited by 8
Self-citationKim, D. H., Kim, S. W., Basurrah, M. A., & Hwang, S. H. (2023) · International Journal of Pediatric Otorhinolaryngology · doi:10.1016/j.ijporl.2023.111455 · Cited by 9
Bu, Z., Wan, S.-R., Steinmann, P., Yin, Z.-T., Tan, J.-P., Li, W., Tang, Z.-Y., Jiang, S., Ye, M.-M., Xu, J.-Y., et al. (2024) · Journal of Cancer · doi:10.7150/jca.91301 · Cited by 8
“As a novel evidence-based medical statistical analysis method, Network Meta-Analysis (NMA) combines direct and indirect evidence to evaluate multiple treatments in a single analysis, expanding upon the principles of conventional meta-analysis [9, 10].”
MethodNi, M., Wang, H., Wang, M., Zhou, W., Wu, J., Sun, B., Zhang, Q., Fan, X., Zhang, D., Jing, Z., et al. (2020) · Evidence-based Complementary and Alternative Medicine · doi:10.1155/2020/1824536 · Cited by 7
“1 software (Stata Corp, College Station, TX, USA), which presents indirect comparative relationships between different interventions [36].”
Wang, X., Li, J., Wang, Y.-S., Yu, C.-C., He, C., Huang, Z., Wu, M., & Kong, L.-H. (2020) · Medicine · doi:10.1097/md.0000000000023548 · Cited by 8
Ni, M., Wu, Z., Wang, H., Zhou, W., Wu, C., Stalin, A., Fu, C., Ye, P., Lu, S., Tan, Y., et al. (2021) · Frontiers in Pharmacology · doi:10.3389/fphar.2021.739673 · Cited by 8
Rao, Y., Yang, R., Zhao, J., & Cao, Q. (2022) · Journal of Zhejiang University (Medical Sciences) · doi:10.3724/zdxbyxb-2022-0145 · Cited by 11
Xu, X., Abdullah, B., Samsudin, S., & Tan, Y. (2025) · PeerJ · doi:10.7717/peerj.19640 · Cited by 8
“05 ( Shim et al., 2017 ).”
Aguilera-Eguía, R. A., Pamela Serón, S., Gutiérrez-Arias, R. E., Herrera-Serna, B. Y., Galdavini, V. P., Inostroza-Reyes, G., Yáñez-Baeza, C., Fuentes-Barría, H., Belmar-Arriagada, H., Inostroza-Quiroz, J., et al. (2025) · Journal of Clinical Medicine · doi:10.3390/jcm14196762 · Cited by 7
“The risk of bias was independently evaluated using the Cochrane Risk of Bias Tool (ROB 2.0) [19,20].”
InfluentialLi, P., Zhang, Y., Xu, T., Zhu, J., Wei, T., & Zhao, W. (2023) · Nuclear Medicine Communications · doi:10.1097/mnm.0000000000001773 · Cited by 7
“Finally, we performed the Bayesian network meta-analysis and specific graphical analysis as mentioned above; R software 4.1.0 (R Foundation for Statistical Computing) and STATA version 17.0 software (Stata Corp LP) were used according to previous studies [26,29,30].”
MethodInfluentialCheng, X., Sun, S., Chen, M., Zhou, X., Rao, M., Guo, D., Xie, J., Huang, Q., & Su, L. (2024) · Obesity Reviews · doi:10.1111/obr.13834 · Cited by 8
“29,36”
Understanding Network Meta‐Analysis: A Practical Introduction for Nurses
Sharifnia, A. M., Biroš, E., & Cleary, M. L. (2024) · Journal of Advanced Nursing · doi:10.1111/jan.16421 · Cited by 10
“The third assumption is inconsistency or coherence, which involves statistically examining transitivity based on the differences between direct and indirect comparisons (Shim et al. 2017).”
Guan, D., Liu, Y., Gu, Y., Zheng, B., Sun, R., Shen, Y., & Yang, Y. (2025) · International Archives of Allergy and Immunology · doi:10.1159/000543023 · Cited by 7
Li, M., Yu, B., Yang, H., He, H., & Gao, R. (2025) · Journal of Clinical Nursing · doi:10.1111/jocn.17753 · Cited by 8
Shi, C.-L., Zhang, Y., Zhang, Z., Zhou, J., & Tang, X. (2021) · Indian Pediatrics · doi:10.1007/s13312-021-2155-0 · Cited by 7
“When the global Wald test indicated no significant differences between the consistency and inconsistency models [11] and no significant differences in estimates based on side splits, we presented consistency model estimates.”
MethodDiagnostic Value of Rna for Hepatocellular Carcinoma: A Network Meta-Analysis
Han, Z., Li, K., Wu, J., Wang, K., Qiu, C., Ye, H., Cui, C., Song, C., Wang, K., Shi, J., et al. (2021) · Biomarkers in Medicine · doi:10.2217/bmm-2021-0327 · Cited by 7
Lim, G. E. H., Tang, A. S. P., Chin, Y. H., Yong, J. N., Tan, D. J. H., Tay, P. W. L., Chan, Y. Y., Lim, D. M. W., Yeo, J. W., Chan, K. E., et al. (2022) · PLoS ONE · doi:10.1371/journal.pone.0278326 · Cited by 8
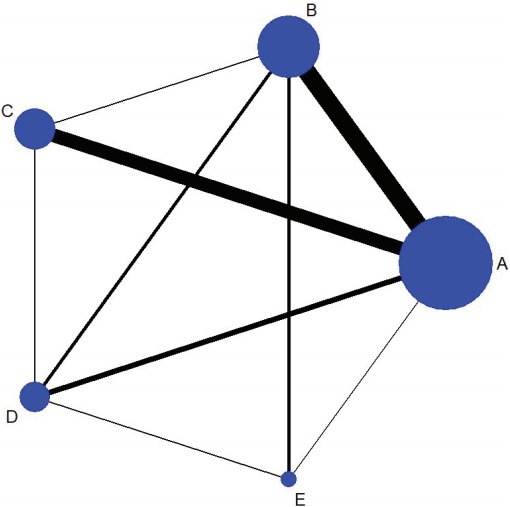
“A network diagram was plotted, and the thickness of each line represents the number of studies included in the analysis [33].”
BackgroundJin, H., Deng, Z., Sun, J., Vithran, D. T. A., Xiao, W., & Li, Y. (2024) · Burns & Trauma · doi:10.1093/burnst/tkad052 · Cited by 7
“The study thus provides a comprehensive overview of the current evidence on surgical interventions for mRCTs and help with the making of evidence-based decisions [33].”
BackgroundTaglieri, N., Bruno, A. G., Reggiani, M. L. B., D’Angelo, E. C., Ghetti, G., Bruno, M., Palmerini, T., Rapezzi, C., Galiè, N., & Saia, F. (2020) · International Journal of Cardiology · doi:10.1016/j.ijcard.2020.01.054 · Cited by 7
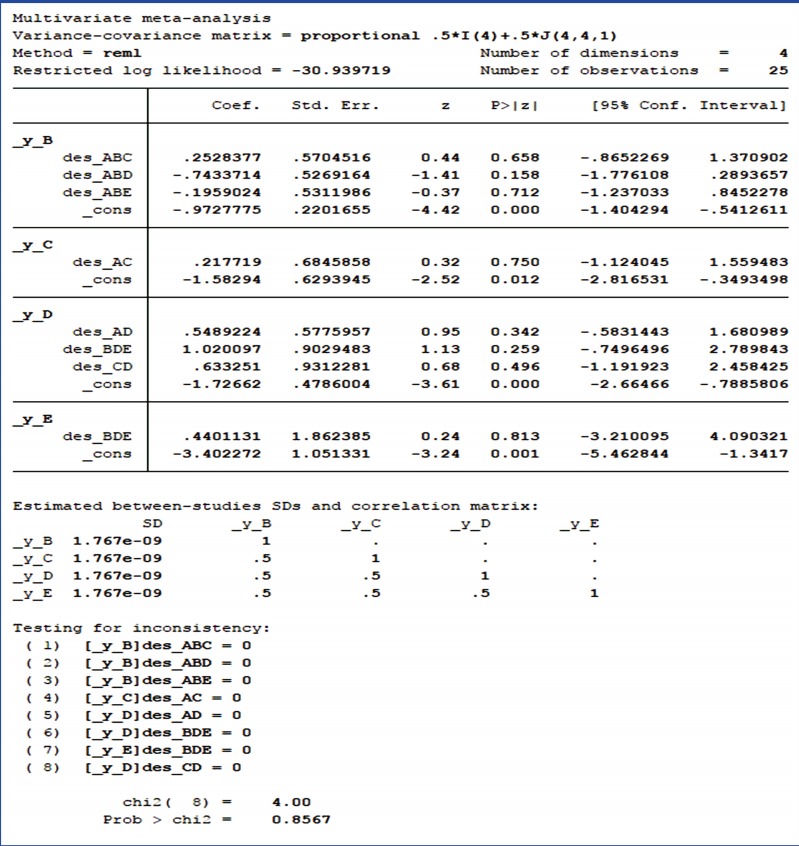
“Statistical disagreement of direct and indirect evidence, known as inconsistency, was evaluated by means of both a global approach, via the Wald test, and a local node-splitting approach[15].”
MethodLiu, Z., & Dou, H. (2022) · Journal of Healthcare Engineering · doi:10.1155/2022/2712403 · Cited by 7
RetractedWu, C., Chen, B., Yu, J., Zhang, Q., & Piao, C. (2025) · International Journal of Endocrinology · doi:10.1155/ije/6658512 · Cited by 6
“Funnel plots and Egger’s test were used to jointly evaluate publication bias using Stata 14.0 software [23].”
InfluentialZhao, K., Li, Y., Wang, P., & Zhang, P. (2025) · Frontiers in Psychiatry · doi:10.3389/fpsyt.2025.1601765 · Cited by 8
“This study was analyzed using Stat а 17.0 software (21).”
InfluentialJiang, L., Ding, H., Lee, D., & Chun, B. (2025) · Biomedicines · doi:10.3390/biomedicines13102548 · Cited by 6
“If the 95% confidence interval (CI) crossed 0, the effect was not significant; otherwise, a significant positive or negative effect was inferred [31].”
Tan, H., Yan, Z., Shao, C., & Lin, Y. (2026) · Frontiers in Physiology · doi:10.3389/fphys.2026.1769079 · Cited by 6
“The global inconsistency test adopts the inconsistency model, and if the result is not significant (p > 0.05), the consistency model is used for estimation (Shim et al., 2017).”
InfluentialXing, X., Shang, X., Deng, X., Guo, K., Fenfen, E., Zhou, L., Wang, Y., Yang, C., Yang, K., & Li, X. (2023) · Journal of Evidence-Based Medicine · doi:10.1111/jebm.12570 · Cited by 7
Wang, Z., Xu, H. G., Wang, Z., Zhou, H., Zhang, L., Wang, Y., Li, M., & Zhou, Y. (2024) · Frontiers in Neurology · doi:10.3389/fneur.2024.1297767 · Cited by 6
Zhang, L., Xing, C., Yang, Y., Li, X., & Yuan, Y. (2025) · Frontiers in Endocrinology · doi:10.3389/fendo.2025.1560676 · Cited by 13
Li, Z., Li, Q., & Zhao, X. (2025) · Journal of Manufacturing Technology Management · doi:10.1108/jmtm-09-2024-0539 · Cited by 6
Park, J. M., Park, H.-J., Yoon, S. Y., Kim, Y. W., Shin, J. I., & Lee, S. C. (2025) · Journal of Clinical Medicine · doi:10.3390/jcm14196913 · Cited by 7
“All statistical analyses, including NMA, were performed using the network and network graphs packages in the STATA software (version 18.0; StataCorp, College Station, TX, USA) by applying a frequentist approach [19,21].”
InfluentialAguilera-Eguía, R. A., Pamela Serón, S., Gutiérrez-Arias, R. E., & Zaror, C. (2022) · BMJ Open · doi:10.1136/bmjopen-2022-065045 · Cited by 7
Pan, H. B., Cui, Y., Wu, Z. H., Meng, Y., Wang, T. M., Fu, Q., Chen, Q., Chen, Q. X., & Wang, B. (2024) · Advances in Skin & Wound Care · doi:10.1097/asw.0000000000000094 · Cited by 6
de Liyis, B. G., Hartawan, I. G. A. G. U., Widyadharma, I. P. E., Senapathi, T. G. A., & Mahadewa, T. G. B. (2024) · World Neurosurgery · doi:10.1016/j.wneu.2024.08.021 · Cited by 6
Bousi, S.-E., Zachiotis, M., Papapanou, M., Frountzas, M., Symeonidis, D., Raptis, D. G., Papaziogas, B., Toutouzas, K. G., Felekouras, E. S., & Schizas, D. (2024) · Journal of Clinical Medicine · doi:10.3390/jcm13216303 · Cited by 6
“A REVIEW 5 of 23 network meta-analysis of the conversion rate to OS outcomes was not applicable. to the node-spli tt ing method by Dias et al. [63–65].”
MethodHe, Z., Zhao, G., Li, C., Xing, Y., Xu, A., Yang, J., & Wang, R. (2024) · BMJ Open · doi:10.1136/bmjopen-2023-080186 · Cited by 7
“39 The application of this statistical method is very developed in the medical and health fields and is now gaining attention in the field of PA.”
Liu, Y., Yang, S., Jiang, A.-M., Zou, D., Chen, Z.-Y., & Su, N. (2025) · Frontiers in Endocrinology · doi:10.3389/fendo.2024.1453067 · Cited by 5
“…treatment of T1DM with SGLT2 inhibitors was statistically analyzed by P=score to ranking probability of intervention drugs in main analysis by netmeta package in R. Direct and indirect comparisons were accomplished through the self-programmed routines of Stata and the netmeta package of R (10, 13).”
Cheng, Y., Yi, Y., Bo, S., Jun, M., & Ma, J. (2025) · Frontiers in Physiology · doi:10.3389/fphys.2025.1589200 · Cited by 7
Network meta-analysis of infliximab biosimilars for the treatment of rheumatoid arthritis
Hanrahan, C. T., & Lee, T. A. (2021) · American Journal of Health-System Pharmacy · doi:10.1093/ajhp/zxab042 · Cited by 6
“A qualitative synthesis of clinical and methodological heterogeneity was also conducted, as well as an assessment of transitivity.(17,18) Statistical analysis.”
MethodGraphical evaluation of evidence structure within a component network meta‐analysis
Li, H., Shih, M., & Tu, Y. (2023) · Research Synthesis Methods · doi:10.1002/jrsm.1623 · Cited by 7
“A node in this plot represents an intervention, and an edge represents direct evidence from a pairwise comparison.(2,3) The most popular statistical model for NMA is the contrast-based model, also widely known as the Lu & Ades model.”
MethodNaing, C. M., Poovorawan, Y., & Kew, S.-T. (2018) · BMC Infectious Diseases · doi:10.1186/s12879-018-3506-x · Cited by 8
Prevention of Stroke in Atrial Fibrillation After Coronary Stenting
Knijnik, L., Rivera, M., Blumer, V. L., Cardoso, R. N., Fernandes, A. D. F., Fernandes, G. C., Ferreira, T., Romano, J. G., Lambrakos, L. K., & Cohen, M. G. (2019) · Stroke · doi:10.1161/strokeaha.119.026078 · Cited by 6
Lyu, F. F., Ramoo, V., Chui, P. L., & Ng, C. G. (2024) · Orthopaedic Nursing · doi:10.1097/nor.0000000000001059 · Cited by 5
“Stata SE 16.0 (Shim et al., 2017) was used to perform this network meta-analysis and network diagrams.”
InfluentialBangalore, S., Maqsood, M. H., Bakris, G. L., Rao, S. V., & Messerli, F. H. (2024) · Journal of Hypertension · doi:10.1097/hjh.0000000000003909 · Cited by 6
Deng, Z., Zeng, D., Zhang, Y., Jia, D., & Huang, X. (2025) · Journal of Clinical Nursing · doi:10.1111/jocn.70067 · Cited by 5
Li, Z., Luo, S., Bai, X., Huang, L., Guo, H., Chen, S., & Wang, D. (2025) · PeerJ · doi:10.7717/peerj.19839 · Cited by 5
“05) ( Shim et al., 2017 ).”
Non-surgical treatments for post-burn scars: A network meta-analysis
Yang, X., Li, R., Mao, X., Gong, S., Fan, Y., Xu, C.-Y., Wen, Q., Xu, X., & Li, W. (2025) · PLoS ONE · doi:10.1371/journal.pone.0330428 · Cited by 5
“A frequentist NMA was conducted in this study by use of Stata (version 15.0, Stata Corporation) [25].”
InfluentialKong, Q., Huang, K., Li, S., Li, X., Han, R., Yang, H., Pu, Y., Chen, L., & Jia, Y. (2025) · Ageing Research Reviews · doi:10.1016/j.arr.2025.102890 · Cited by 5
de Liyis, B. G., Mahardana, M. D. P., Mahadewi, T. I. P., & Mahadewa, T. G. B. (2025) · Asian Spine Journal · doi:10.31616/asj.2025.0142 · Cited by 5
“18.0 (Stata Corp., College Station, TX, USA), with statistical significance defined as p 0.05 [20].”
InfluentialShu, X., Li, S., Pan, Z., Peng, H., Zhou, J., wang, C., & Xiang, M.-F. (2025) · International Journal of Nursing Studies · doi:10.1016/j.ijnurstu.2025.105245 · Cited by 5
Pan, X., Tang, M., Zhao, X., Yu, H., Huang, J., & Liang, P. (2025) · BMC Anesthesiology · doi:10.1186/s12871-025-03365-8 · Cited by 5
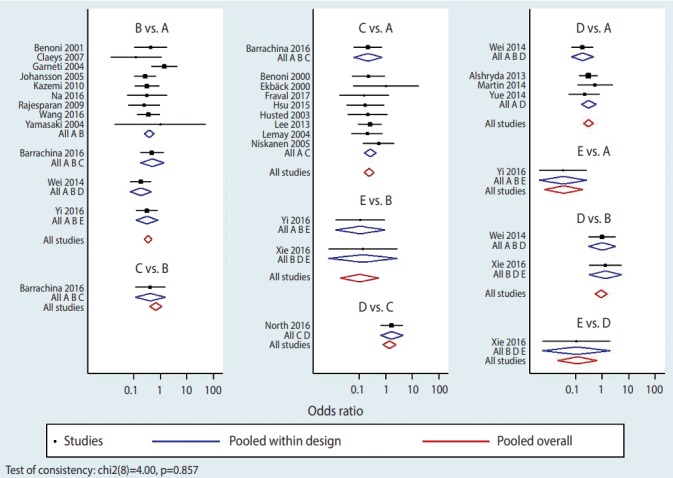
“Secondly, we conducted a frequentist random-effects network meta-analysis and created a corresponding forest plot [24].”
Xu, H., Song, L., Ma, Y., Zhao, S., Yu, S., Yu, Y., Lu, H., & Cui, X. (2025) · Medicine · doi:10.1097/md.0000000000045662 · Cited by 8
“Finally, a comparison-adjusted funnel plot was generated by STATA 15.0 [18] (Stata Corporation, College Station) to assess publication bias.”
InfluentialZhao, S., Jiang, H., Li, J., Yang, G., Zhang, D., Wei, X., & Feng, X. (2025) · General Hospital Psychiatry · doi:10.1016/j.genhosppsych.2025.11.009 · Cited by 6
Interventions for treating urinary incontinence in older women: a network meta-analysis
Vesentini, G., O’Connor, N., Berre, M. L., Nabhan, A. F., Wagg, A., Wallace, S. A., & Dumoulin, C. L. (2025) · Cochrane Database of Systematic Reviews · doi:10.1002/14651858.cd015376.pub2 · Cited by 7
Kim, J., Stybayeva, G., & Hwang, S. H. (2025) · Allergy Asthma and Immunology Research · doi:10.4168/aair.2025.17.6.692 · Cited by 6
Effectiveness of aerobic exercise in fibromyalgia: A systematic review and network meta-analysis
Yuan, W., Yan, P., Gao, F., Liu, N., & Zou, Y. (2026) · Complementary Therapies in Medicine · doi:10.1016/j.ctim.2026.103352 · Cited by 6
Kunze, K. N., Kay, J., Pareek, A., Dahmen, J., Chahla, J. A., Nho, S. J., Williams, R. J., de SA, D. L., & KARLSSON, J. L. (2023) · Knee Surgery Sports Traumatology Arthroscopy · doi:10.1007/s00167-023-07419-7 · Cited by 6
“Underlying the foundation of all network meta-analyses is the assumption that transitivity is held true for every included indirect comparison [14].”
BackgroundXu, Y., Cao, S., Wang, S.-F., Hou, X.-L., Guo, S., & Gou, X. (2023) · Medicine · doi:10.1097/md.0000000000035129 · Cited by 5
“[11,12] Therefore, the purpose of this study was to evaluate the clinical effectiveness of various CPMs in combination with CDs and to provide further evidence for rational selection.”
Liang, Z., Juan, W., Tianrui, F., Chen, Y., Zhou, Z., Zhou, Y., Weigang, Y., & Fenghong, C. (2024) · Critical Reviews in Oncology/Hematology · doi:10.1016/j.critrevonc.2024.104273 · Cited by 5
Chen, Q., Kan, M., Jiang, X., Liu, H., Zhang, D., Lin, Y., Xu, Q., & Bi, H. (2024) · BMJ Open · doi:10.1136/bmjopen-2023-080289 · Cited by 5
Sharifnia, A. M., Chu, G., Zhang, X., Green, H., & Fernandez, R. S. (2024) · Clinical Kidney Journal · doi:10.1093/ckj/sfae334 · Cited by 7
Chen, Y., Zhang, X., Bi, J., & Wang, J. (2025) · Academic Radiology · doi:10.1016/j.acra.2025.01.011 · Cited by 5
Wang, Z., Deng, Y.-L., Zhou, T.-Y., Liu, Y., & Cao, Y. (2025) · Frontiers in Pharmacology · doi:10.3389/fphar.2025.1573034 · Cited by 6
Chen, J., Lv, M., Jiang, S., Wu, S., Xu, W., Qian, J., Zeng, Z., Chen, M., Fang, Z., & Zhang, J. (2022) · Vascular Medicine · doi:10.1177/1358863x221115213 · Cited by 5
Krishnamoorthy, Y., Elangovan, V., & Rajaa, S. (2023) · Nicotine & Tobacco Research · doi:10.1093/ntr/ntad076 · Cited by 5
Wang, C., Zhang, Q., Zhang, L., Zhao, D., Xu, Y., Liu, Z., Wu, C., Wu, S., Yong, M., & Wu, L. (2024) · Frontiers in Neuroscience · doi:10.3389/fnins.2024.1352212 · Cited by 7
“We used Stata (version 17.0) to perform the NMA and produce various charts, such as network meta-analysis diagrams of eligible comparisons, surface under the cumulative ranking area (SUCRA), funnel plot of publication bias, etc (Shim et al., 2017).”
MethodInfluentialCao, P., Cai, Y., Zhang, S., & Wan, Q. (2020) · Medicine · doi:10.1097/md.0000000000021169 · Cited by 5
Treatments for alopecia areata: a network meta-analysis
Candia, M. P. N., Sánchez, G., Arévalo-Rodríguez, I., Vañó-Galván, S., Rodriguez, M. G. U., Giraldo, L., Saceda‐Corralo, D., Tobı́as, A., Tomlinson, J., Ortega-Quijano, D., et al. (2020) · Cochrane Database of Systematic Reviews · doi:10.1002/14651858.cd013719 · Cited by 5
Comparison of different probiotics in the treatment of acute diarrhea in children
Feng, X., Zhuang, L., Chen, L., Zhao, H., Huang, R., & Guo, Z. (2022) · Medicine · doi:10.1097/md.0000000000028899 · Cited by 5
Wu, L., Jing, S., Li, N., Cao, D., Pei, F., Luo, Y., Chen, X., Huang, Y., & Zeng, C. C. (2025) · Frontiers in Pharmacology · doi:10.3389/fphar.2025.1484325 · Cited by 4
Zhao, P., He, Y., Li, M., Wang, J., Wang, R., & Cui, X. (2025) · PM&R · doi:10.1002/pmrj.13417 · Cited by 6
Wang, Z., Li, J., Wang, L., & Wei, Q. (2025) · Psychiatry Research · doi:10.1016/j.psychres.2025.116665 · Cited by 5
Li, L., Li, Q., Wang, J., Fu, Q., & Chi, M. (2025) · BMC Psychiatry · doi:10.1186/s12888-025-07227-y · Cited by 6
“This method also allows for the integration of prior information and performs well with smaller samples, offering a more flexible and comprehensive approach to evidence synthesis [58].”
Burgess, A., Chatfield, M. D., Hermith‐Ramirez, D., Jackman, M., Thorley, M., Reedman, S. E., Boyd, R. N., & Sakzewski, L. (2025) · Developmental Medicine & Child Neurology · doi:10.1111/dmcn.16476 · Cited by 4
Yang, Y., Chen, H., Tang, H., Kuang, H., Gou, Y., & Zhao, H. (2025) · Frontiers in Endocrinology · doi:10.3389/fendo.2025.1602710 · Cited by 4
Huang, T., Liao, X., Zhang, Y., Wang, P., Li, P., Fang, J., & Shao, X. (2025) · Medicine · doi:10.1097/md.0000000000044372 · Cited by 5
“[46,47] When heterogeneity was observed, we performed sensitivity analysis to identify contributing studies and assessed potential factors according to their characteristics.”
Cho, S., Bang, H., Shin, S., Kim, H., Park, S., Lee, P. S., & Lee, E. (2025) · Medicina · doi:10.3390/medicina61101728 · Cited by 4
“A frequentist network meta-analysis (NMA) was conducted using the “netmeta” package in R version 4.4.2 (R Foundation for Statistical Computing, Vienna, Austria) and the “network” package in STATA/SE 19 (StataCorp, College Station, TX, USA) [18,19].”
InfluentialKong, L., Yu, C., Wang, C., & Meng, Z. (2025) · PeerJ · doi:10.7717/peerj.20336 · Cited by 4
Effects of SAQ, HIIT, and SSG training on sprint and COD performance in soccer players
Niu, X., Liu, F., Liu, L., Zhou, Z., & Chen, Y. (2025) · Kinesiology · doi:10.26582/k.57.2.10 · Cited by 4
“To accommodate clinical and methodological heterogeneity, a random-effects model was adopted, yielding more conservative confidence intervals (Shim, et al., 2017).”
InfluentialLiu, Y., Ren, T., Wang, X., Wang, Y., Tang, L., & Cao, W. (2026) · Frontiers in Oncology · doi:10.3389/fonc.2025.1713163 · Cited by 5
Yu, T., Metelli, S., Papakonstantinou, T., & Chaimani, A. (2026) · Research Synthesis Methods · doi:10.1017/rsm.2026.10074 · Cited by 8
“2 Additionally, even though several software tools are available for conducting NMAs, 8,9 they do not offer visualizations that allow to easily make the connection between data and results.”
Intracoronary Imaging-Guided Percutaneous Coronary Intervention
Bangalore, S., Maqsood, M. H., Zhang, R. S., Rao, S. V., Mohamed, A. E., Christiansen, E. H., Andreasen, L. N., Abomohsen, M., Maehara, A., Mamas, M. A., et al. (2026) · Journal of the American College of Cardiology · doi:10.1016/j.jacc.2026.08.008 · Cited by 4
Sivaramakrishnan, G., & Sridharan, K. (2024) · Evidence-Based Dentistry · doi:10.1038/s41432-024-01064-w · Cited by 4
“Additionally, it enables the ranking of treatments, helping to identify the most effective options among a range of alternatives 5 .”
InfluentialFeng, Z., Wu, S., Hu, H. X., Long, H., Zhou, L., & Shen, M. (2024) · Journal of Orthopaedic Surgery and Research · doi:10.1186/s13018-024-05129-5 · Cited by 4
“…on such complex cases involving multiple pathologies and combined treatment modalities synthesizes the most comprehensive evidence from randomized controlled trials, enabling a more robust and precise identification of the optimal treatment choice among various treatment options for patients [60].”
BackgroundTong, Y., Li, P., Liu, W., Tan, S., Wang, X., Zhang, Y., Ran, Y., Fang, Y., Fan, Y., Wei, T., et al. (2025) · Surgical Endoscopy · doi:10.1007/s00464-025-11568-w · Cited by 5
“The funnel plots were generated using Stata/MP software version 14.0 (Stata Corp LP, College Station, Texas, USA) [20].”
InfluentialLiu, H., Li, L., Wang, X., Zhu, X., Sun, L. L., Zhu, C., Min, H., & Gu, C. (2025) · International Journal of Nursing Sciences · doi:10.1016/j.ijnss.2025.04.006 · Cited by 5
“The user-friendly nature and minimal restrictions of this method enhance its accessibility for researchers engaged in network meta-analyses, as demonstrated by Shim et al. [27].”
Li, X., Gao, M. Y., & Hua, J. (2025) · BMC Cardiovascular Disorders · doi:10.1186/s12872-025-04745-1 · Cited by 4
“For effect size evaluation, a 95% confidence interval (CI) containing zero indicated no statistically significant difference, while a CI with both limits above or below zero suggested a significant positive or negative effect, respectively [26].”
Huang, Z., Jian, S., Li, D., Chen, C., & Wang, D. (2025) · Journal of Exercise Science & Fitness · doi:10.1016/j.jesf.2025.07.006 · Cited by 4
“The systematic review and network meta-analysis was performed according to the current operation guidelines 27 and based on the frequentist framework.”
Li, H., Lin, X., Wu, X., & Huang, R. (2025) · BMC Cardiovascular Disorders · doi:10.1186/s12872-025-05084-x · Cited by 4
“Consistency tests were performed by calculating the inconsistency factors (IFs) and their 95% confidence intervals for each closed loop, and if the inconsistency was not significant ( p > 0.05), the consistency model was used [34].”
InfluentialDuan, X.-L., Xiong, Q., & Chen, J.-W. (2025) · Geriatric Nursing · doi:10.1016/j.gerinurse.2025.103599 · Cited by 6
Delirium screening tools in the emergency department
Zhang, Q., Li, S., Chen, M., Yang, Q., Cao, X. Q., Ge, L., & Di, B. (2021) · Medicine · doi:10.1097/md.0000000000024779 · Cited by 4
Tang, M., Ge, J., Sun, K., Cui, B., Guan, Y., & Wang, J. (2021) · Seminars in Dialysis · doi:10.1111/sdi.13021 · Cited by 6
“The analysis evaluates the relative ranking of the effectiveness and safety of interventions by combining direct and indirect evidence.(26,27) In this paper, three methods of Global inconsistency, Local inconsistency (node-splitting method), and loop inconsistency were used to evaluate inconsistency.”
MethodLi, W., Sun, L., & Yan, S. (2024) · Frontiers in Cardiovascular Medicine · doi:10.3389/fcvm.2024.1375040 · Cited by 5
Wang, S.-Q., Guo, N.-Y., Liu, W., Huang, H., Xu, B., & Wang, J. (2025) · Journal of Orthopaedic Surgery and Research · doi:10.1186/s13018-025-05477-w · Cited by 5
“The consistency model was used when the inconsistency was nonsignificant ( p > 0.05) [20].”
InfluentialMirzaei, S. K., Hatami, F., Safi, S., Khorrami, Z., Shadmani, F. K., Moshtaghion, S. M., & Ahmadieh, H. (2025) · Survey of Ophthalmology · doi:10.1016/j.survophthal.2025.02.005 · Cited by 4
Luo, H., Zheng, W., Yan, Q., Wang, B., Ye, B., Deng, S., He, F., Yang, X., & Wang, X. (2020) · Medicine · doi:10.1097/md.0000000000020500 · Cited by 4
Metadata
- Authors
- Shim, S., Yoon, B.-H., Shin, I.-S., & Bae, J.-M.
- Affiliations
- Inje University (KR)
- Jeonju University (KR)
- Jeju National University (KR)
- Corresponding author
- Bae, Jong-Myon
- Venue
- Epidemiology and Health
- Publisher
- Korean Society of Epidemiology
- Published
- 2017-10-27
- Volume
- 39
- Pages
- e2017047
- ISSN
- 1225-3596 (ISSN-L)
- 2092-7193
- PMC
- PMC5733388
- OpenAlex
- W2766765254
- Cited by
- 656
- References
- 46
- Citations by year
- 2026: 111 · 2025: 130 · 2024: 124 · 2023: 80 · 2022: 78 · 2021: 59 · 2020: 52 · 2019: 18 · 2018: 4
- FWCI
- 4.99
- Type
- journal article
- Language
- en
- Open access
- diamond
- doi.org
- Licence
- cc-by
- Locations
- Epidemiology and Health (publishedVersion, cc-by)
- PubMed Central (publishedVersion, cc-by)
- PubMed (publishedVersion)
- DOAJ (DOAJ: Directory of Open Access Journals) (submittedVersion, cc-by-sa)
- Topics
- Social Sciences › Decision Sciences › Statistics, Probability and Uncertainty › Meta-analysis and systematic reviews
- Social Sciences › Sociology and Political Science › Delphi Technique in Research
- Physical Sciences › Mathematics › Statistics and Probability › Statistical Methods in Clinical Trials
- Keywords
- network meta-analysis, Stata, comparative effectiveness, network geometry, consistency assumption, transitivity, publication bias, effect modifiers, evidence synthesis, healthcare decision-making
- MeSH terms
- Network Meta-Analysis as Topic, Humans, Software, Treatment Outcome, Biostatistics
About these checks
Registry, retraction, Cites and statistics results are computed, not judged, with one exception: a printed reference that no index lists is read once by a model before it counts as a citation error. Claims are extracted by a model and kept only when their quote appears verbatim in the text; each cited source is then checked, with a model’s help, for whether it says what the claim relies on. Those verdicts can be wrong — read the claim’s quote and the cited source before relying on one.
Statistics and arithmetic are recomputed, not judged.
Confidence bands are shown only for fields calibrated on our annotated test set. None is calibrated yet, so no band is shown.
What counts as a claim ›How we measure confidence ›How we check this ›
Are you an author, or do you see a problem with this page? Request a review
Data sources
Bibliographic data: Semantic Scholar, OpenAlex, Crossref.
Contains information from the Semantic Scholar Academic Graph Datasets, made available under the ODC Attribution License (ODC-BY 1.0).
Semantic Scholar’s data is described in: Kinney, R., et al. (2023). The Semantic Scholar Open Data Platform. arXiv:2301.10140.
