

The DOI matches its Crossref record; 299 of the 307 references it cites were found in a registry or an index; none of the 191 sources its claims cite is checked for support yet.
Nutrition, insulin resistance and dysfunctional adipose tissue determine the different components of metabolic syndrome
Open accessAbstract
Obesity is an excessive accumulation of body fat that may be harmful to health. Today, obesity is a major public health problem, affecting in greater or lesser proportion all demographic groups. Obesity is estimated by body mass index (BMI) in a clinical setting, but BMI reports neither body composition nor the location of excess body fat. Deaths from cardiovascular diseases, cancer and diabetes accounted for approximately 65% of all deaths, and adiposity and mainly abdominal adiposity are associated with all these disorders. Adipose tissue could expand to inflexibility levels. Then, adiposity is associated with a state of low-grade chronic inflammation, with increased tumor necrosis factor-α and interleukin-6 release, which interfere with adipose cell differentiation, and the action pattern of adiponectin and leptin until the adipose tissue begins to be dysfunctional. In this state the subject presents insulin resistance and hyperinsulinemia, probably the first step of a dysfunctional metabolic system. Subsequent to central obesity, insulin resistance, hyperglycemia, hypertriglyceridemia, hypoalphalipoproteinemia, hypertension and fatty liver are grouped in the so-called metabolic syndrome (MetS). In subjects with MetS an energy balance is critical to maintain a healthy body weight, mainly limiting the intake of high energy density foods (fat). However, high-carbohydrate rich (CHO) diets increase postprandial peaks of insulin and glucose. Triglyceride-rich lipoproteins are also increased, which interferes with reverse cholesterol transport lowering high-density lipoprotein cholesterol. In addition, CHO-rich diets could move fat from peripheral to central deposits and reduce adiponectin activity in peripheral adipose tissue. All these are improved with monounsaturated fatty acid-rich diets. Lastly, increased portions of ω-3 and ω-6 fatty acids also decrease triglyceride levels, and complement the healthy diet that is recommended in patients with MetS.
Overview
AI snapshot
Written from the paper’s full text.
TL;DR
This review argues that central obesity, dysfunctional adipose tissue, insulin resistance, and dietary macronutrient quality jointly determine the components of metabolic syndrome (MetS). It synthesizes evidence that MUFA-rich, low-GI/high-fiber, and long-chain n-3 PUFA diets improve insulin sensitivity, lipids, adipokines, and MetS prevalence.
Key findings
- Adipose tissue dysfunction links central obesity to MetS: low-grade inflammation with increased TNF-α and IL-6, decreased adiponectin, increased leptin/leptin resistance, ectopic fat/lipotoxicity, and insulin resistance/hyperinsulinemia; MetS clusters central obesity, hyperglycemia, hypertriglyceridemia, hypoalphalipoproteinemia, hypertension, and fatty liver.
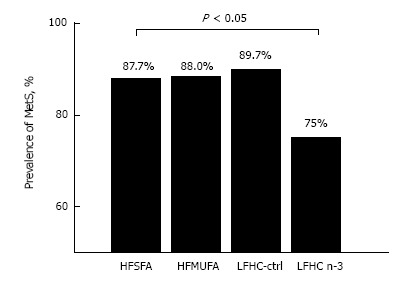
- High-carbohydrate diets increase postprandial insulin and glucose, raise triglyceride-rich lipoproteins, lower HDL-C (approximately 11% in one cited study), shift fat centrally, and reduce adiponectin; MUFA-rich diets improve insulin sensitivity, postprandial glucose/insulin, GLP-1, and HDL-C. In LIPGENE, an LFHCC n-3 diet reduced MetS prevalence by 20.5% vs HSFA (10.6%), HMUFA (12%), or LFHCC (10.4%) diets.
- Fiber and omega-3 effects: the ADA recommends 20-35 g/d dietary fiber; higher soluble fiber improves glycemic control, hyperinsulinemia, and plasma lipids in type 2 diabetes. Adiponectin may increase by 14%-60% with seafood/omega-3, 18%-48% with weight loss plus activity, and 60%-115% with fiber supplementation.
- Epidemiology: MetS prevalence rose from 28% (NHANES 1988-1994) to 32% (NHANES 1999-2000); it is estimated at 11% of men and 18% of women aged 20-39, rising to 40% of men and 46% of women older than 60. Deaths from CVD, cancer, and diabetes accounted for approximately 65% of all deaths; obesity may account for up to 14% of cancer in men and 20% in women, and BMI ≥ 40 kg/m² increases cancer death risk by 52% in men and 62% in women.
Methods
- Narrative review; no systematic search strategy, inclusion/exclusion criteria, or meta-analytic methods are stated. It synthesizes mechanistic, epidemiological, and clinical trial literature on obesity, adipose tissue, insulin resistance, MetS, and nutrition.
- Cites specific human intervention studies, including KANWU (162 healthy subjects, 3 mo, SAFA vs MUFA diets), LIPGENE (MetS subjects n = 472 from 8 European countries, 12 wk, four diets), and small postprandial/gene-expression studies (e.g., 11 insulin-resistant subjects; NAFLD n = 9). No new primary data collection is described beyond summarizing prior work.
Limitations
- Stated in the paper: epidemiological evidence on fat amount/type and weight gain is contradictory; residual confounding (e.g., cholesterol-lowering therapy, trans fat intake, limited variation in SFA and PUFA intake) may explain findings. Intervention studies on GI/GL have not had clarifying results, and more specific dietary fat modifications may be necessary, perhaps with dietary restriction and weight loss.
- Evident from the text: this is a narrative review without systematic methods or formal risk-of-bias assessment; conclusions rely on heterogeneous cited studies, some very small (n = 9-15) and mechanistic, so causal inference from observational associations is limited.
Model-written summary. Check it against the paper before relying on it.
Integrity signals
Registry
Cites
Statistics
Figures
Verification
Claims the paper makes
131 Not checked yet · 18 Own interpretation · 17 No basis given · 5 Own result · 2 Own method
In the paper
“Therefore, in subjects selected with central obesity, after a short intervention with a low-fat carbohydrate-rich diet, patients grouped according to insulin-resistant state (Matsuda < 4) showed a redistribution of their body fat from peripheral adipose tissue toward central body deposits as compared with isocaloric MUFA-rich diet (Table 1)[52].”
§ Nutrition, insulin resistance and dysfunctional adipose tissue determine the different components of metabolic syndrome > EFFECTS OF NUTRITION ON METS COMPONENTS > Effects of nutrition on central fat distribution
What the sources say
- Not checked yetcites [52] Paniagua JA Gallego de la Sacristana A Romero I Vidal-Puig A Latre JM Sanchez E Perez-Martinez P Lopez-Miranda J Perez-Jimenez F Monounsaturated fat-rich diet prevents central body fat distribution and decreases postprandial adiponectin expression induced by a carbohydrate-rich diet in insulin-resistant subjects Diabetes Care 2007 30 1717 1723 17384344
plaindirect- Asserted: passes — The authors put it forward as true.
- Checkable: passes — It can be checked against evidence.
- Load-bearing: passes — The paper’s conclusions depend on it.
- Based: passes — The paper gives a reason why it holds.
In the paper
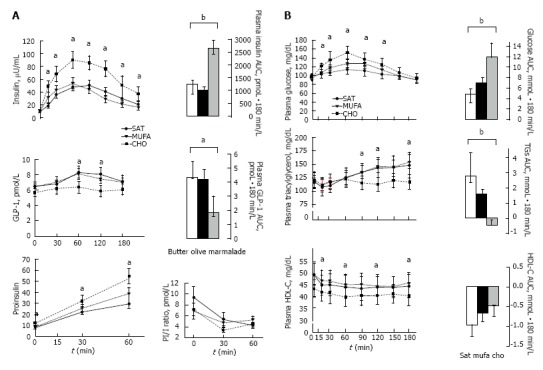
“We have previously found that following the intake of a standard breakfast, the glucagon like peptide-1 (GLP-1) postprandial release was significantly raised in those patients who had eaten an isocaloric olive oil-enriched meal compared to when they had a CHO-rich meal, further supporting the idea that monounsaturated (MUFA) fatty acids may act as secretagogues of GLP-1 (Figure 5)[237].”
§ Nutrition, insulin resistance and dysfunctional adipose tissue determine the different components of metabolic syndrome > EFFECTS OF NUTRITION ON METS COMPONENTS > Effects of nutrition on obesity
What the sources say
- Not checked yetcites [237] Paniagua JA de la Sacristana AG Sánchez E Romero I Vidal-Puig A Berral FJ Escribano A Moyano MJ Peréz-Martinez P López-Miranda J A MUFA-rich diet improves posprandial glucose, lipid and GLP-1 responses in insulin-resistant subjects J Am Coll Nutr 2007 26 434 444 17914131
plaindirect- Asserted: passes — The authors put it forward as true.
- Checkable: passes — It can be checked against evidence.
- Load-bearing: unclear — It is unclear whether the paper’s conclusions depend on it.
- Based: passes — The paper gives a reason why it holds.
A result the paper reports from its own data — it cites no other source for it, so there is none to check. The quote shows it is in the paper.
In the paper
“Our results indicate that in early stages of the disease, changes in REE, RQ, and CHO, fat and protein oxidation could not be differentiated between IR and IS patients.”
§ Nutrition, insulin resistance and dysfunctional adipose tissue determine the different components of metabolic syndrome > EFFECTS OF NUTRITION ON METS COMPONENTS > Effect of nutrition on oxidative stress
hedged- Asserted: passes — The authors put it forward as true.
- Checkable: passes — It can be checked against evidence.
- Load-bearing: passes — The paper’s conclusions depend on it.
- Based: passes — The paper gives a reason why it holds.
A result the paper reports from its own data — it cites no other source for it, so there is none to check. The quote shows it is in the paper.
In the paper
“We have found that p65, IκBα, MCP-1 and IL-1β gene transcripts were induced during the postprandial response, also with independence of fat intake.”
§ Nutrition, insulin resistance and dysfunctional adipose tissue determine the different components of metabolic syndrome > EFFECTS OF NUTRITION ON METS COMPONENTS > Effect of nutrition on oxidative stress
plaindirect- Asserted: passes — The authors put it forward as true.
- Checkable: passes — It can be checked against evidence.
- Load-bearing: passes — The paper’s conclusions depend on it.
- Based: passes — The paper gives a reason why it holds.
- Rests on an assumption: MetS patients normally present a higher inflammatory state in adipose tissue, which is increased during the postprandial response, independent of the fat eaten.
A result the paper reports from its own data — it cites no other source for it, so there is none to check. The quote shows it is in the paper.
In the paper
“In addition, the increase in energy intake in IR patients seemed to be primarily related to their apparent preference for higher saturated fat and refined cereal, sugar and soft drink intake.”
§ Nutrition, insulin resistance and dysfunctional adipose tissue determine the different components of metabolic syndrome > EFFECTS OF NUTRITION ON METS COMPONENTS > Effect of nutrition on oxidative stress
hedgedconditional- Asserted: passes — The authors put it forward as true.
- Checkable: passes — It can be checked against evidence.
- Load-bearing: unclear — It is unclear whether the paper’s conclusions depend on it.
- Based: passes — The paper gives a reason why it holds.
In the paper
“Of note, IL-6 expression was only identify after the postprandial responses[272].”
§ Nutrition, insulin resistance and dysfunctional adipose tissue determine the different components of metabolic syndrome > EFFECTS OF NUTRITION ON METS COMPONENTS > Effect of nutrition on oxidative stress
What the sources say
- Not checked yetcites [272] Meneses ME Camargo A Perez-Martinez P Delgado-Lista J Cruz-Teno C Jimenez-Gomez Y Paniagua JA Gutierrez-Mariscal FM Tinahones FJ Vidal-Puig A Postprandial inflammatory response in adipose tissue of patients with metabolic syndrome after the intake of different dietary models Mol Nutr Food Res 2011 55 1759 1770 22144044
plain- Asserted: passes — The authors put it forward as true.
- Checkable: passes — It can be checked against evidence.
- Load-bearing: unclear — It is unclear whether the paper’s conclusions depend on it.
- Based: passes — The paper gives a reason why it holds.
- Rests on an assumption: MetS patients normally present a higher inflammatory state in adipose tissue, which is increased during the postprandial response, independent of the fat eaten.
None of the sources cited for this claim have been checked yet.
In the paper
““central obesity” is more strongly associated with metabolic complications linked to insulin resistance including diabetes[30,31].”
§ Nutrition, insulin resistance and dysfunctional adipose tissue determine the different components of metabolic syndrome > INTRODUCTION
What the sources say
- Not checked yetcites [30] Landin K Krotkiewski M Smith U Importance of obesity for the metabolic abnormalities associated with an abdominal fat distribution Metabolism 1989 38 572 576 2657328
- Not checked yetcites [31] Peiris AN Mueller RA Smith GA Struve MF Kissebah AH Splanchnic insulin metabolism in obesity. Influence of body fat distribution J Clin Invest 1986 78 1648 1657 3537010 PMC423938
boostedcorrelational- Asserted: passes — The authors put it forward as true.
- Checkable: passes — It can be checked against evidence.
- Load-bearing: unclear — It is unclear whether the paper’s conclusions depend on it.
- Based: passes — The paper gives a reason why it holds.
In the paper
“those with a waist-hip ratio higher to or equal than the average have in general an odds ratio of 3.0 (95%CI: 2.1-4.2) for ischemic cerebrovascular, even when BMI and other risk factors were adjusted[26].”
§ Nutrition, insulin resistance and dysfunctional adipose tissue determine the different components of metabolic syndrome > INTRODUCTION
What the sources say
- Not checked yetcites [26] Suk SH, Sacco RL, Boden-Albala B, Cheun JF, Pittman JG, Elkind MS, Paik MC; Northern Manhattan Stroke Study Abdominal obesity and risk of ischemic stroke: the Northern Manhattan Stroke Study Stroke 2003 34 1586 1592 12775882
plaincorrelational- Asserted: passes — The authors put it forward as true.
- Checkable: passes — It can be checked against evidence.
- Load-bearing: unclear — It is unclear whether the paper’s conclusions depend on it.
- Based: passes — The paper gives a reason why it holds.
None of the sources cited for this claim have been checked yet.
In the paper
“as well as with obesity, body fat distribution, hypertension, insulin resistance and hyperglycemia[16-18].”
§ Nutrition, insulin resistance and dysfunctional adipose tissue determine the different components of metabolic syndrome > INTRODUCTION
What the sources say
- Not checked yetcites [16] He FJ Li J Macgregor GA Effect of longer term modest salt reduction on blood pressure: Cochrane systematic review and meta-analysis of randomised trials BMJ 2013 346 f1325 23558162
- Not checked yetcites [17] Sacks FM Bray GA Carey VJ Smith SR Ryan DH Anton SD McManus K Champagne CM Bishop LM Laranjo N Comparison of weight-loss diets with different compositions of fat, protein, and carbohydrates N Engl J Med 2009 360 859 873 19246357 PMC2763382
- Not checked yetcites [18] Mozaffarian D Hao T Rimm EB Willett WC Hu FB Changes in diet and lifestyle and long-term weight gain in women and men N Engl J Med 2011 364 2392 2404 21696306 PMC3151731
plaincorrelational- Asserted: passes — The authors put it forward as true.
- Checkable: passes — It can be checked against evidence.
- Load-bearing: passes — The paper’s conclusions depend on it.
- Based: passes — The paper gives a reason why it holds.
In the paper
“adiposity is associated with a state of low-grade chronic inflammation, with increased tumor necrosis factor-α and interleukin-6 release”
- Also stated in: § Transcriptional signaling of adipocyte formation · plain
“The adipose tissue itself begins a slow process of low-level chronic inflammation (macrophages, lymphocytes, etc.) which increases local release of TNF-α and IL-6[166].”
§ Nutrition, insulin resistance and dysfunctional adipose tissue determine the different components of metabolic syndrome > Abstract
What the sources say
- Not checked yetcites [166] Vidal-Puig A Unger RH Special issue on lipotoxicity Biochim Biophys Acta 2010 1801 207 208 20045080
plaincorrelational- Asserted: passes — The authors put it forward as true.
- Checkable: passes — It can be checked against evidence.
- Load-bearing: passes — The paper’s conclusions depend on it.
- Based: passes — The paper gives a reason why it holds.
- Also stated in: § Transcriptional signaling of adipocyte formation · plain
- It may state two separate claims as one. 74
- Probably not a substantial claim. 51
A result the paper reports from its own data — it cites no other source for it, so there is none to check. The quote shows it is in the paper.
In the paper
“However, the higher waist-to-hip ratio early correlated negatively with CHO oxidation and directly with fat-oxidation”
§ Nutrition, insulin resistance and dysfunctional adipose tissue determine the different components of metabolic syndrome > EFFECTS OF NUTRITION ON METS COMPONENTS > Effect of nutrition on oxidative stress
plaincorrelational- Asserted: passes — The authors put it forward as true.
- Checkable: passes — It can be checked against evidence.
- Load-bearing: passes — The paper’s conclusions depend on it.
- Based: passes — The paper gives a reason why it holds.
It may state two separate claims as one.
In the paper
“In research, the percentage of body fat determined by hydrostatic weighing (body weight by immersion), is the gold standard[48].”
§ Nutrition, insulin resistance and dysfunctional adipose tissue determine the different components of metabolic syndrome > OBESITY ASSESSMENT
What the sources say
- Not checked yetcites [48] Ferland M Després JP Tremblay A Pinault S Nadeau A Moorjani S Lupien PJ Thériault G Bouchard C Assessment of adipose tissue distribution by computed axial tomography in obese women: association with body density and anthropometric measurements Br J Nutr 1989 61 139 148 2706220
plain- Asserted: passes — The authors put it forward as true.
- Checkable: passes — It can be checked against evidence.
- Load-bearing: fails — The paper’s conclusions may not depend on it.
- Based: passes — The paper gives a reason why it holds.
Probably not a substantial claim. The paper’s conclusions may not depend on it.
The paper states this without a source or data behind it here, so there is nothing to check it against. The quote shows it is in the paper.
In the paper
“Thus, dietary habits, a major factor in controlling obesity, are made up of environmental, cultural, economic and technological aspects.”
§ Nutrition, insulin resistance and dysfunctional adipose tissue determine the different components of metabolic syndrome > INTRODUCTION
plaindirect- Asserted: passes — The authors put it forward as true.
- Checkable: passes — It can be checked against evidence.
- Load-bearing: fails — The paper’s conclusions may not depend on it.
- Based: passes — The paper gives a reason why it holds.
Probably not a substantial claim. The paper’s conclusions may not depend on it.
None of the sources cited for this claim have been checked yet.
In the paper
“The relationship between BMI and a high mortality due to cancer in most specific sites[12,35] is well established.”
§ Nutrition, insulin resistance and dysfunctional adipose tissue determine the different components of metabolic syndrome > INTRODUCTION
What the sources say
- Not checked yetcites [12] Berrington de Gonzalez A Hartge P Cerhan JR Flint AJ Hannan L MacInnis RJ Moore SC Tobias GS Anton-Culver H Freeman LB Body-mass index and mortality among 1.46 million white adults N Engl J Med 2010 363 2211 2219 21121834 PMC3066051
- Not checked yetcites [35] Lew EA Garfinkel L Variations in mortality by weight among 750,000 men and women J Chronic Dis 1979 32 563 576 468958
boostedcorrelational- Asserted: passes — The authors put it forward as true.
- Checkable: passes — It can be checked against evidence.
- Load-bearing: fails — The paper’s conclusions may not depend on it.
- Based: passes — The paper gives a reason why it holds.
Probably not a substantial claim. The paper’s conclusions may not depend on it.
None of the sources cited for this claim have been checked yet.
In the paper
“Where levels of BMI are higher than 25 kg/m2 a direct relationship with high mortality due to CVD is well established[3,19-23].”
§ Nutrition, insulin resistance and dysfunctional adipose tissue determine the different components of metabolic syndrome > INTRODUCTION
What the sources say
- Not checked yetcites [3] Kopelman PG Obesity as a medical problem Nature 2000 404 635 643 10766250
- Not checked yetcites [19] Manson JE Willett WC Stampfer MJ Colditz GA Hunter DJ Hankinson SE Hennekens CH Speizer FE Body weight and mortality among women N Engl J Med 1995 333 677 685 7637744
- Not checked yetcites [20] Willett WC Manson JE Stampfer MJ Colditz GA Rosner B Speizer FE Hennekens CH Weight, weight change, and coronary heart disease in women. Risk within the ‘normal’ weight range JAMA 1995 273 461 465 7654270
- Not checked yetcites [21] Stevens J Plankey MW Williamson DF Thun MJ Rust PF Palesch Y O’Neil PM The body mass index-mortality relationship in white and African American women Obes Res 1998 6 268 277 9688103
- Not checked yetcites [22] Lindsted KD Singh PN Body mass and 26 y risk of mortality among men who never smoked: a re-analysis among men from the Adventist Mortality Study Int J Obes Relat Metab Disord 1998 22 544 548 9665675
- Not checked yetcites [23] Calle EE Thun MJ Petrelli JM Rodriguez C Heath CW Body-mass index and mortality in a prospective cohort of U.S. adults N Engl J Med 1999 341 1097 1105 10511607
boostedcorrelational- Asserted: passes — The authors put it forward as true.
- Checkable: passes — It can be checked against evidence.
- Load-bearing: fails — The paper’s conclusions may not depend on it.
- Based: passes — The paper gives a reason why it holds.
Probably not a substantial claim. The paper’s conclusions may not depend on it.
In the paper
“In the United States approximately the 70% of T2D prevalence could be attributed to overweight and obesity and, after 10 years, each kilogram gain from ideal body weight, raises the risk by 4.5%[10].”
§ Nutrition, insulin resistance and dysfunctional adipose tissue determine the different components of metabolic syndrome > INTRODUCTION
What the sources say
- Not checked yetcites [10] Eyre H Kahn R Robertson RM Preventing cancer, cardiovascular disease, and diabetes: a common agenda for theAmerican Cancer Society, the American Diabetes Association, and the American Heart Association CA Cancer J Clin 2004 54 190 207 15253917
hedgeddirect- Asserted: passes — The authors put it forward as true.
- Checkable: passes — It can be checked against evidence.
- Load-bearing: fails — The paper’s conclusions may not depend on it.
- Based: passes — The paper gives a reason why it holds.
Probably not a substantial claim. The paper’s conclusions may not depend on it. It may state two separate claims as one.
In the paper
“Recently, it has been observed that death attributed to factors related to high BMI is in fourth place behind deaths from high blood pressure, smoking, and unhealthy diets; and is ahead of deaths attributable to diabetes, physical inactivity, high salt intake, alcoholism and high blood cholesterol levels[13].”
§ Nutrition, insulin resistance and dysfunctional adipose tissue determine the different components of metabolic syndrome > INTRODUCTION
What the sources say
- Not checked yetcites [13] Ezzati M Riboli E Behavioral and dietary risk factors for noncommunicable diseases N Engl J Med 2013 369 954 964 24004122
plaindirect- Asserted: passes — The authors put it forward as true.
- Checkable: passes — It can be checked against evidence.
- Load-bearing: fails — The paper’s conclusions may not depend on it.
- Based: passes — The paper gives a reason why it holds.
Probably not a substantial claim. The paper’s conclusions may not depend on it. It may state two separate claims as one.
None of the sources cited for this claim have been checked yet.
In the paper
“These can be modified by agricultural policies that govern prices, extending the range and availability of food and regulating beneficial or harmful dietary components[41,42].”
§ Nutrition, insulin resistance and dysfunctional adipose tissue determine the different components of metabolic syndrome > INTRODUCTION
What the sources say
- Not checked yetcites [41] Ezzati M Riboli E Can noncommunicable diseases be prevented? Lessons from studies of populations and individuals Science 2012 337 1482 1487 22997325
- Not checked yetcites [42] Mozaffarian D Afshin A Benowitz NL Bittner V Daniels SR Franch HA Jacobs DR Kraus WE Kris-Etherton PM Krummel DA Population approaches to improve diet, physical activity, and smoking habits: a scientific statement from the American Heart Association Circulation 2012 126 1514 1563 22907934 PMC3881293
plaindirect- Asserted: passes — The authors put it forward as true.
- Checkable: passes — It can be checked against evidence.
- Load-bearing: fails — The paper’s conclusions may not depend on it.
- Based: passes — The paper gives a reason why it holds.
Probably not a substantial claim. The paper’s conclusions may not depend on it.
None of the sources cited for this claim have been checked yet.
In the paper
“The age-standardized rate of death from any cause was generally lowest among subjects with an optimal BMI of 22.5 to 24.9 kg/m2[10-12].”
§ Nutrition, insulin resistance and dysfunctional adipose tissue determine the different components of metabolic syndrome > INTRODUCTION
What the sources say
- Not checked yetcites [10] Eyre H Kahn R Robertson RM Preventing cancer, cardiovascular disease, and diabetes: a common agenda for theAmerican Cancer Society, the American Diabetes Association, and the American Heart Association CA Cancer J Clin 2004 54 190 207 15253917
- Not checked yetcites [11] Pischon T Boeing H Hoffmann K Bergmann M Schulze MB Overvad K van der Schouw YT Spencer E Moons KG Tjønneland A General and abdominal adiposity and risk of death in Europe N Engl J Med 2008 359 2105 2120 19005195
- Not checked yetcites [12] Berrington de Gonzalez A Hartge P Cerhan JR Flint AJ Hannan L MacInnis RJ Moore SC Tobias GS Anton-Culver H Freeman LB Body-mass index and mortality among 1.46 million white adults N Engl J Med 2010 363 2211 2219 21121834 PMC3066051
plaincorrelational- Asserted: passes — The authors put it forward as true.
- Checkable: passes — It can be checked against evidence.
- Load-bearing: fails — The paper’s conclusions may not depend on it.
- Based: passes — The paper gives a reason why it holds.
Probably not a substantial claim. The paper’s conclusions may not depend on it.
A conclusion the paper draws from its own results — it cites no other source for it, so there is none to check. The quote shows it is in the paper.
In the paper
“In this state the subject presents insulin resistance (IR) and hyperinsulinemia, probably the first step of a dysfunctional metabolic system.”
§ Nutrition, insulin resistance and dysfunctional adipose tissue determine the different components of metabolic syndrome > INTRODUCTION
hedgedconditional- Asserted: passes — The authors put it forward as true.
- Checkable: passes — It can be checked against evidence.
- Load-bearing: passes — The paper’s conclusions depend on it.
- Based: passes — The paper gives a reason why it holds.
It may state two separate claims as one.
- Rests on an assumption: Adipose tissue can expand to levels of inflexibility.
In the paper
“However, these physical activities have decreased dramatically in societies today because of sedentary habits at work and in holiday life[40].”
§ Nutrition, insulin resistance and dysfunctional adipose tissue determine the different components of metabolic syndrome > INTRODUCTION
What the sources say
- Not checked yetcites [40] Levine JA Weisell R Chevassus S Martinez CD Burlingame B Coward WA The work burden of women Science 2001 294 812 11679660
plaindirect- Asserted: passes — The authors put it forward as true.
- Checkable: passes — It can be checked against evidence.
- Load-bearing: fails — The paper’s conclusions may not depend on it.
- Based: passes — The paper gives a reason why it holds.
Probably not a substantial claim. The paper’s conclusions may not depend on it.
In the paper
“a weight loss of 10% maintained over time in obese subjects may decrease the expected events of coronary and stroke diseases[27].”
§ Nutrition, insulin resistance and dysfunctional adipose tissue determine the different components of metabolic syndrome > INTRODUCTION
What the sources say
- Not checked yetcites [27] Oster G Thompson D Edelsberg J Bird AP Colditz GA Lifetime health and economic benefits of weight loss among obese persons Am J Public Health 1999 89 1536 1542 10511836 PMC1508787
hedgedconditional- Asserted: passes — The authors put it forward as true.
- Checkable: passes — It can be checked against evidence.
- Load-bearing: fails — The paper’s conclusions may not depend on it.
- Based: passes — The paper gives a reason why it holds.
Probably not a substantial claim. The paper’s conclusions may not depend on it.
The paper states this without a source or data behind it here, so there is nothing to check it against. The quote shows it is in the paper.
In the paper
“However, BMI does not gives us information about body composition and body fat distribution, neither about individual variations in terms of amounts of lean body mass (fat-free muscle mass), or the pattern of depot on body fat distribution.”
§ Nutrition, insulin resistance and dysfunctional adipose tissue determine the different components of metabolic syndrome > OBESITY ASSESSMENT
plain- Asserted: passes — The authors put it forward as true.
- Checkable: passes — It can be checked against evidence.
- Load-bearing: passes — The paper’s conclusions depend on it.
- Based: passes — The paper gives a reason why it holds.
It may state two separate claims as one.
None of the sources cited for this claim have been checked yet.
In the paper
“In humans, obesity depends on multiple factors apart from diet, like age and stage of development, genes and epigenetic factors, physical activity, environment, level of instruction and nutrition education, as well as several diseases that alter both physical and psychosocial interaction[3,4].”
§ Nutrition, insulin resistance and dysfunctional adipose tissue determine the different components of metabolic syndrome > INTRODUCTION
What the sources say
- Not checked yetcites [3] Kopelman PG Obesity as a medical problem Nature 2000 404 635 643 10766250
- Not checked yetcites [4] Christakis NA Fowler JH The spread of obesity in a large social network over 32 years N Engl J Med 2007 357 370 379 17652652
plaindirect- Asserted: passes — The authors put it forward as true.
- Checkable: passes — It can be checked against evidence.
- Load-bearing: fails — The paper’s conclusions may not depend on it.
- Based: passes — The paper gives a reason why it holds.
Probably not a substantial claim. The paper’s conclusions may not depend on it.
In the paper
“Obesity may account for up to 14% of cancer in men and up to 20% of cancer in women, and the risk of death from cancer in people with BMI ≥ 40 kg/m2 increases up to 52% in men and 62% in women as compared with people with normal weight[36].”
§ Nutrition, insulin resistance and dysfunctional adipose tissue determine the different components of metabolic syndrome > INTRODUCTION
What the sources say
- Not checked yetcites [36] Calle EE Rodriguez C Walker-Thurmond K Thun MJ Overweight, obesity, and mortality from cancer in a prospectively studied cohort of U.S. adults N Engl J Med 2003 348 1625 1638 12711737
hedgeddirect- Asserted: passes — The authors put it forward as true.
- Checkable: passes — It can be checked against evidence.
- Load-bearing: fails — The paper’s conclusions may not depend on it.
- Based: passes — The paper gives a reason why it holds.
Probably not a substantial claim. The paper’s conclusions may not depend on it. It may state two separate claims as one.
In the paper
“Selected subjects at high cardiovascular risk, a Mediterranean style diet supplemented either with extra-virgin olive oil or nuts decrease the incidence of major cardiovascular events[38].”
§ Nutrition, insulin resistance and dysfunctional adipose tissue determine the different components of metabolic syndrome > INTRODUCTION
What the sources say
- Not checked yetcites [38] Estruch R Ros E Salas-Salvadó J Covas MI Corella D Arós F Gómez-Gracia E Ruiz-Gutiérrez V Fiol M Lapetra J Primary prevention of cardiovascular disease with a Mediterranean diet N Engl J Med 2013 368 1279 1290 29897867
plaindirect- Asserted: passes — The authors put it forward as true.
- Checkable: passes — It can be checked against evidence.
- Load-bearing: fails — The paper’s conclusions may not depend on it.
- Based: passes — The paper gives a reason why it holds.
Probably not a substantial claim. The paper’s conclusions may not depend on it.
None of the sources cited for this claim have been checked yet.
In the paper
“epidemiology studies have established associations between food and nutrient intake with specific diseases such as cancer, diabetes and CVD[14,15]”
§ Nutrition, insulin resistance and dysfunctional adipose tissue determine the different components of metabolic syndrome > INTRODUCTION
What the sources say
- Not checked yetcites [14] No Author Food, nutrition, physical activity, and the prevention of cancer: A global perspective 2007 Washington, DC American Institute for Cancer Research
- Not checked yetcites [15] Mozaffarian D Appel LJ Van Horn L Components of a cardioprotective diet: new insights Circulation 2011 123 2870 2891 21690503 PMC6261290
boostedcorrelational- Asserted: passes — The authors put it forward as true.
- Checkable: passes — It can be checked against evidence.
- Load-bearing: fails — The paper’s conclusions may not depend on it.
- Based: passes — The paper gives a reason why it holds.
Probably not a substantial claim. The paper’s conclusions may not depend on it. It may state two separate claims as one.
In the paper
“studies of healthy habits in the 50s[39] show that physical activity at work, walking and cycling as a means of transport all contributed to overall energy expenditure.”
§ Nutrition, insulin resistance and dysfunctional adipose tissue determine the different components of metabolic syndrome > INTRODUCTION
What the sources say
- Not checked yetcites [39] Morris JN Heady JA Raffle PA Roberts CG Parks JW Coronary heart-disease and physical activity of work Lancet 1953 265 1053 1057; contd 13110049
plaindirect- Asserted: passes — The authors put it forward as true.
- Checkable: passes — It can be checked against evidence.
- Load-bearing: fails — The paper’s conclusions may not depend on it.
- Based: passes — The paper gives a reason why it holds.
Probably not a substantial claim. The paper’s conclusions may not depend on it. It may state two separate claims as one.
In the paper
“The mortality rate directly attributable to diabetes is about 3%, and diabetic patients have 2-4 times higher cardiovascular risk and many die of CVD[29].”
§ Nutrition, insulin resistance and dysfunctional adipose tissue determine the different components of metabolic syndrome > INTRODUCTION
What the sources say
- Not checked yetcites [29] Laakso M Hyperglycemia and cardiovascular disease in type 2 diabetes Diabetes 1999 48 937 942 10331395
plaincorrelational- Asserted: passes — The authors put it forward as true.
- Checkable: passes — It can be checked against evidence.
- Load-bearing: fails — The paper’s conclusions may not depend on it.
- Based: passes — The paper gives a reason why it holds.
Probably not a substantial claim. The paper’s conclusions may not depend on it. It may state two separate claims as one.
None of the sources cited for this claim have been checked yet.
In the paper
“In humans, infusion of hydrocortisone for 6 h increased levels of circulating FFA, and several mechanisms for the lipolysis of glucocorticoids have been observed[107,108].”
§ Nutrition, insulin resistance and dysfunctional adipose tissue determine the different components of metabolic syndrome > EFFECT OF HORMONES AND ADIPOKINES ON ADIPOGENESIS > Hormones and growth factors
What the sources say
- Not checked yetcites [107] Divertie GD Jensen MD Miles JM Stimulation of lipolysis in humans by physiological hypercortisolemia Diabetes 1991 40 1228 1232 1936585
- Not checked yetcites [108] Xu C He J Jiang H Zu L Zhai W Pu S Xu G Direct effect of glucocorticoids on lipolysis in adipocytes Mol Endocrinol 2009 23 1161 1170 19443609 PMC5419195
plaindirect- Asserted: passes — The authors put it forward as true.
- Checkable: passes — It can be checked against evidence.
- Load-bearing: unclear — It is unclear whether the paper’s conclusions depend on it.
- Based: passes — The paper gives a reason why it holds.
It may state two separate claims as one.
In the paper
“In addition, dexamethasone is involved in the expression of PPAR-γ transcription factors and C/EBPδ, and decreases the expression of pref-1 which is a negative regulator of adipogenesis[109].”
§ Nutrition, insulin resistance and dysfunctional adipose tissue determine the different components of metabolic syndrome > EFFECT OF HORMONES AND ADIPOKINES ON ADIPOGENESIS > Hormones and growth factors
What the sources say
- Not checked yetcites [109] Smas CM Chen L Zhao L Latasa MJ Sul HS Transcriptional repression of pref-1 by glucocorticoids promotes 3T3-L1 adipocyte differentiation J Biol Chem 1999 274 12632 12641 10212243
plaindirect- Asserted: passes — The authors put it forward as true.
- Checkable: passes — It can be checked against evidence.
- Load-bearing: unclear — It is unclear whether the paper’s conclusions depend on it.
- Based: passes — The paper gives a reason why it holds.
It may state two separate claims as one.
In the paper
“In addition, intraabdominal adipose tissue is composed of visceral adipose tissue (VAT) as omental and mesenteric fat (intraperitoneal fat) and retroperitoneal fat mass[68].”
§ Nutrition, insulin resistance and dysfunctional adipose tissue determine the different components of metabolic syndrome > OBESITY ASSESSMENT
What the sources say
- Not checked yetcites [68] Wajchenberg BL Subcutaneous and visceral adipose tissue: their relation to the metabolic syndrome Endocr Rev 2000 21 697 738 11133069
plain- Asserted: passes — The authors put it forward as true.
- Checkable: passes — It can be checked against evidence.
- Load-bearing: fails — The paper’s conclusions may not depend on it.
- Based: passes — The paper gives a reason why it holds.
Probably not a substantial claim. The paper’s conclusions may not depend on it.
A conclusion the paper draws from its own results — it cites no other source for it, so there is none to check. The quote shows it is in the paper.
In the paper
“Therefore, the central obesity phenotype is associated mainly with the consumption of peripheral adipose tissue (lipolysis), and it is observed in human hypercortisolism situations as in Cushing’s syndrome.”
§ Nutrition, insulin resistance and dysfunctional adipose tissue determine the different components of metabolic syndrome > EFFECT OF HORMONES AND ADIPOKINES ON ADIPOGENESIS > Hormones and growth factors
plaincorrelational- Asserted: passes — The authors put it forward as true.
- Checkable: passes — It can be checked against evidence.
- Load-bearing: unclear — It is unclear whether the paper’s conclusions depend on it.
- Based: passes — The paper gives a reason why it holds.
It may state two separate claims as one.
In the paper
“Treating leptin deficiency with recombinant leptin reduces food intake and body weight[119].”
§ Nutrition, insulin resistance and dysfunctional adipose tissue determine the different components of metabolic syndrome > EFFECT OF HORMONES AND ADIPOKINES ON ADIPOGENESIS > Major adipokines
What the sources say
- Not checked yetcites [119] Farooqi IS Jebb SA Langmack G Lawrence E Cheetham CH Prentice AM Hughes IA McCamish MA O’Rahilly S Effects of recombinant leptin therapy in a child with congenital leptin deficiency N Engl J Med 1999 341 879 884 10486419
plaindirect- Asserted: passes — The authors put it forward as true.
- Checkable: passes — It can be checked against evidence.
- Load-bearing: unclear — It is unclear whether the paper’s conclusions depend on it.
- Based: passes — The paper gives a reason why it holds.
It may state two separate claims as one.
None of the sources cited for this claim have been checked yet.
In the paper
“Leptin is specifically secreted by fat cells whose primary function assigned was to establish an adiposity signal between the amount of developed adipose tissue and satiety centers in the brain completing a negative feedback loop[116,117].”
§ Nutrition, insulin resistance and dysfunctional adipose tissue determine the different components of metabolic syndrome > EFFECT OF HORMONES AND ADIPOKINES ON ADIPOGENESIS > Major adipokines
What the sources say
- Not checked yetcites [116] Friedman JM Halaas JL Leptin and the regulation of body weight in mammals Nature 1998 395 763 770 9796811
- Not checked yetcites [117] Friedman JM Leptin, leptin receptors, and the control of body weight Nutr Rev 1998 56 s38 46; discussion s54-75 9564176
plaindirect- Asserted: passes — The authors put it forward as true.
- Checkable: passes — It can be checked against evidence.
- Load-bearing: fails — The paper’s conclusions may not depend on it.
- Based: passes — The paper gives a reason why it holds.
Probably not a substantial claim. The paper’s conclusions may not depend on it. It may state two separate claims as one.
In the paper
“This function is stimulated by exposure to cold or after lipid-rich calorie food, and this process is called adaptive thermogenesis[76].”
§ Nutrition, insulin resistance and dysfunctional adipose tissue determine the different components of metabolic syndrome > ADIPOCYTE AND ADIPOSITY DEVELOPMENT > Adipocyte differentiation
What the sources say
- Not checked yetcites [76] Cannon B Nedergaard J Brown adipose tissue: function and physiological significance Physiol Rev 2004 84 277 359 14715917
plaindirect- Asserted: passes — The authors put it forward as true.
- Checkable: passes — It can be checked against evidence.
- Load-bearing: fails — The paper’s conclusions may not depend on it.
- Based: passes — The paper gives a reason why it holds.
Probably not a substantial claim. The paper’s conclusions may not depend on it. It may state two separate claims as one.
The paper states this without a source or data behind it here, so there is nothing to check it against. The quote shows it is in the paper.
In the paper
“In mammals, BAT is the primary site of thermogenesis without accompanying muscle contraction.”
§ Nutrition, insulin resistance and dysfunctional adipose tissue determine the different components of metabolic syndrome > ADIPOCYTE AND ADIPOSITY DEVELOPMENT > Adipocyte differentiation
plaindirect- Asserted: passes — The authors put it forward as true.
- Checkable: passes — It can be checked against evidence.
- Load-bearing: fails — The paper’s conclusions may not depend on it.
- Based: passes — The paper gives a reason why it holds.
Probably not a substantial claim. The paper’s conclusions may not depend on it.
The paper states this without a source or data behind it here, so there is nothing to check it against. The quote shows it is in the paper.
In the paper
“Central obesity is composed of abdominal subcutaneous fat and intraabdominal fat, as is seen by MRI and CT.”
§ Nutrition, insulin resistance and dysfunctional adipose tissue determine the different components of metabolic syndrome > OBESITY ASSESSMENT
plain- Asserted: passes — The authors put it forward as true.
- Checkable: passes — It can be checked against evidence.
- Load-bearing: fails — The paper’s conclusions may not depend on it.
- Based: passes — The paper gives a reason why it holds.
Probably not a substantial claim. The paper’s conclusions may not depend on it.
None of the sources cited for this claim have been checked yet.
In the paper
“This enzyme is highly expressed in adipose tissue and an increase in its activity seems involved in an increased level of visceral adipose tissue[112,113].”
§ Nutrition, insulin resistance and dysfunctional adipose tissue determine the different components of metabolic syndrome > EFFECT OF HORMONES AND ADIPOKINES ON ADIPOGENESIS > Hormones and growth factors
What the sources say
- Not checked yetcites [112] Bujalska IJ Walker EA Tomlinson JW Hewison M Stewart PM 11Beta-hydroxysteroid dehydrogenase type 1 in differentiating omental human preadipocytes: from de-activation to generation of cortisol Endocr Res 2002 28 449 461 12530648
- Not checked yetcites [113] Stewart PM Tomlinson JW Cortisol, 11 beta-hydroxysteroid dehydrogenase type 1 and central obesity Trends Endocrinol Metab 2002 13 94 96 11893517
hedgedconditional- Asserted: passes — The authors put it forward as true.
- Checkable: passes — It can be checked against evidence.
- Load-bearing: unclear — It is unclear whether the paper’s conclusions depend on it.
- Based: passes — The paper gives a reason why it holds.
It may state two separate claims as one.
None of the sources cited for this claim have been checked yet.
In the paper
“Mature WAT are characterized by the increased expression of transporters of glucose sensitive to insulin (GLUT4), and enzymes like fatty acid synthase (FAS) and glycerol-2-phosphate dehydrogenase[72,73].”
§ Nutrition, insulin resistance and dysfunctional adipose tissue determine the different components of metabolic syndrome > ADIPOCYTE AND ADIPOSITY DEVELOPMENT > Adipocyte differentiation
What the sources say
- Not checked yetcites [72] Spiegelman BM Frank M Green H Molecular cloning of mRNA from 3T3 adipocytes. Regulation of mRNA content for glycerophosphate dehydrogenase and other differentiation-dependent proteins during adipocyte development J Biol Chem 1983 258 10083 10089 6411703
- Not checked yetcites [73] Mandrup S Lane MD Regulating adipogenesis J Biol Chem 1997 272 5367 5370 9102400
plaincorrelational- Asserted: passes — The authors put it forward as true.
- Checkable: passes — It can be checked against evidence.
- Load-bearing: fails — The paper’s conclusions may not depend on it.
- Based: passes — The paper gives a reason why it holds.
Probably not a substantial claim. The paper’s conclusions may not depend on it.
The paper states this without a source or data behind it here, so there is nothing to check it against. The quote shows it is in the paper.
In the paper
“The WAT is mainly related to the function of deposit of surplus energy as triacylglycerol (fat), which could be mobilized and offered through hormonal signaling and has a tremendous ability to expand;”
§ Nutrition, insulin resistance and dysfunctional adipose tissue determine the different components of metabolic syndrome > ADIPOCYTE AND ADIPOSITY DEVELOPMENT > Adipocyte differentiation
plaincorrelational- Asserted: passes — The authors put it forward as true.
- Checkable: passes — It can be checked against evidence.
- Load-bearing: fails — The paper’s conclusions may not depend on it.
- Based: passes — The paper gives a reason why it holds.
Probably not a substantial claim. The paper’s conclusions may not depend on it. It may state two separate claims as one.
In the paper
“In fact, patients with GH deficiency have a smaller number of adipocytes which also has less volume, and these are partially normalized with GH replacement therapy[101].”
§ Nutrition, insulin resistance and dysfunctional adipose tissue determine the different components of metabolic syndrome > EFFECT OF HORMONES AND ADIPOKINES ON ADIPOGENESIS > Hormones and growth factors
What the sources say
- Not checked yetcites [101] Salomon F Cuneo RC Hesp R Sönksen PH The effects of treatment with recombinant human growth hormone on body composition and metabolism in adults with growth hormone deficiency N Engl J Med 1989 321 1797 1803 2687691
plaindirect- Asserted: passes — The authors put it forward as true.
- Checkable: passes — It can be checked against evidence.
- Load-bearing: unclear — It is unclear whether the paper’s conclusions depend on it.
- Based: passes — The paper gives a reason why it holds.
It may state two separate claims as one.
None of the sources cited for this claim have been checked yet.
In the paper
“By contrast, BAT is involved in thermogenesis functions and thus in energy expenditure and body weight regulation[74,75].”
§ Nutrition, insulin resistance and dysfunctional adipose tissue determine the different components of metabolic syndrome > ADIPOCYTE AND ADIPOSITY DEVELOPMENT > Adipocyte differentiation
What the sources say
- Not checked yetcites [74] van Marken Lichtenbelt WD Vanhommerig JW Smulders NM Drossaerts JM Kemerink GJ Bouvy ND Schrauwen P Teule GJ Cold-activated brown adipose tissue in healthy men N Engl J Med 2009 360 1500 1508 19357405
- Not checked yetcites [75] Virtanen KA Lidell ME Orava J Heglind M Westergren R Niemi T Taittonen M Laine J Savisto NJ Enerbäck S Functional brown adipose tissue in healthy adults N Engl J Med 2009 360 1518 1525 19357407
plaindirect- Asserted: passes — The authors put it forward as true.
- Checkable: passes — It can be checked against evidence.
- Load-bearing: fails — The paper’s conclusions may not depend on it.
- Based: passes — The paper gives a reason why it holds.
Probably not a substantial claim. The paper’s conclusions may not depend on it. It may state two separate claims as one.
In the paper
“using a four-terminal bioimpedance analyzer has a prediction error less or equal to the standard anthropometry for estimating body fat[49].”
§ Nutrition, insulin resistance and dysfunctional adipose tissue determine the different components of metabolic syndrome > OBESITY ASSESSMENT
What the sources say
- Not checked yetcites [49] Lukaski HC Bolonchuk WW Hall CB Siders WA Validation of tetrapolar bioelectrical impedance method to assess human body composition J Appl Physiol (1985) 1986 60 1327 1332 3700310
plain- Asserted: passes — The authors put it forward as true.
- Checkable: passes — It can be checked against evidence.
- Load-bearing: fails — The paper’s conclusions may not depend on it.
- Based: passes — The paper gives a reason why it holds.
Probably not a substantial claim. The paper’s conclusions may not depend on it.
None of the sources cited for this claim have been checked yet.
In the paper
“and children[59,60].”
§ Nutrition, insulin resistance and dysfunctional adipose tissue determine the different components of metabolic syndrome > OBESITY ASSESSMENT
What the sources say
- Not checked yetcites [59] Savva SC Tornaritis M Savva ME Kourides Y Panagi A Silikiotou N Georgiou C Kafatos A Waist circumference and waist-to-height ratio are better predictors of cardiovascular disease risk factors in children than body mass index Int J Obes Relat Metab Disord 2000 24 1453 1458 11126342
- Not checked yetcites [60] Hara M Saitou E Iwata F Okada T Harada K Waist-to-height ratio is the best predictor of cardiovascular disease risk factors in Japanese schoolchildren J Atheroscler Thromb 2002 9 127 132 12226553
plaincorrelational- Asserted: passes — The authors put it forward as true.
- Checkable: passes — It can be checked against evidence.
- Load-bearing: fails — The paper’s conclusions may not depend on it.
- Based: passes — The paper gives a reason why it holds.
Probably not a substantial claim. The paper’s conclusions may not depend on it.
In the paper
“The regulation of glucocorticoids levels is critical for the maintenance of homeostasis and the activity in some tissues of 11-β-hydroxysteroid dehydrogenase 1 and 2 (11 βHSD1 and 2) interconvert the active form of cortisol in other inactive product called cortisone and vice versa[111].”
§ Nutrition, insulin resistance and dysfunctional adipose tissue determine the different components of metabolic syndrome > EFFECT OF HORMONES AND ADIPOKINES ON ADIPOGENESIS > Hormones and growth factors
What the sources say
- Not checked yetcites [111] Pereira CD Azevedo I Monteiro R Martins MJ 11β-Hydroxysteroid dehydrogenase type 1: relevance of its modulation in the pathophysiology of obesity, the metabolic syndrome and type 2 diabetes mellitus Diabetes Obes Metab 2012 14 869 881 22321826
plain- Asserted: passes — The authors put it forward as true.
- Checkable: passes — It can be checked against evidence.
- Load-bearing: fails — The paper’s conclusions may not depend on it.
- Based: passes — The paper gives a reason why it holds.
Probably not a substantial claim. The paper’s conclusions may not depend on it. It may state two separate claims as one.
The paper states this without a source or data behind it here, so there is nothing to check it against. The quote shows it is in the paper.
In the paper
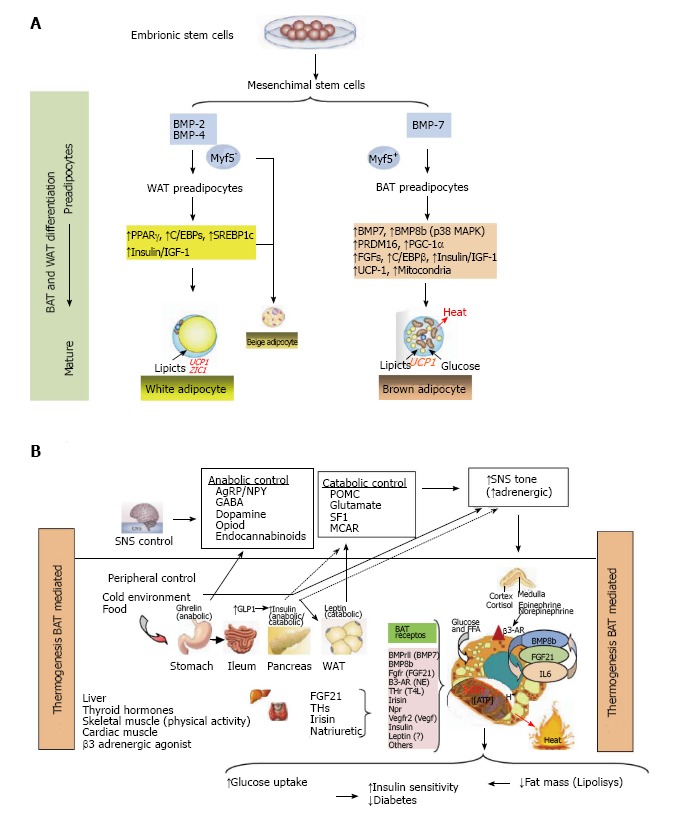
“This thermogenic function of BAT is mediated by the activation of a specific mitochondrial uncoupling protein 1 (UCP1), which is ubiquitous in the inner mitochondrial membrane, uncoupling electron transport of mitochondrial respiration, where the saturation of the production of ATP is dissipated as heat (Figure 1B).”
§ Nutrition, insulin resistance and dysfunctional adipose tissue determine the different components of metabolic syndrome > ADIPOCYTE AND ADIPOSITY DEVELOPMENT > Adipocyte differentiation
plaindirect- Asserted: passes — The authors put it forward as true.
- Checkable: passes — It can be checked against evidence.
- Load-bearing: fails — The paper’s conclusions may not depend on it.
- Based: passes — The paper gives a reason why it holds.
Probably not a substantial claim. The paper’s conclusions may not depend on it.
A result the paper reports from its own data — it cites no other source for it, so there is none to check. The quote shows it is in the paper.
In the paper
“Experimentally, it was observed that BMI = 30 kg/m2 implies approximately 30% of BF% at 20 years of age but increase to 40% at 60 year in men, while in older women these values were to 40% and 50%, respectively.”
§ Nutrition, insulin resistance and dysfunctional adipose tissue determine the different components of metabolic syndrome > OBESITY ASSESSMENT
plaindirect- Asserted: passes — The authors put it forward as true.
- Checkable: passes — It can be checked against evidence.
- Load-bearing: unclear — It is unclear whether the paper’s conclusions depend on it.
- Based: passes — The paper gives a reason why it holds.
It may state two separate claims as one.
The paper states this without a source or data behind it here, so there is nothing to check it against. The quote shows it is in the paper.
In the paper
“In humans there are two types of well-differentiated adipose tissue, which have different distribution and functions, and are referred to as white adipose tissue (WAT) and brown adipose tissue (BAT) (Figure 1A).”
§ Nutrition, insulin resistance and dysfunctional adipose tissue determine the different components of metabolic syndrome > ADIPOCYTE AND ADIPOSITY DEVELOPMENT > Adipocyte differentiation
plain- Asserted: passes — The authors put it forward as true.
- Checkable: passes — It can be checked against evidence.
- Load-bearing: fails — The paper’s conclusions may not depend on it.
- Based: passes — The paper gives a reason why it holds.
Probably not a substantial claim. The paper’s conclusions may not depend on it. It may state two separate claims as one.
In the paper
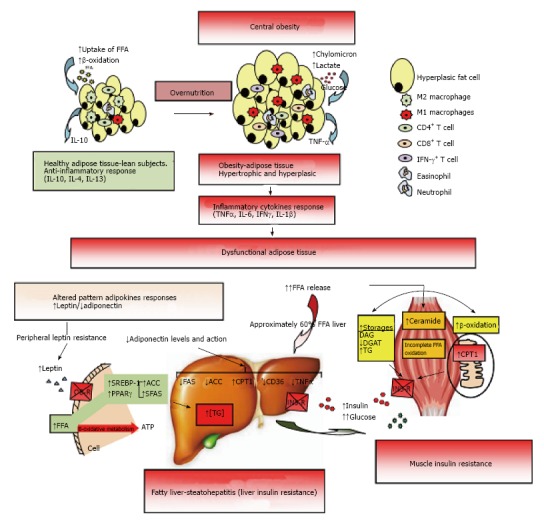
“In obese and insulin resistant patients increased levels of some adipokines (e.g., leptin, resistin) are often observed while others such as adiponectin levels are typically decreased[115] (Figure 2).”
§ Nutrition, insulin resistance and dysfunctional adipose tissue determine the different components of metabolic syndrome > EFFECT OF HORMONES AND ADIPOKINES ON ADIPOGENESIS > Hormones and growth factors
What the sources say
- Not checked yetcites [115] Paniagua JA Escandell-Morales JM Gil-Contreras D Berral de la Rosa FJ Romero-Jimenez M Gómez-Urbano A Sanchez-Lopez A Bellido E Poyato A Calatayud B Central obesity and altered peripheral adipose tissue gene expression characterize the NAFLD patient with insulin resistance: Role of nutrition and insulin challenge Nutrition 2014 30 177 185 24377452
hedgedcorrelational- Asserted: passes — The authors put it forward as true.
- Checkable: passes — It can be checked against evidence.
- Load-bearing: unclear — It is unclear whether the paper’s conclusions depend on it.
- Based: passes — The paper gives a reason why it holds.
It may state two separate claims as one.
None of the sources cited for this claim have been checked yet.
In the paper
“Recently, the waist-to-height ratio, which relates waist circumference to height, has also been used to identify higher cardiometabolic risk in adults[56-58]”
§ Nutrition, insulin resistance and dysfunctional adipose tissue determine the different components of metabolic syndrome > OBESITY ASSESSMENT
What the sources say
- Not checked yetcites [56] Ashwell M Cole TJ Dixon AK Ratio of waist circumference to height is strong predictor of intra-abdominal fat BMJ 1996 313 559 560 PMC2351911 8790002
- Not checked yetcites [57] Cox BD Whichelow M Ratio of waist circumference to height is better predictor of death than body mass index BMJ 1996 313 1487 PMC2352984 8973270
- Not checked yetcites [58] Hsieh SD Yoshinaga H Waist/height ratio as a simple and useful predictor of coronary heart disease risk factors in women Intern Med 1995 34 1147 1152 8929639
plaincorrelational- Asserted: passes — The authors put it forward as true.
- Checkable: passes — It can be checked against evidence.
- Load-bearing: fails — The paper’s conclusions may not depend on it.
- Based: passes — The paper gives a reason why it holds.
Probably not a substantial claim. The paper’s conclusions may not depend on it.
The paper states this without a source or data behind it here, so there is nothing to check it against. The quote shows it is in the paper.
In the paper
“excess fat storage is associated with mechanical overload and slow to moderate increased risk of metabolic disorders.”
§ Nutrition, insulin resistance and dysfunctional adipose tissue determine the different components of metabolic syndrome > ADIPOCYTE AND ADIPOSITY DEVELOPMENT > Adipocyte differentiation
plaincorrelational- Asserted: passes — The authors put it forward as true.
- Checkable: passes — It can be checked against evidence.
- Load-bearing: fails — The paper’s conclusions may not depend on it.
- Based: fails — The paper may give no reason why it holds.
Probably not a substantial claim. The paper’s conclusions may not depend on it. The paper may give no reason why it holds.
In the paper
“GH is involved in the conversion of preadipocytes into mature adipocytes, and subsequently plays a role in the maturation of adipocytes which makes them sensitive to insulin and IGF-I[102].”
§ Nutrition, insulin resistance and dysfunctional adipose tissue determine the different components of metabolic syndrome > EFFECT OF HORMONES AND ADIPOKINES ON ADIPOGENESIS > Hormones and growth factors
What the sources say
- Not checked yetcites [102] Wabitsch M Hauner H Heinze E Teller WM The role of growth hormone/insulin-like growth factors in adipocyte differentiation Metabolism 1995 44 45 49 7476311
plaindirect- Asserted: passes — The authors put it forward as true.
- Checkable: passes — It can be checked against evidence.
- Load-bearing: unclear — It is unclear whether the paper’s conclusions depend on it.
- Based: passes — The paper gives a reason why it holds.
It may state two separate claims as one.
None of the sources cited for this claim have been checked yet.
In the paper
“It has been observed that thyroid function in BAT is mediated by the C/EBPs signaling which induces the expression of thyroid hormone receptor and PGC1α (PPAR-γ coactivator) and deiodinase (D2) activity determines grade of thyroid function “in situ”[105,106].”
§ Nutrition, insulin resistance and dysfunctional adipose tissue determine the different components of metabolic syndrome > EFFECT OF HORMONES AND ADIPOKINES ON ADIPOGENESIS > Hormones and growth factors
What the sources say
- Not checked yetcites [105] Park EA Song S Olive M Roesler WJ CCAAT-enhancer-binding protein alpha (C/EBP alpha) is required for the thyroid hormone but not the retinoic acid induction of phosphoenolpyruvate carboxykinase (PEPCK) gene transcription Biochem J 1997 322 Pt 1 343 349 9078282 PMC1218197
- Not checked yetcites [106] Carmona MC Iglesias R Obregón MJ Darlington GJ Villarroya F Giralt M Mitochondrial biogenesis and thyroid status maturation in brown fat require CCAAT/enhancer-binding protein alpha J Biol Chem 2002 277 21489 21498 11940593
plaindirect- Asserted: passes — The authors put it forward as true.
- Checkable: passes — It can be checked against evidence.
- Load-bearing: fails — The paper’s conclusions may not depend on it.
- Based: passes — The paper gives a reason why it holds.
Probably not a substantial claim. The paper’s conclusions may not depend on it. It may state two separate claims as one.
None of the sources cited for this claim have been checked yet.
In the paper
“The range of normal body fat is 2%-5% in men and 10%-13% in women, while the obesity range of body fat percentage is above of 25% in men and 32% in women[53,54].”
§ Nutrition, insulin resistance and dysfunctional adipose tissue determine the different components of metabolic syndrome > OBESITY ASSESSMENT
What the sources say
- Not checked yetcites [53] Giusti M Mortara L Degrandi R Cecoli F Mussap M Rodriguez G Ferone D Minuto F Metabolic and cardiovascular risk in patients with a history of differentiated thyroid carcinoma: A case-controlled cohort study Thyroid Res 2008 1 2 19014658 PMC2577042
- Not checked yetcites [54] Katherine Zeratsky Normal weight obesity: A hidden health risk? Can you be considered obese if you have a normal body weight? 2009 Mayo Clinic Obesity Expert Answers
plain- Asserted: passes — The authors put it forward as true.
- Checkable: passes — It can be checked against evidence.
- Load-bearing: fails — The paper’s conclusions may not depend on it.
- Based: passes — The paper gives a reason why it holds.
Probably not a substantial claim. The paper’s conclusions may not depend on it. It may state two separate claims as one.
In the paper
“Occasionally other techniques have been used in determining the ectopic fatty tissue including ultrasonography (US), with a highly significant correlation between CT and by US[71].”
§ Nutrition, insulin resistance and dysfunctional adipose tissue determine the different components of metabolic syndrome > OBESITY ASSESSMENT
What the sources say
- Not checked yetcites [71] Armellini F Zamboni M Robbi R Todesco T Rigo L Bergamo-Andreis IA Bosello O Total and intra-abdominal fat measurements by ultrasound and computerized tomography Int J Obes Relat Metab Disord 1993 17 209 214 8387970
boostedcorrelational- Asserted: passes — The authors put it forward as true.
- Checkable: passes — It can be checked against evidence.
- Load-bearing: fails — The paper’s conclusions may not depend on it.
- Based: passes — The paper gives a reason why it holds.
Probably not a substantial claim. The paper’s conclusions may not depend on it.
The paper states this without a source or data behind it here, so there is nothing to check it against. The quote shows it is in the paper.
In the paper
“Finally, single-voxel magnetic resonance spectroscopy is the gold-standard for ectopic fat quantification.”
§ Nutrition, insulin resistance and dysfunctional adipose tissue determine the different components of metabolic syndrome > OBESITY ASSESSMENT
plain- Asserted: passes — The authors put it forward as true.
- Checkable: passes — It can be checked against evidence.
- Load-bearing: fails — The paper’s conclusions may not depend on it.
- Based: fails — The paper may give no reason why it holds.
Probably not a substantial claim. The paper’s conclusions may not depend on it. The paper may give no reason why it holds.
In the paper
“This has advantages compared to the BMI, and even with WC and WHR, and a healthy individual should maintain a waist circumference to less than half their height[61].”
§ Nutrition, insulin resistance and dysfunctional adipose tissue determine the different components of metabolic syndrome > OBESITY ASSESSMENT
What the sources say
- Not checked yetcites [61] Savva SC Lamnisos D Kafatos AG Predicting cardiometabolic risk: waist-to-height ratio or BMI. A meta-analysis Diabetes Metab Syndr Obes 2013 6 403 419 24179379 PMC3810792
plaincorrelational- Asserted: passes — The authors put it forward as true.
- Checkable: passes — It can be checked against evidence.
- Load-bearing: fails — The paper’s conclusions may not depend on it.
- Based: passes — The paper gives a reason why it holds.
Probably not a substantial claim. The paper’s conclusions may not depend on it. It may state two separate claims as one.
In the paper
“Therefore, appears to be stimulated by insulin, glucocorticoids, TNF-α, estrogens, and C/EBPA; by contrast, is decreased by androgens, β3-adrenergic activity, GH, free fatty acids, and PPAR-γ agonist[124].”
§ Nutrition, insulin resistance and dysfunctional adipose tissue determine the different components of metabolic syndrome > EFFECT OF HORMONES AND ADIPOKINES ON ADIPOGENESIS > Major adipokines
What the sources say
- Not checked yetcites [124] Margetic S Gazzola C Pegg GG Hill RA Leptin: a review of its peripheral actions and interactions Int J Obes Relat Metab Disord 2002 26 1407 1433 12439643
hedgeddirect- Asserted: passes — The authors put it forward as true.
- Checkable: passes — It can be checked against evidence.
- Load-bearing: unclear — It is unclear whether the paper’s conclusions depend on it.
- Based: passes — The paper gives a reason why it holds.
It may state two separate claims as one.
In the paper
“IL-6 inhibits the activity of lipoprotein lipase (LPL) and reduces the differentiation of human preadipocytes, both associated with adipogenesis[142].”
§ Nutrition, insulin resistance and dysfunctional adipose tissue determine the different components of metabolic syndrome > EFFECT OF HORMONES AND ADIPOKINES ON ADIPOGENESIS > Major adipokines
What the sources say
- Not checked yetcites [142] Wang B Jenkins JR Trayhurn P Expression and secretion of inflammation-related adipokines by human adipocytes differentiated in culture: integrated response to TNF-alpha Am J Physiol Endocrinol Metab 2005 288 E731 E740 15562246
plaindirect- Asserted: passes — The authors put it forward as true.
- Checkable: passes — It can be checked against evidence.
- Load-bearing: unclear — It is unclear whether the paper’s conclusions depend on it.
- Based: passes — The paper gives a reason why it holds.
It may state two separate claims as one.
In the paper
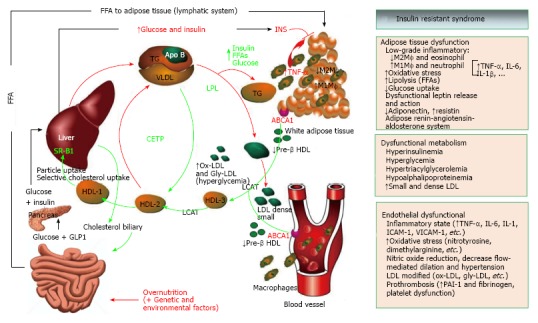
“Later, Reaven[193] (1988) observed that several risk factors (dyslipidemia, hypertension, hyperglycemia) commonly cluster together in insulin resistant subjects (Figure 4).”
§ Nutrition, insulin resistance and dysfunctional adipose tissue determine the different components of metabolic syndrome > FROM OBESITY AND INSULIN RESISTANCE TO METS
What the sources say
- Not checked yetcites [193] Reaven GM Banting lecture 1988. Role of insulin resistance in human disease Diabetes 1988 37 1595 1607 3056758
plaincorrelational- Asserted: passes — The authors put it forward as true.
- Checkable: passes — It can be checked against evidence.
- Load-bearing: fails — The paper’s conclusions may not depend on it.
- Based: passes — The paper gives a reason why it holds.
Probably not a substantial claim. The paper’s conclusions may not depend on it.
A conclusion the paper draws from its own results — it cites no other source for it, so there is none to check. The quote shows it is in the paper.
In the paper
“This suggests that the limitation in storage capacity could be necessary and even precedes the development of metabolic factors.”
§ Nutrition, insulin resistance and dysfunctional adipose tissue determine the different components of metabolic syndrome > EFFECT OF HORMONES AND ADIPOKINES ON ADIPOGENESIS > Major adipokines
hedgedconditional- Asserted: passes — The authors put it forward as true.
- Checkable: passes — It can be checked against evidence.
- Load-bearing: passes — The paper’s conclusions depend on it.
- Based: passes — The paper gives a reason why it holds.
It may state two separate claims as one.
In the paper
“Finally, circulating levels of IL-6 have been found to be directly linked to both obesity and insulin resistance[141].”
§ Nutrition, insulin resistance and dysfunctional adipose tissue determine the different components of metabolic syndrome > EFFECT OF HORMONES AND ADIPOKINES ON ADIPOGENESIS > Major adipokines
What the sources say
- Not checked yetcites [141] Fernández-Real JM Ricart W Insulin resistance and chronic cardiovascular inflammatory syndrome Endocr Rev 2003 24 278 301 12788800
plaincorrelational- Asserted: passes — The authors put it forward as true.
- Checkable: passes — It can be checked against evidence.
- Load-bearing: unclear — It is unclear whether the paper’s conclusions depend on it.
- Based: passes — The paper gives a reason why it holds.
It may state two separate claims as one.
In the paper
“Plasma levels and omentin gene expression in visceral adipose are decreased in obesity[147].”
§ Nutrition, insulin resistance and dysfunctional adipose tissue determine the different components of metabolic syndrome > EFFECT OF HORMONES AND ADIPOKINES ON ADIPOGENESIS > Others main adipokines
What the sources say
- Not checked yetcites [147] de Souza Batista CM Yang RZ Lee MJ Glynn NM Yu DZ Pray J Ndubuizu K Patil S Schwartz A Kligman M Omentin plasma levels and gene expression are decreased in obesity Diabetes 2007 56 1655 1661 17329619
plaincorrelational- Asserted: passes — The authors put it forward as true.
- Checkable: passes — It can be checked against evidence.
- Load-bearing: unclear — It is unclear whether the paper’s conclusions depend on it.
- Based: passes — The paper gives a reason why it holds.
It may state two separate claims as one.
In the paper
“In obesity HDL functions change dramatically during acute and chronic inflammation of adipose tissue, and changes in quality of HDL can contribute to the failure of atheroprotective capacity, and decreased efflux capacity in patients with MetS and diabetes have been shown[189].”
§ Nutrition, insulin resistance and dysfunctional adipose tissue determine the different components of metabolic syndrome > FROM INSULIN RESISTANCE TO OTHER CARDIOVASCULAR RISK FACTORS
What the sources say
- Not checked yetcites [189] Oram JF Vaughan AM ATP-Binding cassette cholesterol transporters and cardiovascular disease Circ Res 2006 99 1031 1043 17095732
plainconditional- Asserted: passes — The authors put it forward as true.
- Checkable: passes — It can be checked against evidence.
- Load-bearing: unclear — It is unclear whether the paper’s conclusions depend on it.
- Based: passes — The paper gives a reason why it holds.
It may state two separate claims as one.
A conclusion the paper draws from its own results — it cites no other source for it, so there is none to check. The quote shows it is in the paper.
In the paper
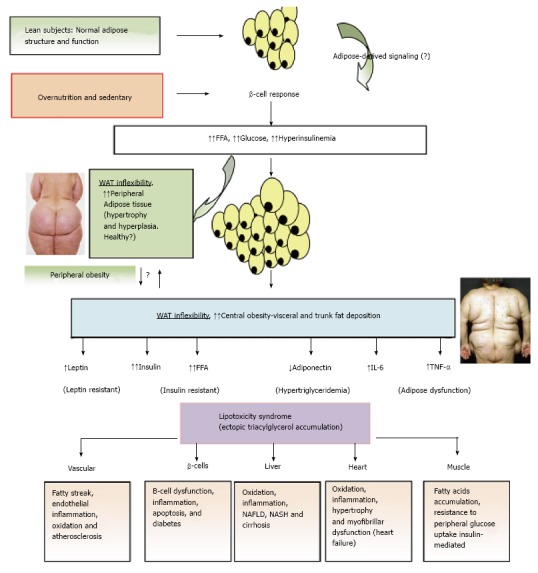
“On top of all these factors, the link between obesity and associated metabolic abnormalities seems to be better related to the topography, anatomical distribution and/or the functional peculiarities of the adipose tissue, a phenomenon which seems to be more relevant in patients with relatively normal weight (Figures 2 and 3).”
§ Nutrition, insulin resistance and dysfunctional adipose tissue determine the different components of metabolic syndrome > FROM INSULIN RESISTANCE TO OTHER CARDIOVASCULAR RISK FACTORS
hedgedcorrelational- Asserted: passes — The authors put it forward as true.
- Checkable: passes — It can be checked against evidence.
- Load-bearing: passes — The paper’s conclusions depend on it.
- Based: passes — The paper gives a reason why it holds.
It may state two separate claims as one.
- Rests on an assumption: The link between obesity and associated metabolic abnormalities is better related to the topography, anatomical distribution and/or functional peculiarities of adipose tissue, and this is more relevant in patients with relatively normal weight.
In the paper
“In addition, FFA have hormone-like actions and can influence gene expression in preadipocytes, affecting adipogenesis through proliferation and differentiation[150].”
§ Nutrition, insulin resistance and dysfunctional adipose tissue determine the different components of metabolic syndrome > EFFECT OF HORMONES AND ADIPOKINES ON ADIPOGENESIS > Effect of fatty acid metabolism and enzymes on adipogenesis
What the sources say
- Not checked yetcites [150] Duplus E Glorian M Forest C Fatty acid regulation of gene transcription J Biol Chem 2000 275 30749 30752 10934217
plaindirect- Asserted: passes — The authors put it forward as true.
- Checkable: passes — It can be checked against evidence.
- Load-bearing: unclear — It is unclear whether the paper’s conclusions depend on it.
- Based: passes — The paper gives a reason why it holds.
It may state two separate claims as one.
In the paper
“Adiponectin is produced specifically in mature adipocytes and RNA abundance is higher in peripheral adipose tissue compared with visceral adipose tissue[127].”
§ Nutrition, insulin resistance and dysfunctional adipose tissue determine the different components of metabolic syndrome > EFFECT OF HORMONES AND ADIPOKINES ON ADIPOGENESIS > Major adipokines
What the sources say
- Not checked yetcites [127] Fain JN Madan AK Hiler ML Cheema P Bahouth SW Comparison of the release of adipokines by adipose tissue, adipose tissue matrix, and adipocytes from visceral and subcutaneous abdominal adipose tissues of obese humans Endocrinology 2004 145 2273 2282 14726444
plaincorrelational- Asserted: passes — The authors put it forward as true.
- Checkable: passes — It can be checked against evidence.
- Load-bearing: unclear — It is unclear whether the paper’s conclusions depend on it.
- Based: passes — The paper gives a reason why it holds.
It may state two separate claims as one.
The paper states this without a source or data behind it here, so there is nothing to check it against. The quote shows it is in the paper.
In the paper
“By contrast, diets with excess saturated fatty acids (and unsaturated trans) have been associated with a significantly increased risk of CVD.”
§ Nutrition, insulin resistance and dysfunctional adipose tissue determine the different components of metabolic syndrome > EFFECT OF HORMONES AND ADIPOKINES ON ADIPOGENESIS > Effect of fatty acid metabolism and enzymes on adipogenesis
plaincorrelational- Asserted: passes — The authors put it forward as true.
- Checkable: passes — It can be checked against evidence.
- Load-bearing: fails — The paper’s conclusions may not depend on it.
- Based: fails — The paper may give no reason why it holds.
Probably not a substantial claim. The paper’s conclusions may not depend on it. The paper may give no reason why it holds.
A conclusion the paper draws from its own results — it cites no other source for it, so there is none to check. The quote shows it is in the paper.
In the paper
“In conditions of overnutrition the adipose tissue (AT) expands to levels of inflexibility (adiposity), and in this state the subject presents a longer postprandial state which leads to hyperinsulinemia, probably the first step in this altered dysfunctional metabolic system (Figure 4).”
§ Nutrition, insulin resistance and dysfunctional adipose tissue determine the different components of metabolic syndrome > FROM INSULIN RESISTANCE TO OTHER CARDIOVASCULAR RISK FACTORS
hedgeddirect- Asserted: passes — The authors put it forward as true.
- Checkable: passes — It can be checked against evidence.
- Load-bearing: passes — The paper’s conclusions depend on it.
- Based: passes — The paper gives a reason why it holds.
It may state two separate claims as one.
The paper states this without a source or data behind it here, so there is nothing to check it against. The quote shows it is in the paper.
In the paper
“Leptin secretion rises in parallel with fat expansion in adipocytes and it has been proposed that this prevents lipotoxicity by minimizing ectopic accumulation of lipids into nonadipocytes because leptin induced β-oxidation increasing transcription of PPAR-α.”
§ Nutrition, insulin resistance and dysfunctional adipose tissue determine the different components of metabolic syndrome > OBESITY AND LIPOTOXICITY SYNDROME
hedgeddirect- Asserted: passes — The authors put it forward as true.
- Checkable: passes — It can be checked against evidence.
- Load-bearing: fails — The paper’s conclusions may not depend on it.
- Based: fails — The paper may give no reason why it holds.
Probably not a substantial claim. The paper’s conclusions may not depend on it. The paper may give no reason why it holds. It may state two separate claims as one.
In the paper
“So far, in human trials, the PPAR-γ agonists (TZDs), that remove fat from central deposits toward more favorable peripheral deposits, have been shown to improve lipid profile, insulin-sensitivity, and reduce diabetes and NAFLD[269].”
§ Nutrition, insulin resistance and dysfunctional adipose tissue determine the different components of metabolic syndrome > EFFECT OF HORMONES AND ADIPOKINES ON ADIPOGENESIS > Major adipokines
What the sources say
- Not checked yetcites [269] Belfort R Harrison SA Brown K Darland C Finch J Hardies J Balas B Gastaldelli A Tio F Pulcini J A placebo-controlled trial of pioglitazone in subjects with nonalcoholic steatohepatitis N Engl J Med 2006 355 2297 2307 17135584
boosteddirect- Asserted: passes — The authors put it forward as true.
- Checkable: passes — It can be checked against evidence.
- Load-bearing: unclear — It is unclear whether the paper’s conclusions depend on it.
- Based: passes — The paper gives a reason why it holds.
It may state two separate claims as one.
A conclusion the paper draws from its own results — it cites no other source for it, so there is none to check. The quote shows it is in the paper.
In the paper
“Therefore, when central obesity is slowly being developed, it is observed that hyperinsulinemia and hyperglycemia also progress slowly in postprandial state and later a global hyperglycemia (T2D), hypertriglyceridemia, hypoalphalipoproteinemia, hypertension and fatty liver (dysfunctional metabolism) are developed.”
§ Nutrition, insulin resistance and dysfunctional adipose tissue determine the different components of metabolic syndrome > FROM INSULIN RESISTANCE TO OTHER CARDIOVASCULAR RISK FACTORS
plaindirect- Asserted: passes — The authors put it forward as true.
- Checkable: passes — It can be checked against evidence.
- Load-bearing: passes — The paper’s conclusions depend on it.
- Based: passes — The paper gives a reason why it holds.
It may state two separate claims as one.
A conclusion the paper draws from its own results — it cites no other source for it, so there is none to check. The quote shows it is in the paper.
In the paper
“Thus, lipotoxicity in β-cell could decrease beta cell mass (dysfunction of β-cell secretion) and would cause diabetes.”
§ Nutrition, insulin resistance and dysfunctional adipose tissue determine the different components of metabolic syndrome > EFFECT OF HORMONES AND ADIPOKINES ON ADIPOGENESIS > Major adipokines
hedgedconditional- Asserted: passes — The authors put it forward as true.
- Checkable: passes — It can be checked against evidence.
- Load-bearing: passes — The paper’s conclusions depend on it.
- Based: passes — The paper gives a reason why it holds.
It may state two separate claims as one.
In the paper
“Finally, adiponectin levels is early decreased in insulin resistance syndrome, even before the onset of obesity, and adiponectin administration improves IS[132].”
§ Nutrition, insulin resistance and dysfunctional adipose tissue determine the different components of metabolic syndrome > EFFECT OF HORMONES AND ADIPOKINES ON ADIPOGENESIS > Major adipokines
What the sources say
- Not checked yetcites [132] Hotta K Funahashi T Bodkin NL Ortmeyer HK Arita Y Hansen BC Matsuzawa Y Circulating concentrations of the adipocyte protein adiponectin are decreased in parallel with reduced insulin sensitivity during the progression to type 2 diabetes in rhesus monkeys Diabetes 2001 50 1126 1133 11334417
plaindirect- Asserted: passes — The authors put it forward as true.
- Checkable: passes — It can be checked against evidence.
- Load-bearing: unclear — It is unclear whether the paper’s conclusions depend on it.
- Based: passes — The paper gives a reason why it holds.
It may state two separate claims as one.
In the paper
“Nuclear receptor PPAR-γ is a key gene that regulates adipogenesis and lipid storage, but it appears that is also needed for the control of the lipolysis, dysregulation of which is a prominent characteristic of obesity-induced insulin resistance in humans[164].”
§ Nutrition, insulin resistance and dysfunctional adipose tissue determine the different components of metabolic syndrome > OBESITY AND LIPOTOXICITY SYNDROME
What the sources say
- Not checked yetcites [164] Rodriguez-Cuenca S Carobbio S Velagapudi VR Barbarroja N Moreno-Navarrete JM Tinahones FJ Fernandez-Real JM Orešic M Vidal-Puig A Peroxisome proliferator-activated receptor γ-dependent regulation of lipolytic nodes and metabolic flexibility Mol Cell Biol 2012 32 1555 1565 22310664 PMC3318581
hedgeddirect- Asserted: passes — The authors put it forward as true.
- Checkable: passes — It can be checked against evidence.
- Load-bearing: unclear — It is unclear whether the paper’s conclusions depend on it.
- Based: passes — The paper gives a reason why it holds.
It may state two separate claims as one.
The paper states this without a source or data behind it here, so there is nothing to check it against. The quote shows it is in the paper.
In the paper
“Several contributing factors such as hyperinsulinemia increases the reabsorption of Na+ and also activates the sympathetic nervous system.”
§ Nutrition, insulin resistance and dysfunctional adipose tissue determine the different components of metabolic syndrome > FROM INSULIN RESISTANCE TO OTHER CARDIOVASCULAR RISK FACTORS
plaindirect- Asserted: passes — The authors put it forward as true.
- Checkable: passes — It can be checked against evidence.
- Load-bearing: passes — The paper’s conclusions depend on it.
- Based: passes — The paper gives a reason why it holds.
It may state two separate claims as one.
The paper states this without a source or data behind it here, so there is nothing to check it against. The quote shows it is in the paper.
In the paper
“It appears that the expression of fatty acid binding protein-4 (FABP4) is involved in the balance between lipogenesis and lipolysis and in the process of differentiation of preadipocytes.”
§ Nutrition, insulin resistance and dysfunctional adipose tissue determine the different components of metabolic syndrome > EFFECT OF HORMONES AND ADIPOKINES ON ADIPOGENESIS > Effect of fatty acid metabolism and enzymes on adipogenesis
hedgedcorrelational- Asserted: passes — The authors put it forward as true.
- Checkable: passes — It can be checked against evidence.
- Load-bearing: unclear — It is unclear whether the paper’s conclusions depend on it.
- Based: passes — The paper gives a reason why it holds.
It may state two separate claims as one.
In the paper
“However, not all obese individuals necessarily develop metabolic complications, as some remain insulin sensitive and do not develop fatty liver[115].”
§ Nutrition, insulin resistance and dysfunctional adipose tissue determine the different components of metabolic syndrome > FROM INSULIN RESISTANCE TO OTHER CARDIOVASCULAR RISK FACTORS
What the sources say
- Not checked yetcites [115] Paniagua JA Escandell-Morales JM Gil-Contreras D Berral de la Rosa FJ Romero-Jimenez M Gómez-Urbano A Sanchez-Lopez A Bellido E Poyato A Calatayud B Central obesity and altered peripheral adipose tissue gene expression characterize the NAFLD patient with insulin resistance: Role of nutrition and insulin challenge Nutrition 2014 30 177 185 24377452
plain- Asserted: passes — The authors put it forward as true.
- Checkable: passes — It can be checked against evidence.
- Load-bearing: unclear — It is unclear whether the paper’s conclusions depend on it.
- Based: passes — The paper gives a reason why it holds.
It may state two separate claims as one.
None of the sources cited for this claim have been checked yet.
In the paper
“TNF-α is a transmembrane protein released mostly by activated macrophages, and also by several other cell types including lymphoid cells, cardiac myocytes, endothelial cells, adipose tissue, etc.[133-135] (Figure 2).”
§ Nutrition, insulin resistance and dysfunctional adipose tissue determine the different components of metabolic syndrome > EFFECT OF HORMONES AND ADIPOKINES ON ADIPOGENESIS > Major adipokines
What the sources say
- Not checked yetcites [133] Carswell EA Old LJ Kassel RL Green S Fiore N Williamson B An endotoxin-induced serum factor that causes necrosis of tumors Proc Natl Acad Sci USA 1975 72 3666 3670 1103152 PMC433057
- Not checked yetcites [134] Pennica D Nedwin GE Hayflick JS Seeburg PH Derynck R Palladino MA Kohr WJ Aggarwal BB Goeddel DV Human tumour necrosis factor: precursor structure, expression and homology to lymphotoxin Nature 1984 312 724 729 6392892
- Not checked yetcites [135] Locksley RM Killeen N Lenardo MJ The TNF and TNF receptor superfamilies: integrating mammalian biology Cell 2001 104 487 501 11239407
plain- Asserted: passes — The authors put it forward as true.
- Checkable: passes — It can be checked against evidence.
- Load-bearing: fails — The paper’s conclusions may not depend on it.
- Based: passes — The paper gives a reason why it holds.
Probably not a substantial claim. The paper’s conclusions may not depend on it. It may state two separate claims as one.
None of the sources cited for this claim have been checked yet.
In the paper
“In this way, TNF-α treatment decreased the expression of PPAR-γ and repressed genes involved in lipid and glucose uptake[138,139].”
§ Nutrition, insulin resistance and dysfunctional adipose tissue determine the different components of metabolic syndrome > EFFECT OF HORMONES AND ADIPOKINES ON ADIPOGENESIS > Major adipokines
What the sources say
- Not checked yetcites [138] Xing H Northrop JP Grove JR Kilpatrick KE Su JL Ringold GM TNF alpha-mediated inhibition and reversal of adipocyte differentiation is accompanied by suppressed expression of PPARgamma without effects on Pref-1 expression Endocrinology 1997 138 2776 2783 9202217
- Not checked yetcites [139] Ruan H Hacohen N Golub TR Van Parijs L Lodish HF Tumor necrosis factor-alpha suppresses adipocyte-specific genes and activates expression of preadipocyte genes in 3T3-L1 adipocytes: nuclear factor-kappaB activation by TNF-alpha is obligatory Diabetes 2002 51 1319 1336 11978627
plaindirect- Asserted: passes — The authors put it forward as true.
- Checkable: passes — It can be checked against evidence.
- Load-bearing: unclear — It is unclear whether the paper’s conclusions depend on it.
- Based: passes — The paper gives a reason why it holds.
It may state two separate claims as one.
None of the sources cited for this claim have been checked yet.
In the paper
“Omentin 1 is decreased in obese women with polycystic ovary syndrome (PCOS), both glucose and insulin negatively regulate omentin-1 levels ex vivo and in vivo, and women with PCOS who were treated with metformin increased serum omentin levels[148,149].”
§ Nutrition, insulin resistance and dysfunctional adipose tissue determine the different components of metabolic syndrome > EFFECT OF HORMONES AND ADIPOKINES ON ADIPOGENESIS > Others main adipokines
What the sources say
- Not checked yetcites [148] Tan BK Adya R Farhatullah S Lewandowski KC O’Hare P Lehnert H Randeva HS Omentin-1, a novel adipokine, is decreased in overweight insulin-resistant women with polycystic ovary syndrome: ex vivo and in vivo regulation of omentin-1 by insulin and glucose Diabetes 2008 57 801 808 18174521
- Not checked yetcites [149] Tan BK Adya R Farhatullah S Chen J Lehnert H Randeva HS Metformin treatment may increase omentin-1 levels in women with polycystic ovary syndrome Diabetes 2010 59 3023 3031 20852028 PMC2992762
plaindirect- Asserted: passes — The authors put it forward as true.
- Checkable: passes — It can be checked against evidence.
- Load-bearing: unclear — It is unclear whether the paper’s conclusions depend on it.
- Based: passes — The paper gives a reason why it holds.
It may state two separate claims as one.
In the paper
“DGAT1-deficient mice are resistant to diet-induced obesity associated with a higher energy expenditure.”
§ Nutrition, insulin resistance and dysfunctional adipose tissue determine the different components of metabolic syndrome > EFFECT OF HORMONES AND ADIPOKINES ON ADIPOGENESIS > Effect of fatty acid metabolism and enzymes on adipogenesis
What the sources say
- Not checked yetcites [161] Yu YH Zhang Y Oelkers P Sturley SL Rader DJ Ginsberg HN Posttranscriptional control of the expression and function of diacylglycerol acyltransferase-1 in mouse adipocytes J Biol Chem 2002 277 50876 50884 12407108
plaincorrelational- Asserted: passes — The authors put it forward as true.
- Checkable: passes — It can be checked against evidence.
- Load-bearing: unclear — It is unclear whether the paper’s conclusions depend on it.
- Based: passes — The paper gives a reason why it holds.
It may state two separate claims as one.
None of the sources cited for this claim have been checked yet.
In the paper
“The action of leptin is essential for energy metabolism, but is also involved in the mobilization of lipids from different fat depots and may be related to the protection of some tissues on lipotoxicity syndrome[125,126].”
§ Nutrition, insulin resistance and dysfunctional adipose tissue determine the different components of metabolic syndrome > EFFECT OF HORMONES AND ADIPOKINES ON ADIPOGENESIS > Major adipokines
What the sources say
- Not checked yetcites [125] Unger RH Zhou YT Lipotoxicity of beta-cells in obesity and in other causes of fatty acid spillover Diabetes 2001 50 Suppl 1 S118 S121 11272168
- Not checked yetcites [126] Unger RH Orci L Diseases of liporegulation: new perspective on obesity and related disorders FASEB J 2001 15 312 321 11156947
hedgedconditional- Asserted: passes — The authors put it forward as true.
- Checkable: passes — It can be checked against evidence.
- Load-bearing: unclear — It is unclear whether the paper’s conclusions depend on it.
- Based: passes — The paper gives a reason why it holds.
It may state two separate claims as one.
None of the sources cited for this claim have been checked yet.
In the paper
“Adiponectin is involved in lipid oxidation in skeletal muscle and in the liver, and moreover reduce hepatic production glucose load and postprandial hyperglycemic[128,129].”
§ Nutrition, insulin resistance and dysfunctional adipose tissue determine the different components of metabolic syndrome > EFFECT OF HORMONES AND ADIPOKINES ON ADIPOGENESIS > Major adipokines
What the sources say
- Not checked yetcites [128] Fruebis J Tsao TS Javorschi S Ebbets-Reed D Erickson MR Yen FT Bihain BE Lodish HF Proteolytic cleavage product of 30-kDa adipocyte complement-related protein increases fatty acid oxidation in muscle and causes weight loss in mice Proc Natl Acad Sci USA 2001 98 2005 2010 11172066 PMC29372
- Not checked yetcites [129] Xu A Wang Y Keshaw H Xu LY Lam KS Cooper GJ The fat-derived hormone adiponectin alleviates alcoholic and nonalcoholic fatty liver diseases in mice J Clin Invest 2003 112 91 100 12840063 PMC162288
plaindirect- Asserted: passes — The authors put it forward as true.
- Checkable: passes — It can be checked against evidence.
- Load-bearing: unclear — It is unclear whether the paper’s conclusions depend on it.
- Based: passes — The paper gives a reason why it holds.
It may state two separate claims as one.
In the paper
“On the other hand, adiponectin have a key role like insulinsensitizing, anti-inflammatory, anti-apoptotic and pro-angiogenic properties increasing the metabolic flexibility of adipose tissue, i.e., to make adipose tissue more efficient at discharging FFAs when are required and upgrade the rate of FFA re-esterification during the postprandial state[168].”
§ Nutrition, insulin resistance and dysfunctional adipose tissue determine the different components of metabolic syndrome > OBESITY AND LIPOTOXICITY SYNDROME
What the sources say
- Not checked yetcites [168] Asterholm IW Scherer PE Enhanced metabolic flexibility associated with elevated adiponectin levels Am J Pathol 2010 176 1364 1376 20093494 PMC2832156
plaindirect- Asserted: passes — The authors put it forward as true.
- Checkable: passes — It can be checked against evidence.
- Load-bearing: passes — The paper’s conclusions depend on it.
- Based: passes — The paper gives a reason why it holds.
It may state two separate claims as one.
In the paper
“While overexpression of DGAT1 resulting in increased adipose tissue without affecting IS, but increased the secretion of TNF, which interferes with insulin signaling[161].”
§ Nutrition, insulin resistance and dysfunctional adipose tissue determine the different components of metabolic syndrome > EFFECT OF HORMONES AND ADIPOKINES ON ADIPOGENESIS > Effect of fatty acid metabolism and enzymes on adipogenesis
What the sources say
- Not checked yetcites [161] Yu YH Zhang Y Oelkers P Sturley SL Rader DJ Ginsberg HN Posttranscriptional control of the expression and function of diacylglycerol acyltransferase-1 in mouse adipocytes J Biol Chem 2002 277 50876 50884 12407108
plaindirect- Asserted: passes — The authors put it forward as true.
- Checkable: passes — It can be checked against evidence.
- Load-bearing: unclear — It is unclear whether the paper’s conclusions depend on it.
- Based: passes — The paper gives a reason why it holds.
It may state two separate claims as one.
In the paper
“Finally, IL-6 is synthesized by adipocytes and appears to be associated with elevated levels of CRP and inflammatory states found in obese patients[140].”
§ Nutrition, insulin resistance and dysfunctional adipose tissue determine the different components of metabolic syndrome > EFFECT OF HORMONES AND ADIPOKINES ON ADIPOGENESIS > Major adipokines
What the sources say
- Not checked yetcites [140] Bastard JP Jardel C Delattre J Hainque B Bruckert E Oberlin F Evidence for a link between adipose tissue interleukin-6 content and serum C-reactive protein concentrations in obese subjects Circulation 1999 99 2221 2222 10217702
hedgedcorrelational- Asserted: passes — The authors put it forward as true.
- Checkable: passes — It can be checked against evidence.
- Load-bearing: unclear — It is unclear whether the paper’s conclusions depend on it.
- Based: passes — The paper gives a reason why it holds.
It may state two separate claims as one.
In the paper
“It has also been found that high-protein and low glycemic index (GI) diets are better tolerated than low-protein with high GI. In addition, the low protein with high GI diet was associated with subsequent significant weight regain[236].”
§ Nutrition, insulin resistance and dysfunctional adipose tissue determine the different components of metabolic syndrome > EFFECTS OF NUTRITION ON METS COMPONENTS > Effects of nutrition on obesity
What the sources say
- Not checked yetcites [236] Larsen TM Dalskov SM van Baak M Jebb SA Papadaki A Pfeiffer AF Martinez JA Handjieva-Darlenska T Kunešová M Pihlsgård M Diets with high or low protein content and glycemic index for weight-loss maintenance N Engl J Med 2010 363 2102 2113 21105792 PMC3359496
plaincorrelational- Asserted: passes — The authors put it forward as true.
- Checkable: passes — It can be checked against evidence.
- Load-bearing: unclear — It is unclear whether the paper’s conclusions depend on it.
- Based: passes — The paper gives a reason why it holds.
It may state two separate claims as one.
In the paper
“They concluded that three abnormal findings out of five would be sufficient to diagnose a person as having MetS.”
§ Nutrition, insulin resistance and dysfunctional adipose tissue determine the different components of metabolic syndrome > FROM OBESITY AND INSULIN RESISTANCE TO METS
What the sources say
- Not checked yetcites [66] Alberti KG Eckel RH Grundy SM Zimmet PZ Cleeman JI Donato KA Fruchart JC James WP Loria CM Smith SC Harmonizing the metabolic syndrome: a joint interim statement of the International Diabetes Federation Task Force on Epidemiology and Prevention; National Heart, Lung, and Blood Institute; American Heart Association; World Heart Federation; International Atherosclerosis Society; and International Association for the Study of Obesity Circulation 2009 120 1640 1645 19805654
plain- Asserted: passes — The authors put it forward as true.
- Checkable: passes — It can be checked against evidence.
- Load-bearing: fails — The paper’s conclusions may not depend on it.
- Based: passes — The paper gives a reason why it holds.
Probably not a substantial claim. The paper’s conclusions may not depend on it.
In the paper
“Moreover, the substitution in the diet of saturated with unsaturated fat, mainly MUFA, resulted in little but consistent loss of body weight, decreased body fat content in limbs and trunk, while maintaining a high and isocaloric fat content (approximately 40%)[244].”
§ Nutrition, insulin resistance and dysfunctional adipose tissue determine the different components of metabolic syndrome > EFFECTS OF NUTRITION ON METS COMPONENTS > Effects of nutrition on central fat distribution
What the sources say
- Not checked yetcites [244] Piers LS Walker KZ Stoney RM Soares MJ O’Dea K Substitution of saturated with monounsaturated fat in a 4-week diet affects body weight and composition of overweight and obese men Br J Nutr 2003 90 717 727 13129479
plaindirect- Asserted: passes — The authors put it forward as true.
- Checkable: passes — It can be checked against evidence.
- Load-bearing: unclear — It is unclear whether the paper’s conclusions depend on it.
- Based: passes — The paper gives a reason why it holds.
It may state two separate claims as one.
In the paper
“Moreover, the DGAC also found that sodium and saturated fat are being over-consumed by Americans, and probably in many westernized countries as well.”
§ Nutrition, insulin resistance and dysfunctional adipose tissue determine the different components of metabolic syndrome > EFFECTS OF NUTRITION ON METS COMPONENTS
What the sources say
- Not checked yetcites [225] Office of Disease Prevention and Health Promotion Scientific report of the 2015 dietary guidelines advisory committee. [accessed 2015 Feb 20] Available from: http://www.health.gov/dietaryguidelines/2015-scientific-report/PDFs/Scientific-Report-of-the-2015-Dietary-Guidelines-Advisory-Committee.pdf
hedged- Asserted: passes — The authors put it forward as true.
- Checkable: passes — It can be checked against evidence.
- Load-bearing: fails — The paper’s conclusions may not depend on it.
- Based: passes — The paper gives a reason why it holds.
Probably not a substantial claim. The paper’s conclusions may not depend on it. It may state two separate claims as one.
None of the sources cited for this claim have been checked yet.
In the paper
“There is evidence to show that metabolic stressors including energy-dense high-fat diets develop obesity, and probably insulin resistance and MetS[228-230].”
§ Nutrition, insulin resistance and dysfunctional adipose tissue determine the different components of metabolic syndrome > EFFECTS OF NUTRITION ON METS COMPONENTS > Effects of nutrition on obesity
What the sources say
- Not checked yetcites [228] Storlien LH Baur LA Kriketos AD Pan DA Cooney GJ Jenkins AB Calvert GD Campbell LV Dietary fats and insulin action Diabetologia 1996 39 621 631 8781757
- Not checked yetcites [229] Feskens EJ Virtanen SM Räsänen L Tuomilehto J Stengård J Pekkanen J Nissinen A Kromhout D Dietary factors determining diabetes and impaired glucose tolerance. A 20-year follow-up of the Finnish and Dutch cohorts of the Seven Countries Study Diabetes Care 1995 18 1104 1112 7587845
- Not checked yetcites [230] Melanson EL Astrup A Donahoo WT The relationship between dietary fat and fatty acid intake and body weight, diabetes, and the metabolic syndrome Ann Nutr Metab 2009 55 229 243 19752544
hedgedconditional- Asserted: passes — The authors put it forward as true.
- Checkable: passes — It can be checked against evidence.
- Load-bearing: passes — The paper’s conclusions depend on it.
- Based: passes — The paper gives a reason why it holds.
It may state two separate claims as one.
In the paper
“In this issue, the Nurses’ Health Study showed just a weak direct association between whole fat intake and overweight. However, when the proportion of SFA and TFA was higher it showed a strong relationship to obesity, but the consumption of MUFA and PUFA were not associated[242].”
§ Nutrition, insulin resistance and dysfunctional adipose tissue determine the different components of metabolic syndrome > EFFECTS OF NUTRITION ON METS COMPONENTS > Effects of nutrition on central fat distribution
What the sources say
- Not checked yetcites [242] Field AE Willett WC Lissner L Colditz GA Dietary fat and weight gain among women in the Nurses’ Health Study Obesity (Silver Spring) 2007 15 967 976 17426332
plaincorrelational- Asserted: passes — The authors put it forward as true.
- Checkable: passes — It can be checked against evidence.
- Load-bearing: passes — The paper’s conclusions depend on it.
- Based: passes — The paper gives a reason why it holds.
It may state two separate claims as one.
In the paper
“IDF provides the following criteria to define MetS: Central (abdominal) obesity is readily measured using waist circumference and is particularly related with each of the other MetS components, singularly with insulin resistance, and “is a prerequisite risk factor”.”
§ Nutrition, insulin resistance and dysfunctional adipose tissue determine the different components of metabolic syndrome > FROM OBESITY AND INSULIN RESISTANCE TO METS
What the sources say
- Not checked yetcites [202] Alberti KG Zimmet P Shaw J Metabolic syndrome--a new world-wide definition. A Consensus Statement from the International Diabetes Federation Diabet Med 2006 23 469 480 16681555
plaincorrelational- Asserted: passes — The authors put it forward as true.
- Checkable: passes — It can be checked against evidence.
- Load-bearing: passes — The paper’s conclusions depend on it.
- Based: passes — The paper gives a reason why it holds.
Probably not a substantial claim. It may state two separate claims as one.
In the paper
“At 2 years of follow-up, patients consuming the Mediterranean diet had significantly reduced serum concentrations of hs-CRP, interleukins, as well as IS, and endothelial function score were improved.”
§ Nutrition, insulin resistance and dysfunctional adipose tissue determine the different components of metabolic syndrome > EFFECTS OF NUTRITION ON METS COMPONENTS
What the sources say
- Not checked yetcites [226] Esposito K Marfella R Ciotola M Di Palo C Giugliano F Giugliano G D’Armiento M D’Andrea F Giugliano D Effect of a mediterranean-style diet on endothelial dysfunction and markers of vascular inflammation in the metabolic syndrome: a randomized trial JAMA 2004 292 1440 1446 15383514
plaindirect- Asserted: passes — The authors put it forward as true.
- Checkable: passes — It can be checked against evidence.
- Load-bearing: passes — The paper’s conclusions depend on it.
- Based: passes — The paper gives a reason why it holds.
It may state two separate claims as one.
In the paper
“It has been proposed that high adiposity and central fat deposit is related to diets with a high ratio of saturated to unsaturated fatty acids[115].”
§ Nutrition, insulin resistance and dysfunctional adipose tissue determine the different components of metabolic syndrome > EFFECTS OF NUTRITION ON METS COMPONENTS > Effects of nutrition on central fat distribution
What the sources say
- Not checked yetcites [115] Paniagua JA Escandell-Morales JM Gil-Contreras D Berral de la Rosa FJ Romero-Jimenez M Gómez-Urbano A Sanchez-Lopez A Bellido E Poyato A Calatayud B Central obesity and altered peripheral adipose tissue gene expression characterize the NAFLD patient with insulin resistance: Role of nutrition and insulin challenge Nutrition 2014 30 177 185 24377452
hedgedcorrelational- Asserted: passes — The authors put it forward as true.
- Checkable: passes — It can be checked against evidence.
- Load-bearing: fails — The paper’s conclusions may not depend on it.
- Based: passes — The paper gives a reason why it holds.
Probably not a substantial claim. The paper’s conclusions may not depend on it.
None of the sources cited for this claim have been checked yet.
In the paper
“A Mediterranean diet supplemented with extra-virgin olive oil or nuts reduced the incidence of major cardiovascular events and prevalence of MetS[38,227].”
§ Nutrition, insulin resistance and dysfunctional adipose tissue determine the different components of metabolic syndrome > EFFECTS OF NUTRITION ON METS COMPONENTS
What the sources say
- Not checked yetcites [38] Estruch R Ros E Salas-Salvadó J Covas MI Corella D Arós F Gómez-Gracia E Ruiz-Gutiérrez V Fiol M Lapetra J Primary prevention of cardiovascular disease with a Mediterranean diet N Engl J Med 2013 368 1279 1290 29897867
- Not checked yetcites [227] Babio N Toledo E Estruch R Ros E Martínez-González MA Castañer O Bulló M Corella D Arós F Gómez-Gracia E Mediterranean diets and metabolic syndrome status in the PREDIMED randomized trial CMAJ 2014 186 E649 E657 25316904 PMC4234734
plaindirect- Asserted: passes — The authors put it forward as true.
- Checkable: passes — It can be checked against evidence.
- Load-bearing: passes — The paper’s conclusions depend on it.
- Based: passes — The paper gives a reason why it holds.
It may state two separate claims as one.
In the paper
“When it is > 102 cm in men and > 88 cm in women it is called abdominal obesity, which is a high risk factor of MetS[194].”
§ Nutrition, insulin resistance and dysfunctional adipose tissue determine the different components of metabolic syndrome > FROM OBESITY AND INSULIN RESISTANCE TO METS
What the sources say
- Not checked yetcites [194] Grundy SM Hypertriglyceridemia, insulin resistance, and the metabolic syndrome Am J Cardiol 1999 83 25F 29F 10357572
plaincorrelational- Asserted: passes — The authors put it forward as true.
- Checkable: passes — It can be checked against evidence.
- Load-bearing: fails — The paper’s conclusions may not depend on it.
- Based: passes — The paper gives a reason why it holds.
Probably not a substantial claim. The paper’s conclusions may not depend on it. It may state two separate claims as one.
A conclusion the paper draws from its own results — it cites no other source for it, so there is none to check. The quote shows it is in the paper.
In the paper
“But, residual confounding factors, such as cholesterol-lowering therapy and trans fat intake or limited variation in SFA and PUFA intake, may explain these findings.”
§ Nutrition, insulin resistance and dysfunctional adipose tissue determine the different components of metabolic syndrome > EFFECTS OF NUTRITION ON METS COMPONENTS > Effects of nutrition on obesity
hedgedconditional- Asserted: passes — The authors put it forward as true.
- Checkable: passes — It can be checked against evidence.
- Load-bearing: passes — The paper’s conclusions depend on it.
- Based: passes — The paper gives a reason why it holds.
Probably not a substantial claim.
None of the sources cited for this claim have been checked yet.
In the paper
“At the same time (1999) the expert committee of the WHO described MetS as a cardiovascular disorder associated with insulin resistance.”
§ Nutrition, insulin resistance and dysfunctional adipose tissue determine the different components of metabolic syndrome > FROM OBESITY AND INSULIN RESISTANCE TO METS
What the sources say
- Not checked yetcites [200] Alberti KG Zimmet PZ Definition, diagnosis and classification of diabetes mellitus and its complications. Part 1: diagnosis and classification of diabetes mellitus provisional report of a WHO consultation Diabet Med 1998 15 539 553 9686693
- Not checked yetcites [201] World Health Organization Definition, diagnosis and classification of diabetes mellitus and its complications: Report of a WHO Consultation. Part 1: Diagnosis and classification of diabetes mellitus Geneva, Switzerland World Health Organization, 1999. [accessed 2003 Dec 12] Available from: http://whqlibdoc.who.int/hq/1999/WHO_NCD_NCS_99.2.pdf
plaincorrelational- Asserted: passes — The authors put it forward as true.
- Checkable: passes — It can be checked against evidence.
- Load-bearing: fails — The paper’s conclusions may not depend on it.
- Based: passes — The paper gives a reason why it holds.
Probably not a substantial claim. The paper’s conclusions may not depend on it.
None of the sources cited for this claim have been checked yet.
In the paper
“Therefore, several controlled intervention studies demonstrated that dietary fiber content in the diet is negatively associated with weight gain, and may have a satiating effect and decreases the amount of calories ingested[240,241].”
§ Nutrition, insulin resistance and dysfunctional adipose tissue determine the different components of metabolic syndrome > EFFECTS OF NUTRITION ON METS COMPONENTS > Effects of nutrition on obesity
What the sources say
- Not checked yetcites [240] Parnell JA Reimer RA Weight loss during oligofructose supplementation is associated with decreased ghrelin and increased peptide YY in overweight and obese adults Am J Clin Nutr 2009 89 1751 1759 19386741 PMC3827013
- Not checked yetcites [241] Cani PD Joly E Horsmans Y Delzenne NM Oligofructose promotes satiety in healthy human: a pilot study Eur J Clin Nutr 2006 60 567 572 16340949
boostedconditional- Asserted: passes — The authors put it forward as true.
- Checkable: passes — It can be checked against evidence.
- Load-bearing: unclear — It is unclear whether the paper’s conclusions depend on it.
- Based: passes — The paper gives a reason why it holds.
It may state two separate claims as one.
In the paper
“In addition, a higher intake of red and processed meats are shown as harmful compared with a lower intake, and higher ingestion of sugar-sweetened foods and beverages as well as derived of refined grains have been found damaging with moderate to strong evidence.”
§ Nutrition, insulin resistance and dysfunctional adipose tissue determine the different components of metabolic syndrome > EFFECTS OF NUTRITION ON METS COMPONENTS
What the sources say
- Not checked yetcites [225] Office of Disease Prevention and Health Promotion Scientific report of the 2015 dietary guidelines advisory committee. [accessed 2015 Feb 20] Available from: http://www.health.gov/dietaryguidelines/2015-scientific-report/PDFs/Scientific-Report-of-the-2015-Dietary-Guidelines-Advisory-Committee.pdf
boosteddirect- Asserted: passes — The authors put it forward as true.
- Checkable: passes — It can be checked against evidence.
- Load-bearing: passes — The paper’s conclusions depend on it.
- Based: passes — The paper gives a reason why it holds.
It may state two separate claims as one.
In the paper
“In addition, MUFA and PUFA fat intake have been associated with healthy effects on body fat distribution and improved some other metabolic disorders, as compared with SFA and TFA intake, while maintaining stable body weight.”
§ Nutrition, insulin resistance and dysfunctional adipose tissue determine the different components of metabolic syndrome > EFFECTS OF NUTRITION ON METS COMPONENTS > Effects of nutrition on central fat distribution
What the sources say
- Not checked yetcites [242] Field AE Willett WC Lissner L Colditz GA Dietary fat and weight gain among women in the Nurses’ Health Study Obesity (Silver Spring) 2007 15 967 976 17426332
plaincorrelational- Asserted: passes — The authors put it forward as true.
- Checkable: passes — It can be checked against evidence.
- Load-bearing: passes — The paper’s conclusions depend on it.
- Based: passes — The paper gives a reason why it holds.
It may state two separate claims as one.
In the paper
“However, IDF dropped the WHO requirement for insulin resistance but made abdominal obesity necessary as 1 of 5 factors required in the diagnosis.”
§ Nutrition, insulin resistance and dysfunctional adipose tissue determine the different components of metabolic syndrome > FROM OBESITY AND INSULIN RESISTANCE TO METS
What the sources say
- Not checked yetcites [202] Alberti KG Zimmet P Shaw J Metabolic syndrome--a new world-wide definition. A Consensus Statement from the International Diabetes Federation Diabet Med 2006 23 469 480 16681555
plain- Asserted: passes — The authors put it forward as true.
- Checkable: passes — It can be checked against evidence.
- Load-bearing: unclear — It is unclear whether the paper’s conclusions depend on it.
- Based: passes — The paper gives a reason why it holds.
It may state two separate claims as one.
In the paper
“The IDF and AHA/NHLBI agreed that central obesity may not be a prerequisite for diagnosing MetS but could be one of the 5 criteria[66].”
§ Nutrition, insulin resistance and dysfunctional adipose tissue determine the different components of metabolic syndrome > FROM OBESITY AND INSULIN RESISTANCE TO METS
What the sources say
- Not checked yetcites [66] Alberti KG Eckel RH Grundy SM Zimmet PZ Cleeman JI Donato KA Fruchart JC James WP Loria CM Smith SC Harmonizing the metabolic syndrome: a joint interim statement of the International Diabetes Federation Task Force on Epidemiology and Prevention; National Heart, Lung, and Blood Institute; American Heart Association; World Heart Federation; International Atherosclerosis Society; and International Association for the Study of Obesity Circulation 2009 120 1640 1645 19805654
hedged- Asserted: passes — The authors put it forward as true.
- Checkable: passes — It can be checked against evidence.
- Load-bearing: fails — The paper’s conclusions may not depend on it.
- Based: passes — The paper gives a reason why it holds.
Probably not a substantial claim. The paper’s conclusions may not depend on it. It may state two separate claims as one.
A conclusion the paper draws from its own results — it cites no other source for it, so there is none to check. The quote shows it is in the paper.
In the paper
“In the prevention and treatment of MetS it has been found that it is not one specific diet, but rather various changes of nutrients in the diet that should be recommended to treat or prevent the onset of each different component of the syndrome.”
§ Nutrition, insulin resistance and dysfunctional adipose tissue determine the different components of metabolic syndrome > EFFECTS OF NUTRITION ON METS COMPONENTS
plaindirect- Asserted: passes — The authors put it forward as true.
- Checkable: passes — It can be checked against evidence.
- Load-bearing: passes — The paper’s conclusions depend on it.
- Based: passes — The paper gives a reason why it holds.
Probably not a substantial claim.
What the paper did — it cites no source for this, so there is none to check. The quote shows it is in the paper.
In the paper
“P-values for multiple comparisons were adjusted by Hommel’s test.”
§ Nutrition, insulin resistance and dysfunctional adipose tissue determine the different components of metabolic syndrome > EFFECTS OF NUTRITION ON METS COMPONENTS > Effect of nutrition on adipokines
plain- Asserted: passes — The authors put it forward as true.
- Checkable: passes — It can be checked against evidence.
- Load-bearing: fails — The paper’s conclusions may not depend on it.
- Based: passes — The paper gives a reason why it holds.
Probably not a substantial claim. The paper’s conclusions may not depend on it.
In the paper
“In addition, moderate ingestion of red wine is related with a inferior prevalence of MetS, as well as with beneficial effects on central adiposity, lipid profile and fasting insulin levels[274].”
§ Nutrition, insulin resistance and dysfunctional adipose tissue determine the different components of metabolic syndrome > EFFECTS OF NUTRITION ON METS COMPONENTS > Effect of nutrition on oxidative stress
What the sources say
- Not checked yetcites [274] Freiberg MS, Cabral HJ, Heeren TC, Vasan RS, Curtis Ellison R; Third National Health and Nutrition Examination Survey Alcohol consumption and the prevalence of the Metabolic Syndrome in the US.: a cross-sectional analysis of data from the Third National Health and Nutrition Examination Survey Diabetes Care 2004 27 2954 2959 15562213
plaincorrelational- Asserted: passes — The authors put it forward as true.
- Checkable: passes — It can be checked against evidence.
- Load-bearing: unclear — It is unclear whether the paper’s conclusions depend on it.
- Based: passes — The paper gives a reason why it holds.
It may state two separate claims as one.
None of the sources cited for this claim have been checked yet.
In the paper
“Finally, it was found that conjugated linoleic acids (CLA) produces a reduction on adiposity whereas the lean body mass was not altered or increased, and the waist-hip ratio decreased significantly compared with placebo in adults[248,249].”
§ Nutrition, insulin resistance and dysfunctional adipose tissue determine the different components of metabolic syndrome > EFFECTS OF NUTRITION ON METS COMPONENTS > Effects of nutrition on central fat distribution
What the sources say
- Not checked yetcites [248] Gaullier JM Halse J Høye K Kristiansen K Fagertun H Vik H Gudmundsen O Conjugated linoleic acid supplementation for 1 y reduces body fat mass in healthy overweight humans Am J Clin Nutr 2004 79 1118 1125 15159244
- Not checked yetcites [249] Gaullier JM Halse J Høivik HO Høye K Syvertsen C Nurminiemi M Hassfeld C Einerhand A O’Shea M Gudmundsen O Six months supplementation with conjugated linoleic acid induces regional-specific fat mass decreases in overweight and obese Br J Nutr 2007 97 550 560 17313718
plaindirect- Asserted: passes — The authors put it forward as true.
- Checkable: passes — It can be checked against evidence.
- Load-bearing: passes — The paper’s conclusions depend on it.
- Based: passes — The paper gives a reason why it holds.
It may state two separate claims as one.
What the paper did — it cites no source for this, so there is none to check. The quote shows it is in the paper.
In the paper
“Gene-chip normalization avoids the use of unstable single housekeeping genes and thus can be technically superior for clinical biomarker studies.”
§ Nutrition, insulin resistance and dysfunctional adipose tissue determine the different components of metabolic syndrome > EFFECTS OF NUTRITION ON METS COMPONENTS > Effect of nutrition on adipokines
plaindirect- Asserted: passes — The authors put it forward as true.
- Checkable: fails — It may be too vague to check against evidence.
- Load-bearing: fails — The paper’s conclusions may not depend on it.
- Based: fails — The paper may give no reason why it holds.
Probably not a substantial claim. It may be too vague to check against evidence. The paper’s conclusions may not depend on it. The paper may give no reason why it holds. It may state two separate claims as one.
In the paper
“Recently, the long-term consumption of a LFHCC diet increased fasting FABP4 expression in adipose tissue, while it was reduced by the consumption of LFHCC supplemented with n-3 diet[247].”
§ Nutrition, insulin resistance and dysfunctional adipose tissue determine the different components of metabolic syndrome > EFFECTS OF NUTRITION ON METS COMPONENTS > Effects of nutrition on central fat distribution
What the sources say
- Not checked yetcites [247] Camargo A Meneses ME Perez-Martinez P Delgado-Lista J Jimenez-Gomez Y Cruz-Teno C Tinahones FJ Paniagua JA Perez-Jimenez F Roche HM Dietary fat differentially influences the lipids storage on the adipose tissue in metabolic syndrome patients Eur J Nutr 2014 53 617 626 23922010
plaindirect- Asserted: passes — The authors put it forward as true.
- Checkable: passes — It can be checked against evidence.
- Load-bearing: unclear — It is unclear whether the paper’s conclusions depend on it.
- Based: passes — The paper gives a reason why it holds.
It may state two separate claims as one.
In the paper
“In another study it was found that the rate of body fat lowered in the CLA-treated group, whereas body weight, BMI, and central abdominal diameter were unmodified[250].”
§ Nutrition, insulin resistance and dysfunctional adipose tissue determine the different components of metabolic syndrome > EFFECTS OF NUTRITION ON METS COMPONENTS > Effects of nutrition on central fat distribution
What the sources say
- Not checked yetcites [250] Smedman A Vessby B Conjugated linoleic acid supplementation in humans--metabolic effects Lipids 2001 36 773 781 11592727
plaindirect- Asserted: passes — The authors put it forward as true.
- Checkable: passes — It can be checked against evidence.
- Load-bearing: unclear — It is unclear whether the paper’s conclusions depend on it.
- Based: passes — The paper gives a reason why it holds.
It may state two separate claims as one.
The paper relies on this without support.
High-carbohydrate rich diets increase postprandial peaks of insulin and glucose.
“High-carbohydrate rich (CHO) diets increase postprandial peaks of insulin and glucose.”
The paper relies on this without support.
Triglyceride-rich lipoproteins are increased by high-carbohydrate rich diets, which interferes with reverse cholesterol transport lowering HDL cholesterol.
“Triglyceride-rich lipoproteins are also increased, which interferes with reverse cholesterol transport lowering high-density lipoprotein cholesterol.”
The paper relies on this without support.
CHO-rich diets could move fat from peripheral to central deposits and reduce adiponectin activity in peripheral adipose tissue.
“In addition, CHO-rich diets could move fat from peripheral to central deposits and reduce adiponectin activity in peripheral adipose tissue.”
The paper relies on this without support.
MUFA-rich diets improve the effects of CHO-rich diets on postprandial insulin and glucose, triglyceride-rich lipoproteins, HDL cholesterol, fat distribution and adiponectin activity.
“All these are improved with monounsaturated fatty acid-rich diets.”
The paper relies on this without support.
Increased portions of ω-3 and ω-6 fatty acids decrease triglyceride levels.
“Lastly, increased portions of ω-3 and ω-6 fatty acids also decrease triglyceride levels, and complement the healthy diet that is recommended in patients with MetS.”
The paper relies on this without support.
The type of fat consumed could be more decisive than the total amount of fat consumed for changes in body composition and distribution of adipose tissue.
“However, it is well established that the type of fat consumed could be more decisive than the total amount of fat consumed when we only look at changes in body composition and distribution of adipose tissue.”
The paper relies on this without support.
Insulin resistance is a feature of MetS and is associated with other components of the syndrome.
“In addition, insulin resistance is a feature of MetS and is associated with other components of the syndrome.”
The paper relies on this without support.
The beneficial impact of fat quality on insulin sensitivity was not seen in individuals with a high fat intake (> 37E%).
“The beneficial impact of fat quality on insulin sensitivity (IS) was not seen in individuals with a high fat intake (> 37E%).”
The paper relies on this without support.
Glycemic load, excess fructose, and amount of dietary fiber influence various components of MetS.
“Other dietary factors that can influence various components of MetS, like postprandial glycemic and insulin levels, triglycerides and high-density lipoprotein (HDL)-C levels, weight regulation and body composition, as well as fatty liver, are the glycemic load (GL) and the excess of fructose, and amount of dietary fiber content of food eaten.”
The paper relies on this without support.
Increased levels of triglycerides associated with hypoalphalipoproteinemia are a feature of insulin resistance and MetS, and increase cardiovascular risk regardless of LDL cholesterol levels.
“The increased levels of triglycerides associated with hypoalphalipoproteinemia are a feature of insulin resistance and MetS, and increase cardiovascular risk regardless of low-density lipoprotein (LDL) cholesterol levels.”
The paper relies on this without support.
A higher intake of dietary fiber, particularly soluble type, above the level recommended by the ADA improves glycemic control, decreases hyperinsulinemia, and lowers plasma lipid concentrations in patients with type 2 diabetes.
“However, more beneficial effects of a higher intake of dietary fiber, particularly of the soluble type, above the level recommended by the ADA, were reported to improve glycemic control, decreases hyperinsulinemia, and lower plasma lipid concentrations in patients with type 2 diabetes.”
The paper relies on this without support.
The prevalence of enlarged waist circumference, hypertension and hypertriacylglycerolemia were reduced after the isoenergetic low fat high complex carbohydrates supplemented with ω-3 diet.
“Lastly, the prevalence of enlarged waist circumference, hypertension and hypertriacylglycerolemia were reduced after the isoenergetic low fat high complex carbohydrates (LFHCC) supplemented with ω-3 diet.”
The paper relies on this without support.
The prevalence of MetS fell by 20.5% after LFHCC ω-3 diet compared with the high saturated fatty acids (10.6%), high MUFA (12%) or LFHCC (10.4%) diets.
“Thus, the prevalence of MetS fell by 20.5% after LFHCC ω-3 diet compared with the high saturated fatty acids (HSFA) (10.6%), high MUFA (HMUFA) (12%) or LFHCC (10.4%) diets.”
The paper relies on this without support.
An equilibrate calory diet, low in animal fat, sugar and fructose, high in MUFA and PUFA, fresh vegetables high in fiber, and with moderate complex carbohydrates portions, could improve weight loss, lower postprandial glucose and insulin levels, and decrease triglyceride levels, and eventually increase HDL cholesterol.
“In summary, an equilibrate calory diet, low in animal fat, sugar and fructose, high in MUFA and polyunsaturated fatty acids (PUFA), fresh vegetables high in fiber, and with moderate complex carbohydrates portions, could improve weight loss, lower postprandial glucose and insulin levels, and triglyceride levels could also decrease, and, eventually, increased HDL cholesterol levels are observed.”
The paper relies on this without support.
Adipose tissue can expand to levels of inflexibility.
“Adipose tissue could expand to levels of inflexibility.”
The paper relies on this without support.
Most diets in the world provide enough ω-6 and too little ω-3, with an increased ratio ω-6:ω-3.
“Today, most diets in the world provide enough ω-6 and too little ω-3, with an increased ratio ω-6:ω-3.”
The paper relies on this without support.
At what point adipose tissue begins to fail is determined by genetic and epigenetic factors.
“At what point the adipose tissue begins to fail is likely to be determined by genetic and epigenetic factors.”
The paper relies on this without support.
The link between obesity and associated metabolic abnormalities is better related to the topography, anatomical distribution and/or functional peculiarities of adipose tissue, and this is more relevant in patients with relatively normal weight.
“On top of all these factors, the link between obesity and associated metabolic abnormalities seems to be better related to the topography, anatomical distribution and/or the functional peculiarities of the adipose tissue, a phenomenon which seems to be more relevant in patients with relatively normal weight (Figures 2 and 3).”
The paper relies on this without support.
Many men with insulin resistance, T2D or MetS present low testosterone concentrations with high or low gonadotropins (25% and 4%, respectively).
“Finally, many men with insulin resistance, T2D or MetS present low testosterone concentrations with high or low gonadotropins (25% and 4%, respectively).”
The paper relies on this without support.
Most patients with features of MetS have increased blood pressure.
“Last, most patients with features of MetS have increased blood pressure.”
The paper relies on this without support.
Central obesity and/or insulin resistance are the main causative requirements for metabolic syndrome.
“While the pathogenesis of MetS and each of its components is complex, multifactorial and not well established, either central obesity and insulin resistance or both are recognized as the main causative requirements.”
The paper relies on this without support.
Most components of metabolic syndrome are correlated with a sedentary lifestyle.
“Most components of MetS are correlated with a sedentary lifestyle.”
The paper relies on this without support.
Metabolic syndrome prevalence and each of its components is directly related with age in most people on the world.
“MetS prevalence and each of its components is directly related with age in most people on the world.”
The paper relies on this without support.
High saturated fat and sugar diets are implicated in the development of fatty liver.
“Several mechanisms have implicated high SAT and sugar diets with the development of fatty liver.”
The paper relies on this without support.
High oxidative stress is found in MetS patients, shown by raised activity of NADPH-oxidase and reduced expression of antioxidant enzymes in adipose tissue.
“Moreover, a high oxidative stress is found in MetS patients, which is showed by a raised activity of NADPH-oxidase and a reduced expression of antioxidant enzymes in the adipose tissue.”
The paper relies on this without support.
MetS patients normally present a higher inflammatory state in adipose tissue, which is increased during the postprandial response, independent of the fat eaten.
“Last, MetS patients normally present higher inflammatory state in AT, which is increased during postprandial response, which was seen with independence of the fat eaten.”
The paper relies on this without support.
ER stress is related to activation of inflammation and stress networks, closely linked to oxidative stress and insulin resistance.
“ER stress has been related to many effects of disability cellular that include activation of inflammation and stress networks, closely linked to turn on with by oxidative stress and insulin resistance.”
The paper relies on this without support.
Semi-skimmed milk and derivatives and eggs provide proteins of high biological value, provide some essential minerals, and are reasonably low in fat.
“Both nutrients provide proteins of high biological value, provide some needs in essential minerals, and are reasonably low in fat.”
Claims other papers make about this one
Each is checked against this paper’s own text: does it say what the citing paper says it does?
In the citing paper
“Finally, obesity is associated with a state of chronic low-grade inflammation because ectopic fat depots release more inflammatory mediators than peripheral fat depots and infiltration of macrophages (24).”
From Metabolic Flexibility as an Adaptation to Energy Resources and Requirements in Health and Disease (2018) · cites this paper as [24]
Self-check
Percentages, sums and reported differences re-computed from the paper’s own numbers.
Each contradiction between two passages listed here was confirmed by an independent check.
Rated minor: it would not touch a result — a value no result rests on, a p-value that stays on the same side of the significance level, or a conflict that is clerical, resolved elsewhere in the paper, or outside its own findings.
In the paper
§ Nutrition, insulin resistance and dysfunctional adipose tissue determine the different components of metabolic syndrome > OBESITY ASSESSMENT
“Experimentally, it was observed that BMI = 30 kg/m2 implies approximately 30% of BF% at 20 years of age but increase to 40% at 60 year in men, while in older women these values were to 40% and 50%, respectively.”
§ Nutrition, insulin resistance and dysfunctional adipose tissue determine the different components of metabolic syndrome > OBESITY ASSESSMENT
“BF% = 1.2 × BMI + 0.23 × age - 5.4 - (10.8 × gender) (being 0 if gender is male and 1 if female; it differ for children).”
Citations
Cites
4 retracted
RETRACTED: Primary Prevention of Cardiovascular Disease with a Mediterranean Diet
Estruch, R., Ros, E., Salas-Salvadó, J., Covas, M.-I., Corella, D., Arós, F., Gómez-Gracia, E., Ruiz-Gutiérrez, V., Fiol, M., Lapetra, J., et al. (2013) · New England Journal of Medicine · doi:10.1056/nejmoa1200303 · Cited by 4,257
RetractedVisfatin: A Protein Secreted by Visceral Fat That Mimics the Effects of Insulin
Fukuhara, A., Matsuda, M., Nishizawa, M., Segawa, K., Tanaka, M., Kishimoto, K., Matsuki, Y., Murakami, M., Ichisaka, T., Murakami, H., et al. (2005) · Science · doi:10.1126/science.1097243 · Cited by 1,906
RetractedEstruch, R., Ros, E., Salas-Salvadó, J., Covas, M.-I., Corella, D., Arós, F., Gómez-Gracia, E., Ruiz-Gutiérrez, V., Fiol, M., Lapetra, J., et al. (2018) · New England Journal of Medicine · doi:10.1056/nejmc1806491 · Cited by 1,008
RetractedFukuhara, A., Matsuda, M., Nishizawa, M., Segawa, K., Tanaka, M., Kishimoto, K., Matsuki, Y., Murakami, M., Ichisaka, T., Murakami, H., et al. (2007) · Science · doi:10.1126/science.318.5850.565b · Cited by 150
RetractedMatthews, D. R., Hosker, J. P., Rudenski, A. S., Naylor, B. A., Treacher, D. F., & Turner, R. C. (1985) · Diabetologia · doi:10.1007/bf00280883 · Cited by 31,502
Toprak, Ö., Kurt, H., Sarı, Y., Şarkış, C., Us, H., & Kırık, A. (2017) · Kidney & Blood Pressure Research · doi:10.1159/000468530 · Cited by 29,772
Two new Later Stone Age sites from the Final Pleistocene in the Falémé Valley, eastern Senegal
Ndiaye, M., Lespez, L., Tribolo, C., Rassé, M., Hadjas, I., Davidoux, S., Huysecom, É., & Douze, K. (2024) · Monash University Research Portal (Monash University) · doi:10.3929/ethz-b-000667478 · Cited by 24,214
Alberti, K. G. M. M., Eckel, R. H., Grundy, S. M., Zimmet, P. Z., Cleeman, J. I., Donato, K. A., Fruchart, J.-C., James, W. P. T., Loria, C. M., & Smith, S. C. (2009) · Circulation · doi:10.1161/circulationaha.109.192644 · Cited by 14,860
Role of Insulin Resistance in Human Disease
Reaven, G. M. (1988) · Diabetes · doi:10.2337/diab.37.12.1595 · Cited by 12,154
Tuomilehto, J., Lindström, J., Eriksson, J. G., Valle, T. T., Hämäläinen, H., Ilanne-Parikka, P., Keinänen-Kiukaanniemi, S., Laakso, M., Louheranta, A., Rastas, M., et al. (2001) · New England Journal of Medicine · doi:10.1056/nejm200105033441801 · Cited by 10,873
Research works printed but not linked: 3
- [2]Hill JO Pagliassotti MJ Peters JC Bouchard C Nongenetic determinants of obesity and fat topography. Genetic determinants of obesity 1994 Boca Raton, FL CRC Press 35 48
- [198]Stern MP LeRoith D Taylor SI Olefsky JM Impaired glucose tolerance: Risk factor or diagnostic category. Diabetes Mellitus. A Fundamental and Clinical Text 1996 Philadelphia Lippincott-Raven Publishers 467 474
- [285]Hotamisligil GS Inflammation, TNF-alpha and insulin resistance 2003 Philadelphia, PA, United States Lippincott-Raven Publishers
Cited by
Sorted by citations
Metabolic Flexibility as an Adaptation to Energy Resources and Requirements in Health and Disease
Smith, R. L., Soeters, M. R., Wüst, R. C. I., & Houtkooper, R. H. (2018) · Endocrine Reviews · doi:10.1210/er.2017-00211 · Cited by 787
Developmental origins of metabolic diseases
Hoffman, D. J., Powell, T. L., Barrett, E. S., & Hardy, D. B. (2020) · Physiological Reviews · doi:10.1152/physrev.00002.2020 · Cited by 504
Barrea, L., Marzullo, P., Muscogiuri, G., Di Somma, C., Scacchi, M., Orio, F., Aimaretti, G., Colao, A., & Savastano, S. (2018) · Nutrition Research Reviews · doi:10.1017/s0954422418000136 · Cited by 171
Nutrition, inflammation and liver-spleen axis
Barrea, L., Somma, C. D., Muscogiuri, G., Tarantino, G., Tenore, G. C., Orio, F., Colao, A., & Savastano, S. (2017) · Critical Reviews in Food Science and Nutrition · doi:10.1080/10408398.2017.1353479 · Cited by 317
Zhao, R., Bu, W., Chen, Y., & Chen, X. (2019) · The journal of nutrition health & aging · doi:10.1007/s12603-019-1298-3 · Cited by 111
Metadata
- Authors
- Paniagua, J. A.
- Affiliations
- Instituto Maimónides de Investigación Biomédica de Córdoba (ES)
- Corresponding author
- Paniagua, Juan Antonio
- Venue
- World Journal of Diabetes
- Publisher
- Baishideng Publishing Group Inc.
- Published
- 2016
- Volume
- 7
- Issue
- 19
- Pages
- 483
- ISSN
- 1948-9358 (ISSN-L)
- PMC
- PMC5107710
- OpenAlex
- W2555771689
- Cited by
- 197
- References
- 307
- Citations by year
- 2026: 7 · 2025: 24 · 2024: 17 · 2023: 13 · 2022: 31 · 2021: 15 · 2020: 24 · 2019: 23 · 2018: 25 · 2017: 18
- FWCI
- 2.98
- Type
- journal article
- Language
- en
- Open access
- diamond
- doi.org
- Locations
- World Journal of Diabetes (publishedVersion)
- Europe PMC (PubMed Central) (publishedVersion, cc-by-nc)
- PubMed Central (publishedVersion, cc-by-nc)
- PubMed (publishedVersion)
- Topics
- Health Sciences › Medicine › Endocrinology, Diabetes and Metabolism › Adipokines, Inflammation, and Metabolic Diseases
- Health Sciences › Medicine › Endocrinology, Diabetes and Metabolism › Diet, Metabolism, and Disease
- Health Sciences › Medicine › Endocrinology, Diabetes and Metabolism › Diabetes, Cardiovascular Risks, and Lipoproteins
- Keywords
- metabolic syndrome, obesity, insulin resistance, abdominal obesity, abdominal fat, adipose tissue inflammation, adiponectin, leptin, hypertriglyceridemia, low HDL cholesterol, hepatic steatosis, high-carbohydrate diet, monounsaturated fatty acids, omega-3 fatty acids, omega-6 fatty acids, triglyceride-rich lipoproteins, reverse cholesterol transport, energy balance
About these checks
Registry, retraction, Cites and statistics results are computed, not judged, with one exception: a printed reference that no index lists is read once by a model before it counts as a citation error. Claims are extracted by a model and kept only when their quote appears verbatim in the text; each cited source is then checked, with a model’s help, for whether it says what the claim relies on. Those verdicts can be wrong — read the claim’s quote and the cited source before relying on one.
A language model drew the claims from the paper on 2026-10-09, under version 3 of the claim definition (model deepseek-v4.1-flash, prompt extract-v3).
A second model labelled each claim on 2026-10-09 (model jev-1.13-20260917, definition revision gold-guideline-v0.2).
Statistics and arithmetic are recomputed, not judged.
Confidence bands are shown only for fields calibrated on our annotated test set. None is calibrated yet, so no band is shown.
What counts as a claim ›How we measure confidence ›How we check this ›
Are you an author, or do you see a problem with this page? Request a review
