

The DOI matches its DataCite record; 26 of the 26 references it cites were found in a registry or an index; 2 of the 15 sources its claims cite were checked for support.
Understanding Usage and Engagement in AI-Powered Scientific Research Tools: The Asta Interaction Dataset
Open accessAbstract
AI-powered scientific research tools are rapidly being integrated into research workflows, yet the field lacks a clear lens into how researchers use these systems in real-world settings. We present and analyze the Asta Interaction Dataset, a large-scale resource comprising over 200,000 user queries and interaction logs from two deployed tools (a literature discovery interface and a scientific question-answering interface) within an LLM-powered retrieval-augmented generation platform. Using this dataset, we characterize query patterns, engagement behaviors, and how usage evolves with experience. We find that users submit longer and more complex queries than in traditional search, and treat the system as a collaborative research partner, delegating tasks such as drafting content and identifying research gaps. Users treat generated responses as persistent artifacts, revisiting and navigating among outputs and cited evidence in non-linear ways. With experience, users issue more targeted queries and engage more deeply with supporting citations, although keyword-style queries persist even among experienced users. We release the anonymized dataset and analysis with a new query intent taxonomy to inform future designs of real-world AI research assistants and to support realistic evaluation.
Overview
AI snapshot
Written from the paper’s full text.
TL;DR
The paper releases and analyzes the Asta Interaction Dataset, over 200,000 anonymized queries and interaction logs from two deployed LLM-powered scientific research tools: Paper Finder (PF) and ScholarQA (SQA). It finds that users query these systems more like collaborative research partners than traditional search engines, treating generated reports as persistent artifacts and adapting their behavior with experience.
Key findings
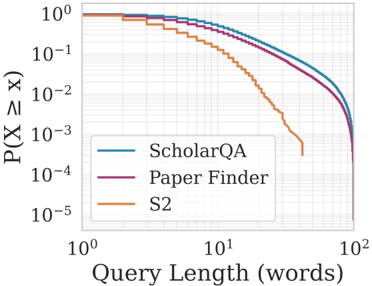
- Users submit longer, more complex queries than traditional search: PF and SQA queries have more constraints, entities, and relations than Semantic Scholar (S2); S2 queries from 2022 to 2025 rose from 7% to 10% with at least one constraint, 65% to 78% with at least one relation, and average length from 4.8 to over 6 words.
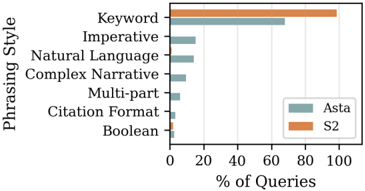
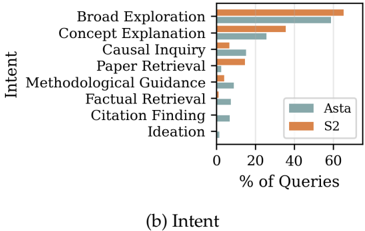
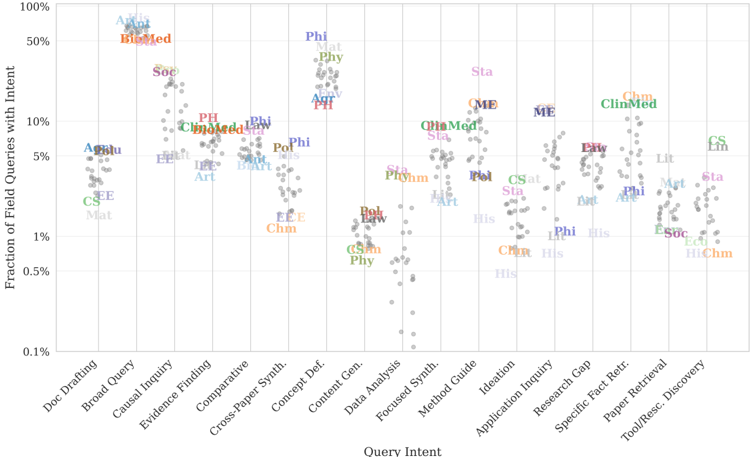
- Query behavior spans beyond retrieval: Broad Topic Exploration and Keyword-style queries dominate, but users also request methodological guidance, research gaps, data interpretation, and content generation; 98% of S2 queries are keyword-style, while Asta users issue more natural language queries.
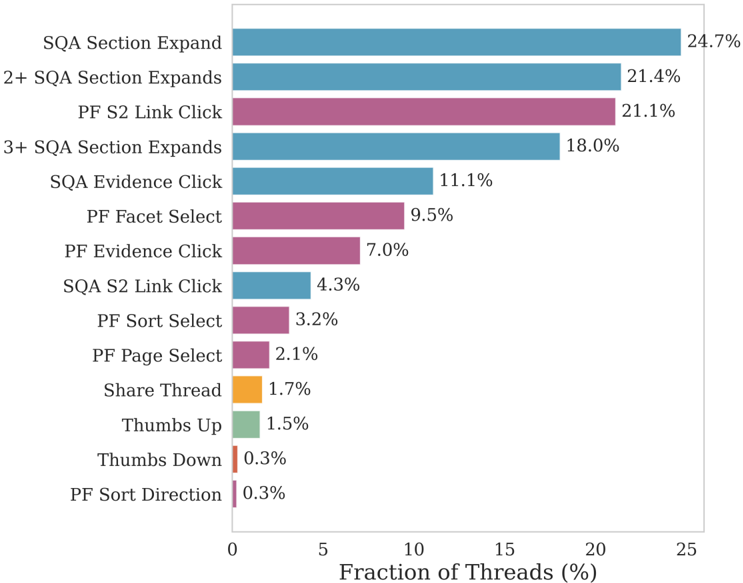
- Engagement is non-linear and artifact-like: 50.5% of SQA users and 42.1% of PF users revisit previous reports, versus 18.8% and 14.8% submitting near-duplicate queries; SQA users skip the introduction 43% of the time, and 52.4% of reports involve non-consecutive section expansions.
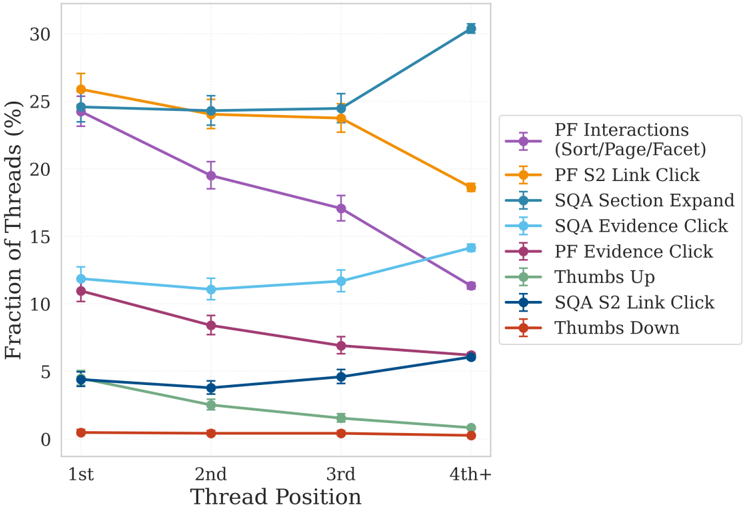
- Experience changes behavior: Broad Topic Exploration drops from 61.2% in the single-query stage to 53.5% in the experienced stage; SQA evidence clicks increase 27% from first query to fourth, while PF link clicks drop 24% over the same period.
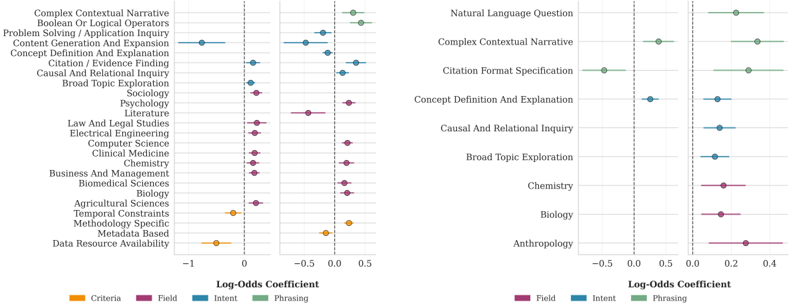
- Success varies by query type: PF has higher click odds for Citation/Evidence Finding (OR = 1.17) and Broad Topic Exploration (OR = 1.12), but lower odds for Content Generation and Expansion (OR = 0.47), Data Resource Availability (OR = 0.61), and Temporal Constraints (OR = 0.82); SQA has higher odds for Complex Contextual Narrative (OR = 1.47) and Concept Definition and Explanation (OR = 1.29), but lower odds for Citation Format Specification (OR = 0.62).
- Latency and errors matter: SQA churn remains near 11% for response times under 5 minutes, while PF churn increases by 10% relative if responses exceed 1 minute; first-time users who encounter an error have only a 10% chance of returning, compared to 53% after an initial successful experience.
Methods
- The dataset comprises over 200,000 user queries and interaction logs from two deployed tools within Asta: PF, a literature discovery interface, and SQA, a scientific question-answering interface; it is released as six anonymized parquet files joinable on `thread_id`.
- The authors introduce a query taxonomy with 16 intents, 7 phrasing styles, 6 criteria types, and 28 fields of study, built through iterative human-and-LLM review; they label a random subset of 30,000 queries using GPT-4.1 with structured decoding.
- Analyses include frequentist hypothesis testing at α = 0.05, Wilson confidence intervals, and separate binomial logistic regression models predicting click-through rate (CTR) for PF and SQA (n = 30,000 each), with user history controls and Benjamini-Hochberg correction.
Limitations
- The paper states that findings study one representative system, Asta, and may not generalize to tools with substantially different retrieval scope, interaction modality, or optimization objectives; it also notes differential query success across query types may bias behavioral findings.
- The paper states PF analysis is limited to the first query in each conversation because SQA and S2 did not support chat-style follow-up queries during data collection, which may skew the query distribution; follow-up queries are left to future work.
- The paper states explicit thumbs feedback is sparse (fewer than 2% of reports) and less predictive of return than link clicks, so CTR is used as a success surrogate; LLM-assessed quality is only one factor affecting user behavior.
- Evident from the text: the study is observational log analysis, so it cannot establish causal effects; the dataset covers a stable deployment period and anonymized logs, and LLM-based labeling may introduce classification errors.
Model-written summary. Check it against the paper before relying on it.
Integrity signals
Registry
Cites
Statistics
Figures
Verification
Claims the paper makes
69 Own result · 24 Own interpretation · 17 No basis given · 12 Own method · 3 Not checked yet · 1 Partly supported · 1 Sources not found · 1 Check pending · 1 No full text of the sources · accuracy not yet measured
A result the paper reports from its own data — it cites no other source for it, so there is none to check. The quote shows it is in the paper.
In the paper
“Fewer than half of all queries specify some explicit search criteria constraint (see Table 7 for the full list of rates), the most common being criteria regarding paper methodology (see Table 3).”
§ Understanding Usage and Engagement in AI-Powered Scientific Research Tools: The Asta Interaction Dataset > Query intent and phrasing distribution.
plain- Asserted: passes — The authors put it forward as true.
- Checkable: passes — It can be checked against evidence.
- Load-bearing: unclear — It is unclear whether the paper’s conclusions depend on it.
- Based: passes — The paper gives a reason why it holds.
A result the paper reports from its own data — it cites no other source for it, so there is none to check. The quote shows it is in the paper.
In the paper
“Natural Language Questions account for a large portion of queries, indicating that users expect the system to parse full sentences and act on directives.”
§ Understanding Usage and Engagement in AI-Powered Scientific Research Tools: The Asta Interaction Dataset > Phrasing styles.
plain- Asserted: passes — The authors put it forward as true.
- Checkable: passes — It can be checked against evidence.
- Load-bearing: unclear — It is unclear whether the paper’s conclusions depend on it.
- Based: passes — The paper gives a reason why it holds.
A result the paper reports from its own data — it cites no other source for it, so there is none to check. The quote shows it is in the paper.
In the paper
“Users treat generated responses as persistent artifacts, revisiting and navigating among outputs and cited evidence in non-linear ways.”
- Also stated in: § Learning effects. · hedged
“Report revisitation is common: 50.5% of SQA users and 42.1% of PF users revisit previous reports, substantially more than nearduplicate query submission (18.8% and 14.8%, respectively).”
§ Understanding Usage and Engagement in AI-Powered Scientific Research Tools: The Asta Interaction Dataset > Abstract
plain- Asserted: passes — The authors put it forward as true.
- Checkable: passes — It can be checked against evidence.
- Load-bearing: passes — The paper’s conclusions depend on it.
- Based: passes — The paper gives a reason why it holds.
- Also stated in: § Learning effects. · hedged
The paper states this without a source or data behind it here, so there is nothing to check it against. The quote shows it is in the paper.
In the paper
“We similarly develop and apply a taxonomy of user intents, but focus on scientific research tasks and LLM-based assistants.”
§ Understanding Usage and Engagement in AI-Powered Scientific Research Tools: The Asta Interaction Dataset > 4.2 RQ2: How do users engage with the presented content?
plain- Asserted: passes — The authors put it forward as true.
- Checkable: passes — It can be checked against evidence.
- Load-bearing: passes — The paper’s conclusions depend on it.
- Based: passes — The paper gives a reason why it holds.
A result the paper reports from its own data — it cites no other source for it, so there is none to check. The quote shows it is in the paper.
In the paper
“Yet despite these expectations, keyword-style queries and broad topic exploration dominate, a pattern that persists even among experienced users (Section 4.1), suggesting functional fixedness.”
§ Understanding Usage and Engagement in AI-Powered Scientific Research Tools: The Asta Interaction Dataset > User expectations.
plain- Asserted: passes — The authors put it forward as true.
- Checkable: passes — It can be checked against evidence.
- Load-bearing: passes — The paper’s conclusions depend on it.
- Based: passes — The paper gives a reason why it holds.
A result the paper reports from its own data — it cites no other source for it, so there is none to check. The quote shows it is in the paper.
In the paper
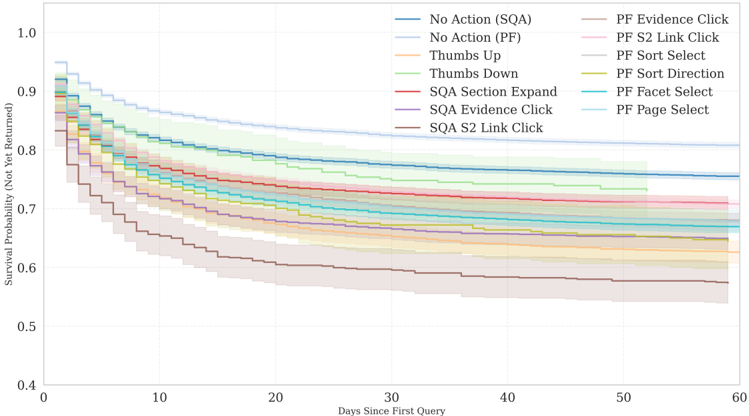
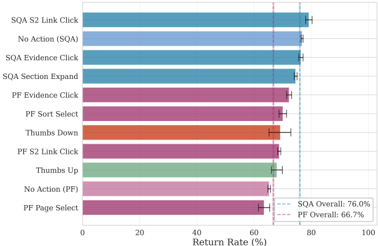
“Following prior work establishing implicit behaviors as reliable satisfaction indicators (Joachims et al., 2005;Fox et al., 2005;Kim et al., 2014), we use click-through rate (CTR) as our primary success surrogate, as S2 link clicks strongly predict user returns (Appendix D).”
§ Understanding Usage and Engagement in AI-Powered Scientific Research Tools: The Asta Interaction Dataset > User actions and success metrics.
boostedcorrelational- Asserted: passes — The authors put it forward as true.
- Checkable: passes — It can be checked against evidence.
- Load-bearing: passes — The paper’s conclusions depend on it.
- Based: passes — The paper gives a reason why it holds.
A result the paper reports from its own data — it cites no other source for it, so there is none to check. The quote shows it is in the paper.
In the paper
“Beyond typical queries, users employ diverse strategies (template-filling, explicit prompting, collaborative writing workflows, and refinding queries) that reveal expectations shaped by general-purpose LLMs (see Table 10 in the appendix for examples).”
§ Understanding Usage and Engagement in AI-Powered Scientific Research Tools: The Asta Interaction Dataset > User expectations.
plain- Asserted: passes — The authors put it forward as true.
- Checkable: passes — It can be checked against evidence.
- Load-bearing: passes — The paper’s conclusions depend on it.
- Based: passes — The paper gives a reason why it holds.
A result the paper reports from its own data — it cites no other source for it, so there is none to check. The quote shows it is in the paper.
In the paper
“With experience, users issue more targeted queries and engage more deeply with supporting citations, although keyword-style queries persist even among experienced users.”
- Also stated in: § User expectations. · plain
“Yet despite these expectations, keyword-style queries and broad topic exploration dominate, a pattern that persists even among experienced users (Section 4.1), suggesting functional fixedness.”
§ Understanding Usage and Engagement in AI-Powered Scientific Research Tools: The Asta Interaction Dataset > Abstract
plain- Asserted: passes — The authors put it forward as true.
- Checkable: passes — It can be checked against evidence.
- Load-bearing: passes — The paper’s conclusions depend on it.
- Based: passes — The paper gives a reason why it holds.
- Also stated in: § User expectations. · plain
A result the paper reports from its own data — it cites no other source for it, so there is none to check. The quote shows it is in the paper.
In the paper
“While Keyword-style queries remain the most common phrasing on both tools (Figure 3a), a substantial share of queries adopt styles that would be ineffective on traditional search engines.”
§ Understanding Usage and Engagement in AI-Powered Scientific Research Tools: The Asta Interaction Dataset > Phrasing styles.
plain- Asserted: passes — The authors put it forward as true.
- Checkable: passes — It can be checked against evidence.
- Load-bearing: unclear — It is unclear whether the paper’s conclusions depend on it.
- Based: passes — The paper gives a reason why it holds.
None of the sources cited for this claim have been checked yet.
In the paper
“We present and analyze the Asta Interaction Dataset, a large-scale resource comprising over 200,000 user queries and interaction logs from two deployed tools (a literature discovery interface and a scientific question-answering interface) within an LLM-powered retrieval-augmented generation platform.”
§ Understanding Usage and Engagement in AI-Powered Scientific Research Tools: The Asta Interaction Dataset > Abstract
What the sources say
- Not checked yetcites Singh et al., 2025
Checked before — its earlier verdict is held back until a new check runs.
- Not matchedcites Allen Institute for Artificial Intelligence, 2025
Couldn’t be matched to a paper in Crossref, so it can’t be checked.
plain- Asserted: passes — The authors put it forward as true.
- Checkable: passes — It can be checked against evidence.
- Load-bearing: passes — The paper’s conclusions depend on it.
- Based: passes — The paper gives a reason why it holds.
- Not checked yet
- It may state two separate claims as one. 44
- Probably not a substantial claim. 21
The cited sources support only part of this claim — read each source’s verdict below.
In the paper
“Together, these studies show that LLM-based systems elicit rich behaviors that are strongly mediated by users' mental models and prior tool use, but they primarily investigate general-purpose search or everyday LLM services rather than domain-specific scientific research tools.”
§ Understanding Usage and Engagement in AI-Powered Scientific Research Tools: The Asta Interaction Dataset > 4.2 RQ2: How do users engage with the presented content?
What the sources say
- Supportedcites Liu et al., 2025 source
Split into 2 atoms — 2 confirmed, 0 partially supported, 0 disputed, 0 misattributed, 0 unverifiable. Expand the claim to see per-atom verdicts.
- Partly supportedcites Shah et al., 2025 sourceExperimental — accuracy not yet measured
Split into 2 atoms — 1 confirmed, 1 partially supported, 0 disputed, 0 misattributed, 0 unverifiable. Expand the claim to see per-atom verdicts.
- Not matchedcites Wang et al., 2024
Couldn’t be matched to a paper in Crossref, so it can’t be checked.
boostedcorrelational- Asserted: passes — The authors put it forward as true.
- Checkable: passes — It can be checked against evidence.
- Load-bearing: passes — The paper’s conclusions depend on it.
- Based: passes — The paper gives a reason why it holds.
It may state two separate claims as one.
- Supported
A result the paper reports from its own data — it cites no other source for it, so there is none to check. The quote shows it is in the paper.
In the paper
“while experienced PF users increasingly consume information directly from the result list without clicking through to papers (link clicks drop by 24% over the same period), as the interface provides sufficient context.”
§ Understanding Usage and Engagement in AI-Powered Scientific Research Tools: The Asta Interaction Dataset > 4.2 RQ2: How do users engage with the presented content?
plaindirect- Asserted: passes — The authors put it forward as true.
- Checkable: passes — It can be checked against evidence.
- Load-bearing: passes — The paper’s conclusions depend on it.
- Based: passes — The paper gives a reason why it holds.
It may state two separate claims as one.
A result the paper reports from its own data — it cites no other source for it, so there is none to check. The quote shows it is in the paper.
In the paper
“Publication Quality filters (11% on Asta vs. 3% on S2) and Temporal Constraints (5% vs. 2%) are also more prevalent on Asta.”
§ Understanding Usage and Engagement in AI-Powered Scientific Research Tools: The Asta Interaction Dataset > Phrasing styles.
plaincorrelational- Asserted: passes — The authors put it forward as true.
- Checkable: passes — It can be checked against evidence.
- Load-bearing: unclear — It is unclear whether the paper’s conclusions depend on it.
- Based: passes — The paper gives a reason why it holds.
It may state two separate claims as one.
A result the paper reports from its own data — it cites no other source for it, so there is none to check. The quote shows it is in the paper.
In the paper
“We identify 16 query intents (e.g., Broad Topic Exploration, Causal and Relational Inquiry; Table 1), 7 phrasing styles (e.g., Keyword-style Query, Natural Language Question; Table 2), 6 criteria types (e.g., Temporal Constraints, Methodology-Specific Criteria; Table 3), and 28 fields of study (e.g., Biology, Electrical Engineering, Law and Legal Studies; see Table 31 for the full list).”
§ Understanding Usage and Engagement in AI-Powered Scientific Research Tools: The Asta Interaction Dataset > Query taxonomy.
plain- Asserted: passes — The authors put it forward as true.
- Checkable: passes — It can be checked against evidence.
- Load-bearing: unclear — It is unclear whether the paper’s conclusions depend on it.
- Based: passes — The paper gives a reason why it holds.
It may state two separate claims as one.
A result the paper reports from its own data — it cites no other source for it, so there is none to check. The quote shows it is in the paper.
In the paper
“Comparing S2 queries between 2022 and 2025, we find that the fraction of queries with at least 1 constraint rose from 7 % to 10 %, queries with at least 1 relation grew from 65 % to 78 %, and average query length increased from 4.8 to over 6 words.”
§ Understanding Usage and Engagement in AI-Powered Scientific Research Tools: The Asta Interaction Dataset > Temporal changes in query behavior.
plaincorrelational- Asserted: passes — The authors put it forward as true.
- Checkable: passes — It can be checked against evidence.
- Load-bearing: passes — The paper’s conclusions depend on it.
- Based: passes — The paper gives a reason why it holds.
It may state two separate claims as one.
A result the paper reports from its own data — it cites no other source for it, so there is none to check. The quote shows it is in the paper.
In the paper
“As shown in Table 5, Broad Topic Exploration drops from 61.2% in the single-querystage to 53.5% in the experiencedstage, while other query intents become more common.”
§ Understanding Usage and Engagement in AI-Powered Scientific Research Tools: The Asta Interaction Dataset > Learning effects.
plaincorrelational- Asserted: passes — The authors put it forward as true.
- Checkable: passes — It can be checked against evidence.
- Load-bearing: passes — The paper’s conclusions depend on it.
- Based: passes — The paper gives a reason why it holds.
It may state two separate claims as one.
A result the paper reports from its own data — it cites no other source for it, so there is none to check. The quote shows it is in the paper.
In the paper
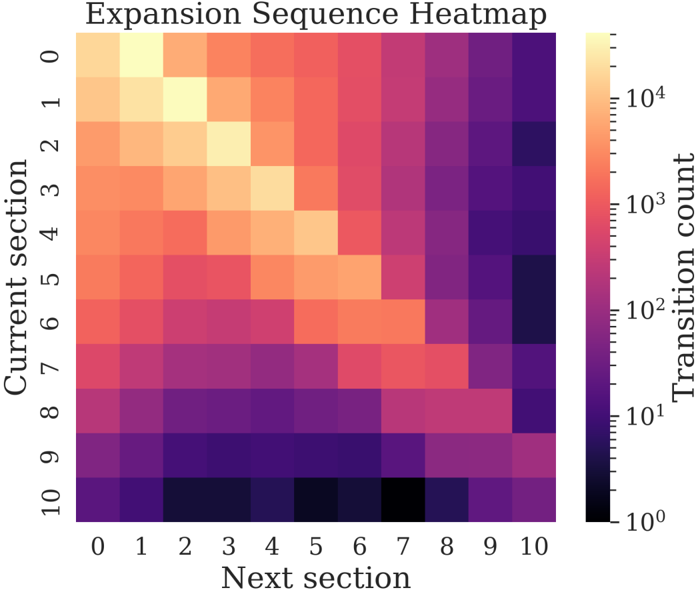
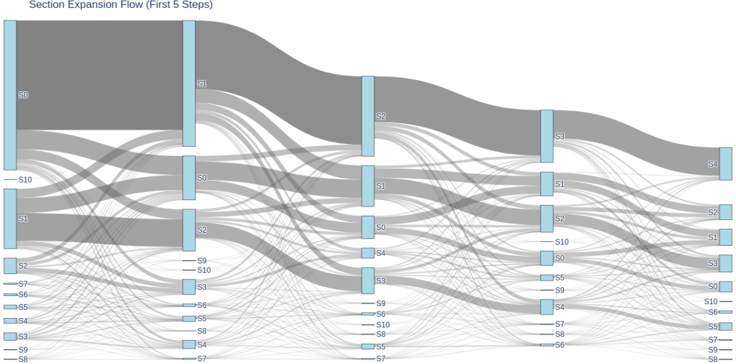
“While sequential reading dominates, users frequently skip sections, navigate backwards, and return to the introduction from later sections (see Appendix C for detailed transition analysis and Figure 7 for the Sankey diagram).”
§ Understanding Usage and Engagement in AI-Powered Scientific Research Tools: The Asta Interaction Dataset > 4.2 RQ2: How do users engage with the presented content?
plain- Asserted: passes — The authors put it forward as true.
- Checkable: passes — It can be checked against evidence.
- Load-bearing: unclear — It is unclear whether the paper’s conclusions depend on it.
- Based: passes — The paper gives a reason why it holds.
It may state two separate claims as one.
A result the paper reports from its own data — it cites no other source for it, so there is none to check. The quote shows it is in the paper.
In the paper
“Report revisitation is common: 50.5% of SQA users and 42.1% of PF users revisit previous reports, substantially more than nearduplicate query submission (18.8% and 14.8%, respectively).”
§ Understanding Usage and Engagement in AI-Powered Scientific Research Tools: The Asta Interaction Dataset > Learning effects.
plaincorrelational- Asserted: passes — The authors put it forward as true.
- Checkable: passes — It can be checked against evidence.
- Load-bearing: passes — The paper’s conclusions depend on it.
- Based: passes — The paper gives a reason why it holds.
It may state two separate claims as one.
A result the paper reports from its own data — it cites no other source for it, so there is none to check. The quote shows it is in the paper.
In the paper
“Users also increasingly use abstract concepts rather than specific jargon (e.g., “why some language models behave unpredictably when trained further” vs. “BERT fine-tuning instability”); 66% of PF queries include abstract concepts vs. 38% in S2 (Appendix B).”
§ Understanding Usage and Engagement in AI-Powered Scientific Research Tools: The Asta Interaction Dataset > User expectations.
plaincorrelational- Asserted: passes — The authors put it forward as true.
- Checkable: passes — It can be checked against evidence.
- Load-bearing: unclear — It is unclear whether the paper’s conclusions depend on it.
- Based: passes — The paper gives a reason why it holds.
It may state two separate claims as one.
A result the paper reports from its own data — it cites no other source for it, so there is none to check. The quote shows it is in the paper.
In the paper
“Rarer but notable are Citation/Impact-Based criteria (<1% on Asta) such as requests for highly cited papers or journals above a given impact factor, and Data/Resource Availability constraints where users seek studies with publicly available datasets or code.”
§ Understanding Usage and Engagement in AI-Powered Scientific Research Tools: The Asta Interaction Dataset > Phrasing styles.
plain- Asserted: passes — The authors put it forward as true.
- Checkable: passes — It can be checked against evidence.
- Load-bearing: unclear — It is unclear whether the paper’s conclusions depend on it.
- Based: passes — The paper gives a reason why it holds.
It may state two separate claims as one.
A result the paper reports from its own data — it cites no other source for it, so there is none to check. The quote shows it is in the paper.
In the paper
“Users tolerate this difference: SQA churn remains stable (close to 11 %) for response times under 5 minutes, whereas PF churn increases by 10 % relative if responses exceed 1 minute, suggesting that users expect PF to behave like traditional search but accept longer waits for SQA's synthesized reports.”
§ Understanding Usage and Engagement in AI-Powered Scientific Research Tools: The Asta Interaction Dataset > 4.2 RQ2: How do users engage with the presented content?
hedgeddirect- Asserted: passes — The authors put it forward as true.
- Checkable: passes — It can be checked against evidence.
- Load-bearing: passes — The paper’s conclusions depend on it.
- Based: passes — The paper gives a reason why it holds.
It may state two separate claims as one.
A result the paper reports from its own data — it cites no other source for it, so there is none to check. The quote shows it is in the paper.
In the paper
“About 40% of users initiate at least 2 queries (the second queries usually coming within a few hours of the first) while less than 10% of users initiate 10 or more queries.”
§ Understanding Usage and Engagement in AI-Powered Scientific Research Tools: The Asta Interaction Dataset > User experience stages.
plain- Asserted: passes — The authors put it forward as true.
- Checkable: passes — It can be checked against evidence.
- Load-bearing: unclear — It is unclear whether the paper’s conclusions depend on it.
- Based: passes — The paper gives a reason why it holds.
It may state two separate claims as one.
A result the paper reports from its own data — it cites no other source for it, so there is none to check. The quote shows it is in the paper.
In the paper
“In contrast, catastrophic errors severely impact retention: first-time users who encounter an error have only a 10 % chance of returning, compared to 53 % for users with an initial successful experience.”
§ Understanding Usage and Engagement in AI-Powered Scientific Research Tools: The Asta Interaction Dataset > 4.2 RQ2: How do users engage with the presented content?
plaindirect- Asserted: passes — The authors put it forward as true.
- Checkable: passes — It can be checked against evidence.
- Load-bearing: passes — The paper’s conclusions depend on it.
- Based: passes — The paper gives a reason why it holds.
It may state two separate claims as one.
A result the paper reports from its own data — it cites no other source for it, so there is none to check. The quote shows it is in the paper.
In the paper
“For PF, Citation/Evidence Finding (OR = 1.17) and Broad Topic Exploration (OR = 1.12) queries have higher click odds, while Content Generation and Expansion (OR = 0.47), Data Resource Availability (OR = 0.61), and Temporal Constraint (OR = 0.82) queries have substantially lower click-through odds.”
§ Understanding Usage and Engagement in AI-Powered Scientific Research Tools: The Asta Interaction Dataset > Limitations and generalizability.
plaincorrelational- Asserted: passes — The authors put it forward as true.
- Checkable: passes — It can be checked against evidence.
- Load-bearing: passes — The paper’s conclusions depend on it.
- Based: passes — The paper gives a reason why it holds.
It may state two separate claims as one.
A result the paper reports from its own data — it cites no other source for it, so there is none to check. The quote shows it is in the paper.
In the paper
“Explicit thumbs feedback is too sparse (fewer than 2% of reports) and less predictive of return than link clicks.”
§ Understanding Usage and Engagement in AI-Powered Scientific Research Tools: The Asta Interaction Dataset > User actions and success metrics.
plaincorrelational- Asserted: passes — The authors put it forward as true.
- Checkable: passes — It can be checked against evidence.
- Load-bearing: passes — The paper’s conclusions depend on it.
- Based: passes — The paper gives a reason why it holds.
It may state two separate claims as one.
A result the paper reports from its own data — it cites no other source for it, so there is none to check. The quote shows it is in the paper.
In the paper
“Users typically initiate 1-2 queries per session with a median session duration of 4 minutes for PF and 8 minutes for SQA.”
§ Understanding Usage and Engagement in AI-Powered Scientific Research Tools: The Asta Interaction Dataset > Session duration and usage patterns.
plain- Asserted: passes — The authors put it forward as true.
- Checkable: passes — It can be checked against evidence.
- Load-bearing: unclear — It is unclear whether the paper’s conclusions depend on it.
- Based: passes — The paper gives a reason why it holds.
It may state two separate claims as one.
A result the paper reports from its own data — it cites no other source for it, so there is none to check. The quote shows it is in the paper.
In the paper
“For SQA, Concept Definition and Explanation (OR = 1.29) and Complex Contextual Narrative (OR = 1.47) queries have higher click odds, while Citation Format Specification (OR = 0.62) queries have lower click odds.”
§ Understanding Usage and Engagement in AI-Powered Scientific Research Tools: The Asta Interaction Dataset > Limitations and generalizability.
plaincorrelational- Asserted: passes — The authors put it forward as true.
- Checkable: passes — It can be checked against evidence.
- Load-bearing: unclear — It is unclear whether the paper’s conclusions depend on it.
- Based: passes — The paper gives a reason why it holds.
It may state two separate claims as one.
A result the paper reports from its own data — it cites no other source for it, so there is none to check. The quote shows it is in the paper.
In the paper
“Near-duplicate queries occur on shorter timescales (median <16 minutes) than revisits (median 4-6 hours), with most showing slight refinements such as format instructions or language preferences (see Tables 11 and 12 in the appendix).”
§ Understanding Usage and Engagement in AI-Powered Scientific Research Tools: The Asta Interaction Dataset > Learning effects.
plaincorrelational- Asserted: passes — The authors put it forward as true.
- Checkable: passes — It can be checked against evidence.
- Load-bearing: unclear — It is unclear whether the paper’s conclusions depend on it.
- Based: passes — The paper gives a reason why it holds.
It may state two separate claims as one.
A result the paper reports from its own data — it cites no other source for it, so there is none to check. The quote shows it is in the paper.
In the paper
“Across both tools, usage is dominated by repeat users: twice as many of our users have initiated multiple queries as have initiated only a single query, and more than half of those repeat users have initiated more than 15 queries.”
§ Understanding Usage and Engagement in AI-Powered Scientific Research Tools: The Asta Interaction Dataset > Session duration and usage patterns.
plain- Asserted: passes — The authors put it forward as true.
- Checkable: passes — It can be checked against evidence.
- Load-bearing: unclear — It is unclear whether the paper’s conclusions depend on it.
- Based: passes — The paper gives a reason why it holds.
It may state two separate claims as one.
A result the paper reports from its own data — it cites no other source for it, so there is none to check. The quote shows it is in the paper.
In the paper
“The median number of sessions per user and the median number of queries per user is 2 for both PF and SQA.”
§ Understanding Usage and Engagement in AI-Powered Scientific Research Tools: The Asta Interaction Dataset > Session duration and usage patterns.
plain- Asserted: passes — The authors put it forward as true.
- Checkable: passes — It can be checked against evidence.
- Load-bearing: unclear — It is unclear whether the paper’s conclusions depend on it.
- Based: passes — The paper gives a reason why it holds.
It may state two separate claims as one.
The paper states this without a source or data behind it here, so there is nothing to check it against. The quote shows it is in the paper.
In the paper
“Therefore, we introduce a new taxonomy with non-mutually exclusive labels for query intent, phrasing style, and criteria.”
- Also stated in: § Query taxonomy. · plain
“This yields three query aspects (intent, phrasing style, and criteria) with non-mutually exclusive labels.”
§ Understanding Usage and Engagement in AI-Powered Scientific Research Tools: The Asta Interaction Dataset > Query taxonomy.
plain- Asserted: passes — The authors put it forward as true.
- Checkable: passes — It can be checked against evidence.
- Load-bearing: passes — The paper’s conclusions depend on it.
- Based: passes — The paper gives a reason why it holds.
Probably not a substantial claim.
- Also stated in: § Query taxonomy. · plain
A result the paper reports from its own data — it cites no other source for it, so there is none to check. The quote shows it is in the paper.
In the paper
“Analysis reveals diverse, non-linear reading behaviors: users skip the introduction 43% of the time, and over half of reports (52.4%)involve non-consecutive section expansions.”
§ Understanding Usage and Engagement in AI-Powered Scientific Research Tools: The Asta Interaction Dataset > 4.2 RQ2: How do users engage with the presented content?
plain- Asserted: passes — The authors put it forward as true.
- Checkable: passes — It can be checked against evidence.
- Load-bearing: passes — The paper’s conclusions depend on it.
- Based: passes — The paper gives a reason why it holds.
It may state two separate claims as one.
The paper states this without a source or data behind it here, so there is nothing to check it against. The quote shows it is in the paper.
In the paper
“Multi-part queries or Complex Contextual Narrative queries often include long passages copy-pasted from drafts followed by a question, taking advantage of LLMs' capability of handling long texts.”
§ Understanding Usage and Engagement in AI-Powered Scientific Research Tools: The Asta Interaction Dataset > User expectations.
plaincorrelational- Asserted: passes — The authors put it forward as true.
- Checkable: passes — It can be checked against evidence.
- Load-bearing: fails — The paper’s conclusions may not depend on it.
- Based: fails — The paper may give no reason why it holds.
Probably not a substantial claim. The paper’s conclusions may not depend on it. The paper may give no reason why it holds.
The paper states this without a source or data behind it here, so there is nothing to check it against. The quote shows it is in the paper.
In the paper
“PF typically returns results within 30 seconds while SQA takes around 2 minutes to generate full reports.”
§ Understanding Usage and Engagement in AI-Powered Scientific Research Tools: The Asta Interaction Dataset > 4.2 RQ2: How do users engage with the presented content?
plain- Asserted: passes — The authors put it forward as true.
- Checkable: passes — It can be checked against evidence.
- Load-bearing: passes — The paper’s conclusions depend on it.
- Based: passes — The paper gives a reason why it holds.
It may state two separate claims as one.
A result the paper reports from its own data — it cites no other source for it, so there is none to check. The quote shows it is in the paper.
In the paper
“Users who perform thumbs up are likely to return, users who don't perform any action are the least likely to return.”
§ Understanding Usage and Engagement in AI-Powered Scientific Research Tools: The Asta Interaction Dataset > Appendix E Additional figures and tables E.1 Query characteristics and success metrics
hedgedcorrelational- Asserted: passes — The authors put it forward as true.
- Checkable: passes — It can be checked against evidence.
- Load-bearing: unclear — It is unclear whether the paper’s conclusions depend on it.
- Based: passes — The paper gives a reason why it holds.
It may state two separate claims as one.
The paper states this without a source or data behind it here, so there is nothing to check it against. The quote shows it is in the paper.
In the paper
“PF reports tend to receive less click engagement over time compared to SQA reports which grow in engagement”
§ Understanding Usage and Engagement in AI-Powered Scientific Research Tools: The Asta Interaction Dataset > Output Schema (Pydantic):
plaincorrelational- Asserted: passes — The authors put it forward as true.
- Checkable: passes — It can be checked against evidence.
- Load-bearing: unclear — It is unclear whether the paper’s conclusions depend on it.
- Based: passes — The paper gives a reason why it holds.
It may state two separate claims as one.
A result the paper reports from its own data — it cites no other source for it, so there is none to check. The quote shows it is in the paper.
In the paper
“On the flip side, PF performs well on queries it was designed for: Citation/Evidence Finding and Broad Topic Exploration queries both have higher click odds.”
§ Understanding Usage and Engagement in AI-Powered Scientific Research Tools: The Asta Interaction Dataset > Appendix E Additional figures and tables E.1 Query characteristics and success metrics
plaincorrelational- Asserted: passes — The authors put it forward as true.
- Checkable: passes — It can be checked against evidence.
- Load-bearing: passes — The paper’s conclusions depend on it.
- Based: passes — The paper gives a reason why it holds.
It may state two separate claims as one.
A result the paper reports from its own data — it cites no other source for it, so there is none to check. The quote shows it is in the paper.
In the paper
“Overall, users primarily move sequentially through the report with some skipping behavior and backwards navigation.”
§ Understanding Usage and Engagement in AI-Powered Scientific Research Tools: The Asta Interaction Dataset > A.3 Statistical Analysis
plain- Asserted: passes — The authors put it forward as true.
- Checkable: passes — It can be checked against evidence.
- Load-bearing: passes — The paper’s conclusions depend on it.
- Based: passes — The paper gives a reason why it holds.
It may state two separate claims as one.
A result the paper reports from its own data — it cites no other source for it, so there is none to check. The quote shows it is in the paper.
In the paper
“Complex Contextual Narrative queries also have high click odds, suggesting users achieve success with complex queries that would typically fail using traditional IR tools.”
§ Understanding Usage and Engagement in AI-Powered Scientific Research Tools: The Asta Interaction Dataset > Appendix E Additional figures and tables E.1 Query characteristics and success metrics
hedgedcorrelational- Asserted: passes — The authors put it forward as true.
- Checkable: passes — It can be checked against evidence.
- Load-bearing: unclear — It is unclear whether the paper’s conclusions depend on it.
- Based: passes — The paper gives a reason why it holds.
It may state two separate claims as one.
The paper states this without a source or data behind it here, so there is nothing to check it against. The quote shows it is in the paper.
In the paper
“The released dataset comprises six parquet files.”
§ Understanding Usage and Engagement in AI-Powered Scientific Research Tools: The Asta Interaction Dataset > Additional information
plain- Asserted: passes — The authors put it forward as true.
- Checkable: passes — It can be checked against evidence.
- Load-bearing: fails — The paper’s conclusions may not depend on it.
- Based: passes — The paper gives a reason why it holds.
Probably not a substantial claim. The paper’s conclusions may not depend on it.
The paper states this without a source or data behind it here, so there is nothing to check it against. The quote shows it is in the paper.
In the paper
“PF performs well on Citation & Evidence Finding and Broad Topic Exploration queries but struggles with queries having Temporal Constraints, Data/Resource requirements, or Content Generation requests.”
§ Understanding Usage and Engagement in AI-Powered Scientific Research Tools: The Asta Interaction Dataset > Methodology-Specific Criteria (query criteria)
plaincorrelational- Asserted: passes — The authors put it forward as true.
- Checkable: passes — It can be checked against evidence.
- Load-bearing: unclear — It is unclear whether the paper’s conclusions depend on it.
- Based: passes — The paper gives a reason why it holds.
It may state two separate claims as one.
A result the paper reports from its own data — it cites no other source for it, so there is none to check. The quote shows it is in the paper.
In the paper
“Reports assessed as high quality have an average CTR of 5.5 % compared to 3.8 % for reports assessed as low quality, a relative increase of 44 %.”
§ Understanding Usage and Engagement in AI-Powered Scientific Research Tools: The Asta Interaction Dataset > Additional information
plaincorrelational- Asserted: passes — The authors put it forward as true.
- Checkable: passes — It can be checked against evidence.
- Load-bearing: passes — The paper’s conclusions depend on it.
- Based: passes — The paper gives a reason why it holds.
It may state two separate claims as one.
The paper states this without a source or data behind it here, so there is nothing to check it against. The quote shows it is in the paper.
In the paper
“PF struggles with Content Generation and Expansion queries (which it is not designed for) and queries with Temporal Constraints or Data Resource requirements such as publicly available datasets (which may be unsatisfiable).”
§ Understanding Usage and Engagement in AI-Powered Scientific Research Tools: The Asta Interaction Dataset > Appendix E Additional figures and tables E.1 Query characteristics and success metrics
hedgeddirect- Asserted: passes — The authors put it forward as true.
- Checkable: passes — It can be checked against evidence.
- Load-bearing: passes — The paper’s conclusions depend on it.
- Based: passes — The paper gives a reason why it holds.
It may state two separate claims as one.
A result the paper reports from its own data — it cites no other source for it, so there is none to check. The quote shows it is in the paper.
In the paper
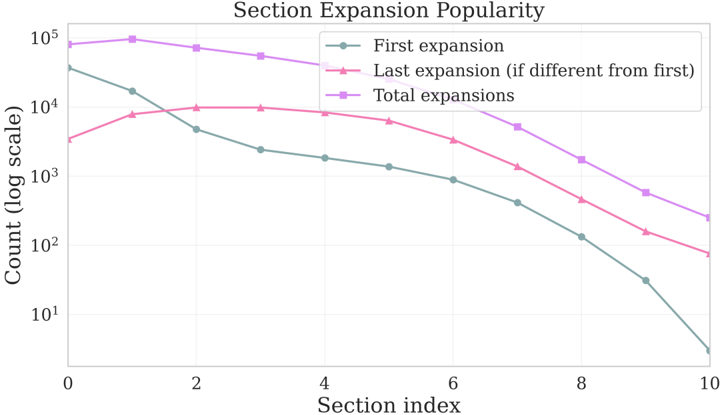
“Users often start from the first section (index 0), and the last section expanded in a report is typically between index 1 and 4.”
§ Understanding Usage and Engagement in AI-Powered Scientific Research Tools: The Asta Interaction Dataset > Additional information
plain- Asserted: passes — The authors put it forward as true.
- Checkable: passes — It can be checked against evidence.
- Load-bearing: unclear — It is unclear whether the paper’s conclusions depend on it.
- Based: passes — The paper gives a reason why it holds.
It may state two separate claims as one.
A result the paper reports from its own data — it cites no other source for it, so there is none to check. The quote shows it is in the paper.
In the paper
“The median number of abstract concepts per query is 0 in S2 and 1 in PF, reinforcing the same trend.”
§ Understanding Usage and Engagement in AI-Powered Scientific Research Tools: The Asta Interaction Dataset > Additional information
plain- Asserted: passes — The authors put it forward as true.
- Checkable: passes — It can be checked against evidence.
- Load-bearing: unclear — It is unclear whether the paper’s conclusions depend on it.
- Based: passes — The paper gives a reason why it holds.
It may state two separate claims as one.
The paper states this without a source or data behind it here, so there is nothing to check it against. The quote shows it is in the paper.
In the paper
“SQA shows an analogous pattern.Concept Definition and Explanation queries have higher click odds, as SQA was designed with them in mind.”
§ Understanding Usage and Engagement in AI-Powered Scientific Research Tools: The Asta Interaction Dataset > Appendix E Additional figures and tables E.1 Query characteristics and success metrics
plaindirect- Asserted: passes — The authors put it forward as true.
- Checkable: passes — It can be checked against evidence.
- Load-bearing: unclear — It is unclear whether the paper’s conclusions depend on it.
- Based: passes — The paper gives a reason why it holds.
It may state two separate claims as one.
A result the paper reports from its own data — it cites no other source for it, so there is none to check. The quote shows it is in the paper.
In the paper
“We found that 38% of S2 queries include at least one abstract concept, compared with 66% in PF.”
§ Understanding Usage and Engagement in AI-Powered Scientific Research Tools: The Asta Interaction Dataset > Additional information
plain- Asserted: passes — The authors put it forward as true.
- Checkable: passes — It can be checked against evidence.
- Load-bearing: passes — The paper’s conclusions depend on it.
- Based: passes — The paper gives a reason why it holds.
It may state two separate claims as one.
What the paper did — it cites no source for this, so there is none to check. The quote shows it is in the paper.
In the paper
“Our study explores many aspects of user behavior; we use frequentist hypothesis testing to identify statistically significant findings and focus on those with the large effect sizes.”
§ Understanding Usage and Engagement in AI-Powered Scientific Research Tools: The Asta Interaction Dataset > A.3 Statistical Analysis
plain- Asserted: passes — The authors put it forward as true.
- Checkable: passes — It can be checked against evidence.
- Load-bearing: passes — The paper’s conclusions depend on it.
- Based: passes — The paper gives a reason why it holds.
Probably not a substantial claim. It may state two separate claims as one.
A conclusion the paper draws from its own results — it cites no other source for it, so there is none to check. The quote shows it is in the paper.
In the paper
“While both tools follow standard design patterns for this class of system, our findings may not generalize to tools with substantially different retrieval scope, interaction modality, or optimization objectives.”
§ Understanding Usage and Engagement in AI-Powered Scientific Research Tools: The Asta Interaction Dataset > 7 Conclusions and Future Work
hedged- Asserted: passes — The authors put it forward as true.
- Checkable: passes — It can be checked against evidence.
- Load-bearing: fails — The paper’s conclusions may not depend on it.
- Based: passes — The paper gives a reason why it holds.
Probably not a substantial claim. The paper’s conclusions may not depend on it. It may state two separate claims as one.
In the paper
“The query intents that are relatively more common in S2 are also simpler and reflect the informational and navigational queries of Broder (2002) from traditional IR systems: broad queries and specific paper retrieval queries.”
§ Understanding Usage and Engagement in AI-Powered Scientific Research Tools: The Asta Interaction Dataset > Query intent and phrasing distribution.
What the sources say
- Not checked — no full text of the sourcecites Broder, 2002 source
plaincorrelational- Asserted: passes — The authors put it forward as true.
- Checkable: passes — It can be checked against evidence.
- Load-bearing: unclear — It is unclear whether the paper’s conclusions depend on it.
- Based: passes — The paper gives a reason why it holds.
It may state two separate claims as one.
The paper states this without a source or data behind it here, so there is nothing to check it against. The quote shows it is in the paper.
In the paper
“Traditional IR taxonomies are less appropriate for AI research assistants like Asta; as users issue complex natural language queries requiring multi-step reasoning and constraint satisfaction rather than keyword queries.”
§ Understanding Usage and Engagement in AI-Powered Scientific Research Tools: The Asta Interaction Dataset > Query taxonomy.
plaindirect- Asserted: passes — The authors put it forward as true.
- Checkable: passes — It can be checked against evidence.
- Load-bearing: passes — The paper’s conclusions depend on it.
- Based: passes — The paper gives a reason why it holds.
Probably not a substantial claim.
A conclusion the paper draws from its own results — it cites no other source for it, so there is none to check. The quote shows it is in the paper.
In the paper
“More notably, Complex Contextual Narratives, where users paste entire draft paragraphs as context before posing a question, and Multi-part Queries that specify structured sub-tasks reflect phrasing behaviors shaped by general-purpose LLMs.”
§ Understanding Usage and Engagement in AI-Powered Scientific Research Tools: The Asta Interaction Dataset > Phrasing styles.
plaindirect- Asserted: passes — The authors put it forward as true.
- Checkable: passes — It can be checked against evidence.
- Load-bearing: fails — The paper’s conclusions may not depend on it.
- Based: fails — The paper may give no reason why it holds.
Probably not a substantial claim. The paper’s conclusions may not depend on it. The paper may give no reason why it holds.
A conclusion the paper draws from its own results — it cites no other source for it, so there is none to check. The quote shows it is in the paper.
In the paper
“Our behavioral findings study one representative system, Asta, and the findings may be skewed toward query types that this system happens to address well.”
§ Understanding Usage and Engagement in AI-Powered Scientific Research Tools: The Asta Interaction Dataset > Limitations and generalizability.
hedgedconditionalSingle case- Asserted: passes — The authors put it forward as true.
- Checkable: passes — It can be checked against evidence.
- Load-bearing: passes — The paper’s conclusions depend on it.
- Based: passes — The paper gives a reason why it holds.
It may state two separate claims as one.
None of the sources cited for this claim have been checked yet.
In the paper
“Classic web search work proposes query intent taxonomies including Broder's influential three-way split into informational, navigational, and transactional intents (Broder, 2002) and subsequent refinements (Rose & Levinson, 2004;Jansen et al., 2008;Jansen & Booth, 2010;Cambazoglu et al., 2021).”
§ Understanding Usage and Engagement in AI-Powered Scientific Research Tools: The Asta Interaction Dataset > 4.2 RQ2: How do users engage with the presented content?
What the sources say
plain- Asserted: passes — The authors put it forward as true.
- Checkable: passes — It can be checked against evidence.
- Load-bearing: fails — The paper’s conclusions may not depend on it.
- Based: passes — The paper gives a reason why it holds.
Probably not a substantial claim. The paper’s conclusions may not depend on it.
A conclusion the paper draws from its own results — it cites no other source for it, so there is none to check. The quote shows it is in the paper.
In the paper
“This suggests users increasingly expect search systems to handle more complex queries, likely shaped by exposure to AI-powered tools.”
§ Understanding Usage and Engagement in AI-Powered Scientific Research Tools: The Asta Interaction Dataset > Temporal changes in query behavior.
hedgedconditional- Asserted: passes — The authors put it forward as true.
- Checkable: passes — It can be checked against evidence.
- Load-bearing: fails — The paper’s conclusions may not depend on it.
- Based: passes — The paper gives a reason why it holds.
Probably not a substantial claim. The paper’s conclusions may not depend on it.
The paper states this without a source or data behind it here, so there is nothing to check it against. The quote shows it is in the paper.
In the paper
“These taxonomies have primarily been developed for keyword-based web search over general-purpose corpora.”
§ Understanding Usage and Engagement in AI-Powered Scientific Research Tools: The Asta Interaction Dataset > 4.2 RQ2: How do users engage with the presented content?
plain- Asserted: passes — The authors put it forward as true.
- Checkable: passes — It can be checked against evidence.
- Load-bearing: fails — The paper’s conclusions may not depend on it.
- Based: passes — The paper gives a reason why it holds.
Probably not a substantial claim. The paper’s conclusions may not depend on it.
None of the sources cited for this claim could be matched to a paper in Crossref, so there is nothing to check it against.
In the paper
“The LMSYS (Zhao et al., 2024b), WildChat (Zhao et al., 2024a), and Open Assistant (Köpf et al., 2023) datasets do release user conversation text, but include only basic metadata and are broad-domain rather than specific to systems targeting researchers.”
§ Understanding Usage and Engagement in AI-Powered Scientific Research Tools: The Asta Interaction Dataset > 4.2 RQ2: How do users engage with the presented content?
What the sources say
- Not matchedcites Zhao et al., 2024b
Couldn’t be matched to a paper in Crossref, so it can’t be checked.
- Not matchedcites Zhao et al., 2024a
Couldn’t be matched to a paper in Crossref, so it can’t be checked.
- Not matchedcites Köpf et al., 2023
Couldn’t be matched to a paper in Crossref, so it can’t be checked.
plain- Asserted: passes — The authors put it forward as true.
- Checkable: passes — It can be checked against evidence.
- Load-bearing: passes — The paper’s conclusions depend on it.
- Based: passes — The paper gives a reason why it holds.
It may state two separate claims as one.
- Not matched
A conclusion the paper draws from its own results — it cites no other source for it, so there is none to check. The quote shows it is in the paper.
In the paper
“Users tolerate this difference: SQA churn remains stable (close to 11 %) for response times under 5 minutes, whereas PF churn increases by 10 % relative if responses exceed 1 minute, suggesting that users expect PF to behave like traditional search but accept longer waits for SQA's synthesized reports.”
§ Understanding Usage and Engagement in AI-Powered Scientific Research Tools: The Asta Interaction Dataset > 4.2 RQ2: How do users engage with the presented content?
hedged- Asserted: passes — The authors put it forward as true.
- Checkable: passes — It can be checked against evidence.
- Load-bearing: passes — The paper’s conclusions depend on it.
- Based: passes — The paper gives a reason why it holds.
It may state two separate claims as one.
What the paper did — it cites no source for this, so there is none to check. The quote shows it is in the paper.
In the paper
“To identify query characteristics associated with successful result engagement, we fit binomial logistic regression models predicting click-through rate (CTR) for each tool.”
§ Understanding Usage and Engagement in AI-Powered Scientific Research Tools: The Asta Interaction Dataset > A.3 Statistical Analysis
plaincorrelationaln = 30- Asserted: passes — The authors put it forward as true.
- Checkable: passes — It can be checked against evidence.
- Load-bearing: passes — The paper’s conclusions depend on it.
- Based: passes — The paper gives a reason why it holds.
Probably not a substantial claim.
What the paper did — it cites no source for this, so there is none to check. The quote shows it is in the paper.
In the paper
“We report 95% confidence intervals (Wilson CIs for rates, bootstrap for unbounded values), showing the larger bound as a single ± value.”
§ Understanding Usage and Engagement in AI-Powered Scientific Research Tools: The Asta Interaction Dataset > A.3 Statistical Analysis
plain- Asserted: passes — The authors put it forward as true.
- Checkable: passes — It can be checked against evidence.
- Load-bearing: fails — The paper’s conclusions may not depend on it.
- Based: passes — The paper gives a reason why it holds.
Probably not a substantial claim. The paper’s conclusions may not depend on it. It may state two separate claims as one.
What the paper did — it cites no source for this, so there is none to check. The quote shows it is in the paper.
In the paper
“Separate models were fit for SQA and PF (since each tool exposes a different interface) using maximum likelihood estimation with a logit link (n = 30, 000 for each model).”
§ Understanding Usage and Engagement in AI-Powered Scientific Research Tools: The Asta Interaction Dataset > A.3 Statistical Analysis
plainn = 30,000- Asserted: passes — The authors put it forward as true.
- Checkable: passes — It can be checked against evidence.
- Load-bearing: fails — The paper’s conclusions may not depend on it.
- Based: passes — The paper gives a reason why it holds.
Probably not a substantial claim. The paper’s conclusions may not depend on it.
What the paper did — it cites no source for this, so there is none to check. The quote shows it is in the paper.
In the paper
“Taxonomy was built through iterative human review and LLM-assisted analysis using Gemini-2.5-proon a sample of 1000 queries.”
- Also stated in: § Specific Factual Retrieval · plain
“Taxonomy was built through iterative human review and LLM-assisted analysis using Gemini-2.5-proon a sample of 1000 queries.”
§ Understanding Usage and Engagement in AI-Powered Scientific Research Tools: The Asta Interaction Dataset > Specific Paper Retrieval
plain- Asserted: passes — The authors put it forward as true.
- Checkable: passes — It can be checked against evidence.
- Load-bearing: fails — The paper’s conclusions may not depend on it.
- Based: passes — The paper gives a reason why it holds.
Probably not a substantial claim. The paper’s conclusions may not depend on it.
- Also stated in: § Specific Factual Retrieval · plain
A conclusion the paper draws from its own results — it cites no other source for it, so there is none to check. The quote shows it is in the paper.
In the paper
“The relative size of these differences validates the importance of response quality, though the absolute change suggests that quality, at least as estimated by an LLM judge, is only one factor affecting user behavior.”
§ Understanding Usage and Engagement in AI-Powered Scientific Research Tools: The Asta Interaction Dataset > Additional information
hedgedcorrelational- Asserted: passes — The authors put it forward as true.
- Checkable: passes — It can be checked against evidence.
- Load-bearing: passes — The paper’s conclusions depend on it.
- Based: passes — The paper gives a reason why it holds.
It may state two separate claims as one.
- Rests on an assumption: LLM-as-judge assessment is a valid measure of report quality.
What the paper did — it cites no source for this, so there is none to check. The quote shows it is in the paper.
In the paper
“To control for heterogeneity in usage patterns with the tools between users, we included user history statistics as covariates: the number of previous queries issued by the user, cumulative prior clicks, and an empirical Bayes-smoothed estimate of the user's historical click rate.”
§ Understanding Usage and Engagement in AI-Powered Scientific Research Tools: The Asta Interaction Dataset > A.3 Statistical Analysis
plain- Asserted: passes — The authors put it forward as true.
- Checkable: passes — It can be checked against evidence.
- Load-bearing: passes — The paper’s conclusions depend on it.
- Based: passes — The paper gives a reason why it holds.
Probably not a substantial claim.
A conclusion the paper draws from its own results — it cites no other source for it, so there is none to check. The quote shows it is in the paper.
In the paper
“Since PF queries tend to be longer, this suggests that users now express their intents through more elaborate, abstract descriptions, while S2 queries were shorter and more densely packed with jargon.”
§ Understanding Usage and Engagement in AI-Powered Scientific Research Tools: The Asta Interaction Dataset > Additional information
hedgeddirect- Asserted: passes — The authors put it forward as true.
- Checkable: passes — It can be checked against evidence.
- Load-bearing: passes — The paper’s conclusions depend on it.
- Based: passes — The paper gives a reason why it holds.
It may state two separate claims as one.
A conclusion the paper draws from its own results — it cites no other source for it, so there is none to check. The quote shows it is in the paper.
In the paper
“the reason likely being that PF results can be consumed passively without interacting with the web content at all whereas most of the content generated by SQA can only be accessed after clicking on the web page.”
§ Understanding Usage and Engagement in AI-Powered Scientific Research Tools: The Asta Interaction Dataset > Output Schema (Pydantic):
hedgedconditional- Asserted: passes — The authors put it forward as true.
- Checkable: passes — It can be checked against evidence.
- Load-bearing: passes — The paper’s conclusions depend on it.
- Based: passes — The paper gives a reason why it holds.
Probably not a substantial claim.
- Rests on an assumption: PF results can be consumed passively without interacting with the web content at all, whereas most of the content generated by SQA can only be accessed after clicking on the web page.
What the paper did — it cites no source for this, so there is none to check. The quote shows it is in the paper.
In the paper
“Odds ratios for S2 link click on PF (95% CI; user features included as controls but not shown).”
§ Understanding Usage and Engagement in AI-Powered Scientific Research Tools: The Asta Interaction Dataset > Data/Resource Availability dataset with image and sun azimuth and sun elevation
plaincorrelational- Asserted: passes — The authors put it forward as true.
- Checkable: passes — It can be checked against evidence.
- Load-bearing: fails — The paper’s conclusions may not depend on it.
- Based: passes — The paper gives a reason why it holds.
Probably not a substantial claim. The paper’s conclusions may not depend on it.
A conclusion the paper draws from its own results — it cites no other source for it, so there is none to check. The quote shows it is in the paper.
In the paper
“This substantial gap indicates that query complexity increased not only due to the higher rate of entities and relations, but also because modern queries deviate more from the scientific jargon anchored in the documents themselves.”
§ Understanding Usage and Engagement in AI-Powered Scientific Research Tools: The Asta Interaction Dataset > Additional information
hedgeddirect- Asserted: passes — The authors put it forward as true.
- Checkable: passes — It can be checked against evidence.
- Load-bearing: passes — The paper’s conclusions depend on it.
- Based: passes — The paper gives a reason why it holds.
It may state two separate claims as one.
What the paper did — it cites no source for this, so there is none to check. The quote shows it is in the paper.
In the paper
“To control the false discovery rate when testing the significance of individual coefficients, we applied the Benjamini-Hochberg procedure across all p-values from both models.”
§ Understanding Usage and Engagement in AI-Powered Scientific Research Tools: The Asta Interaction Dataset > A.3 Statistical Analysis
plainn = 30- Asserted: passes — The authors put it forward as true.
- Checkable: passes — It can be checked against evidence.
- Load-bearing: fails — The paper’s conclusions may not depend on it.
- Based: passes — The paper gives a reason why it holds.
Probably not a substantial claim. The paper’s conclusions may not depend on it.
What the paper did — it cites no source for this, so there is none to check. The quote shows it is in the paper.
In the paper
“Taxonomy was built through iterative human review and LLM-assisted analysis using GPT-4.1 on a sample of 1000 queries.”
- Also stated in: § Data/Resource Availability Criteria · plain
“Taxonomy was built through iterative human review and LLM-assisted analysis using GPT-4.1 on a sample of 1000 queries.”
- Also stated in: § Multi-part/Multistep Query · plain
“Taxonomy was built through iterative human review and LLM-assisted analysis using GPT-4.1 on a sample of 1000 queries.”
§ Understanding Usage and Engagement in AI-Powered Scientific Research Tools: The Asta Interaction Dataset > Data/Resource Availability Criteria
plain- Asserted: passes — The authors put it forward as true.
- Checkable: passes — It can be checked against evidence.
- Load-bearing: fails — The paper’s conclusions may not depend on it.
- Based: passes — The paper gives a reason why it holds.
Probably not a substantial claim. The paper’s conclusions may not depend on it.
- Also stated in: § Data/Resource Availability Criteria · plain
A conclusion the paper draws from its own results — it cites no other source for it, so there is none to check. The quote shows it is in the paper.
In the paper
“Actions of first time users are likely more affected by novelty effect.”
§ Understanding Usage and Engagement in AI-Powered Scientific Research Tools: The Asta Interaction Dataset > Output Schema (Pydantic):
hedgedconditional- Asserted: passes — The authors put it forward as true.
- Checkable: fails — It may be too vague to check against evidence.
- Load-bearing: fails — The paper’s conclusions may not depend on it.
- Based: fails — The paper may give no reason why it holds.
Probably not a substantial claim. It may be too vague to check against evidence. The paper’s conclusions may not depend on it. The paper may give no reason why it holds.
What the paper did — it cites no source for this, so there is none to check. The quote shows it is in the paper.
In the paper
“Only coefficients significant after Benjamini-Hochberg correction are displayed.”
§ Understanding Usage and Engagement in AI-Powered Scientific Research Tools: The Asta Interaction Dataset > Output Schema (Pydantic):
plain- Asserted: passes — The authors put it forward as true.
- Checkable: passes — It can be checked against evidence.
- Load-bearing: fails — The paper’s conclusions may not depend on it.
- Based: passes — The paper gives a reason why it holds.
Probably not a substantial claim. The paper’s conclusions may not depend on it.
The paper relies on this without support.
AI-powered tools have higher latency and error rates than traditional search.
“Since AI-powered tools have higher latency and error rates than traditional search, we examined how response time and errors affect user retention.”
The paper relies on this without support.
LLM-based query labeling accurately captures query intent, phrasing style, criteria, and field of study.
“We use LLMs throughout our analysis pipeline: for query labeling (intent, phrasing, criteria, field of study), complexity assessment, duplicate detection, feedback classification, and response quality evaluation.”
“For each query aspect, we prompt GPT-4.1 with the query text, possible labels, descriptions, and in-context examples, using structured decoding to ensure valid outputs.”
The paper relies on this without support.
User thumbs up/down feedback is a valid reference standard against which the LLM quality assessment's accuracy can be measured.
“Confusion matrix comparing user feedback (thumbs up/down) with LLM quality assessment.”
The paper relies on this without support.
The first section of a report is almost always an introduction to the topic.
“Given that the first section is almost always an introduction to the topic”
The paper relies on this without support.
Users must click to expand the section text in the SQA response.
“users must click to expand the section text in the SQA response”
The paper relies on this without support.
PF results can be consumed passively without interacting with the web content at all, whereas most of the content generated by SQA can only be accessed after clicking on the web page.
“PF results can be consumed passively without interacting with the web content at all whereas most of the content generated by SQA can only be accessed after clicking on the web page”
The paper relies on this without support.
Thumbs up/down feedback would directly indicate satisfaction.
“thumbs up/down feedback would directly indicate satisfaction”
The paper relies on this without support.
LLM-as-judge assessment is a valid measure of report quality.
“This prompt assesses the quality of AI-generated responses using an LLM-as-judge approach.”
Self-check
Percentages, sums and reported differences re-computed from the paper’s own numbers.
Each contradiction between two passages listed here was confirmed by an independent check.
Rated major: it would touch a result — a value a result rests on, reported and recomputed p-values on opposite sides of the significance level, two passages that conflict with no sign which is right, or a cited work retracted before this paper was published.
In the paper
§ Understanding Usage and Engagement in AI-Powered Scientific Research Tools: The Asta Interaction Dataset > User experience stages.
“less than 10% of users initiate 10 or more queries.”
§ Understanding Usage and Engagement in AI-Powered Scientific Research Tools: The Asta Interaction Dataset > Session duration and usage patterns.
“more than half of those repeat users have initiated more than 15 queries.”
Rated major: it would touch a result — a value a result rests on, reported and recomputed p-values on opposite sides of the significance level, two passages that conflict with no sign which is right, or a cited work retracted before this paper was published.
In the paper
§ Understanding Usage and Engagement in AI-Powered Scientific Research Tools: The Asta Interaction Dataset > User experience stages.
“About 40% of users initiate at least 2 queries”
§ Understanding Usage and Engagement in AI-Powered Scientific Research Tools: The Asta Interaction Dataset > Session duration and usage patterns.
“twice as many of our users have initiated multiple queries as have initiated only a single query”
Rated minor: it would not touch a result — a value no result rests on, a p-value that stays on the same side of the significance level, or a conflict that is clerical, resolved elsewhere in the paper, or outside its own findings.
In the paper
§ Understanding Usage and Engagement in AI-Powered Scientific Research Tools: The Asta Interaction Dataset > Output Schema (Pydantic):
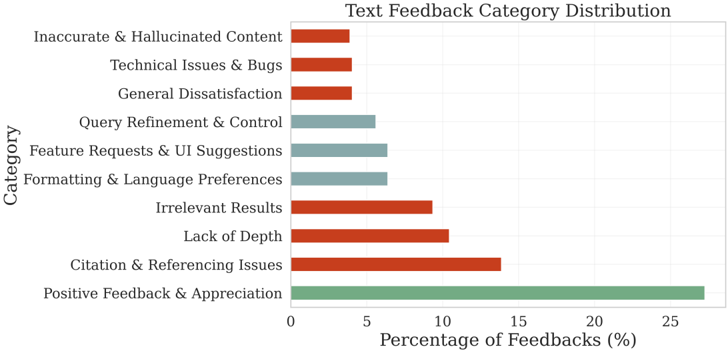
“| Negative | 1,373 | 3.9% [3.0%, 5.0%] |”
§ Understanding Usage and Engagement in AI-Powered Scientific Research Tools: The Asta Interaction Dataset > Additional information
“Reports assessed as high quality have an average CTR of 5.5 % compared to 3.8 % for reports assessed as low quality”
Citations
Cites
Broder, A. (2002) · ACM SIGIR Forum · doi:10.1145/792550.792552 · Cited by 1,944
Accurately interpreting clickthrough data as implicit feedback
Joachims, T., Granka, L., Pan, B., Hembrooke, H., & Gay, G. (2005) · Proceedings of the 28th annual international ACM SIGIR conference on Research and development in information retrieval · doi:10.1145/1076034.1076063 · Cited by 1,408
Understanding user goals in web search
Rose, D. E., & Levinson, D. (2004) · Proceedings of the 13th international conference on World Wide Web · doi:10.1145/988672.988675 · Cited by 563
Determining the informational, navigational, and transactional intent of Web queries
Jansen, B. J. J., Booth, D. L., & Spink, A. H. (2007) · Information Processing & Management · doi:10.1016/j.ipm.2007.07.015 · Cited by 470
Evaluating implicit measures to improve web search
Fox, S., Karnawat, K., Mydland, M., Dumais, S., & White, T. (2005) · ACM Transactions on Information Systems · doi:10.1145/1059981.1059982 · Cited by 412
Chatterji, A., Cunningham, T., Deming, D., Hitzig, Z., Ong, C., Shan, C. Y., & Wadman, K. (2025) · doi:10.3386/w34255 · Cited by 233
OpenAssistant Conversations - Democratizing Large Language Model Alignment
Köpf, A., Kilcher, Y., von Rütte, D., Anagnostidis, S., Tam, Z.-R., Stevens, K., Barhoum, A., Duc, N. M., Stanley, O., Nagyfi, R., et al. (2023) · arXiv · doi:10.48550/arxiv.2304.07327 · Cited by 218
Modeling dwell time to predict click-level satisfaction
Kim, Y., Hassan, A., White, R. W., & Zitouni, I. (2014) · Proceedings of the 7th ACM international conference on Web search and data mining · doi:10.1145/2556195.2556220 · Cited by 164
Clio: Privacy-Preserving Insights into Real-World AI UsePreprint
Tamkin, A., McCain, M., Handa, K., Durmus, E., Lovitt, L., Rathi, A., Huang, S., Mountfield, A., Hong, J., Ritchie, S., et al. (2024) · arXiv.org · doi:10.48550/arxiv.2412.13678 · Cited by 119
A Comprehensive Survey of Deep Research: Systems, Methodologies, and ApplicationsPreprint
Xu, R., & Peng, J. (2025) · arXiv (Cornell University) · doi:10.48550/arxiv.2506.12594 · Cited by 117
Research works printed but not linked: 2
- Kunal Handa, Alex Tamkin, Miles McCain, Saffron Huang, Esin Durmus, Sarah Heck, Jared Mueller, Jerry Hong, Stuart Ritchie, Tim Belonax, Kevin K. Troy, Dario Amodei, Jared Kaplan, Jack Clark, and Deep Ganguli. Which economic tasks are performed with ai? evidence from millions of claude conversations, 2025. URL https://arxiv.org/abs/2503. 04761.
- Wenting Zhao, Xiang Ren, Jack Hessel, Claire Cardie, Yejin Choi, and Yuntian Deng. Wild- chat: 1m chatgpt interaction logs in the wild, 2024b. URL https://arxiv.org/abs/2405. 01470.
Cited by
Sorted by citations
What's Missing in Autonomous Research? A Systematization of Systems, Benchmarks, and VerificationPreprint
Ren, X., Sun, Y., Yi, C., Zhang, K., Guo, J., Du, J., & Yang, H. (2026) · Research Square · doi:10.21203/rs.3.rs-10060294/v1 · Cited by 2
DRACULA: Hunting for the Actions Users Want Deep Research Agents to ExecutePreprint
Balepur, N., Hamada, M., Kishore, V., Feldman, S., Singh, A., Siangliulue, P., Chang, J. C., Rudinger, R., Choi, E., Boyd-Graber, J. L., et al. (2026) · arXiv (Cornell University) · doi:10.48550/arxiv.2604.23815 · Cited by 1
Self-citationReam: Unfolding Mutual Awareness in Human-Agent WorkspacesPreprint
Jiang, P., Suh, S., Kishore, V., Bragg, J., Xia, H., Siangliulue, P., Weld, D. S., Zhang, A. X., & Chang, J. C. (2026) · arXiv (Cornell University) · doi:10.48550/arxiv.2610.09497
Self-citationCompLit: Scientific Literature Search Benchmarks Must Cover Implicit, Cumulative, and Unmet NeedsPreprint
Ko, D., Kim, J., Jeong, S., Lee, Y.-J., Lee, D., Kim, J., Kim, G., Lee, M., & Lee, K. (2026) · arXiv (Cornell University)
Metadata
- Authors
- Haddad, D., Bareket, D., Chang, J. C., DeYoung, J., Hwang, J. D., Katz, U., Polak, M., Suh, S., Surana, H., Tiktinsky, A., Atmakuri, S., Bragg, J., D'Arcy, M., Feldman, S., Hassan-Ali, A., Lozano, R., Majumder, B. P., McGrady, C., Singh, A., Vlahos, B., Goldberg, Y., & Downey, D.
- ORCID
- Venue
- arXiv
- Publisher
- arXiv
- Published
- 2026
- ISSN
- 2331-8422 (ISSN-L)
- arXiv
- 2602.23335
- OpenAlex
- W7131853034
- Cited by
- 4
- References
- 23
- Citations by year
- 2026: 4
- Type
- posted content
- Language
- en
- Open access
- green
- arxiv.org
- Licence
- Locations
- arXiv (Cornell University) (submittedVersion, cc-by)
- arXiv (Cornell University) (cc-by)
- Topics
- Physical Sciences › Computer Science › Information Systems › Information Retrieval and Search Behavior
- Physical Sciences › Computer Science › Information Systems › Recommender Systems and Techniques
- Social Sciences › Library and Information Sciences › Library Science and Information Literacy
- Keywords
- AI research assistant, user interaction patterns, user engagement, query patterns, literature discovery, scientific question answering, retrieval-augmented generation
About these checks
Registry, retraction, Cites and statistics results are computed, not judged, with one exception: a printed reference that no index lists is read once by a model before it counts as a citation error. Claims are extracted by a model and kept only when their quote appears verbatim in the text; each cited source is then checked, with a model’s help, for whether it says what the claim relies on. Those verdicts can be wrong — read the claim’s quote and the cited source before relying on one.
A language model drew the claims from the paper on 2026-11-10, under version 3 of the claim definition (model deepseek-v4.1-flash, prompt extract-v3).
A second model labelled each claim on 2026-11-10 (model jev-1.13-20260917, definition revision gold-guideline-v0.2).
Cited sources are checked with a language model’s help (gpt-6-sol).
Statistics and arithmetic are recomputed, not judged.
Confidence bands are shown only for fields calibrated on our annotated test set. None is calibrated yet, so no band is shown.
What counts as a claim ›How we measure confidence ›How we check this ›
Are you an author, or do you see a problem with this page? Request a review
