

Technical Note: Downscaling RCM precipitation to the station scale using statistical transformations—A comparison of methods
Open accessPublished version of a preprint
The DOI matches its Crossref record; 41 of the 41 references it cites were found in a registry or an index.
Abstract
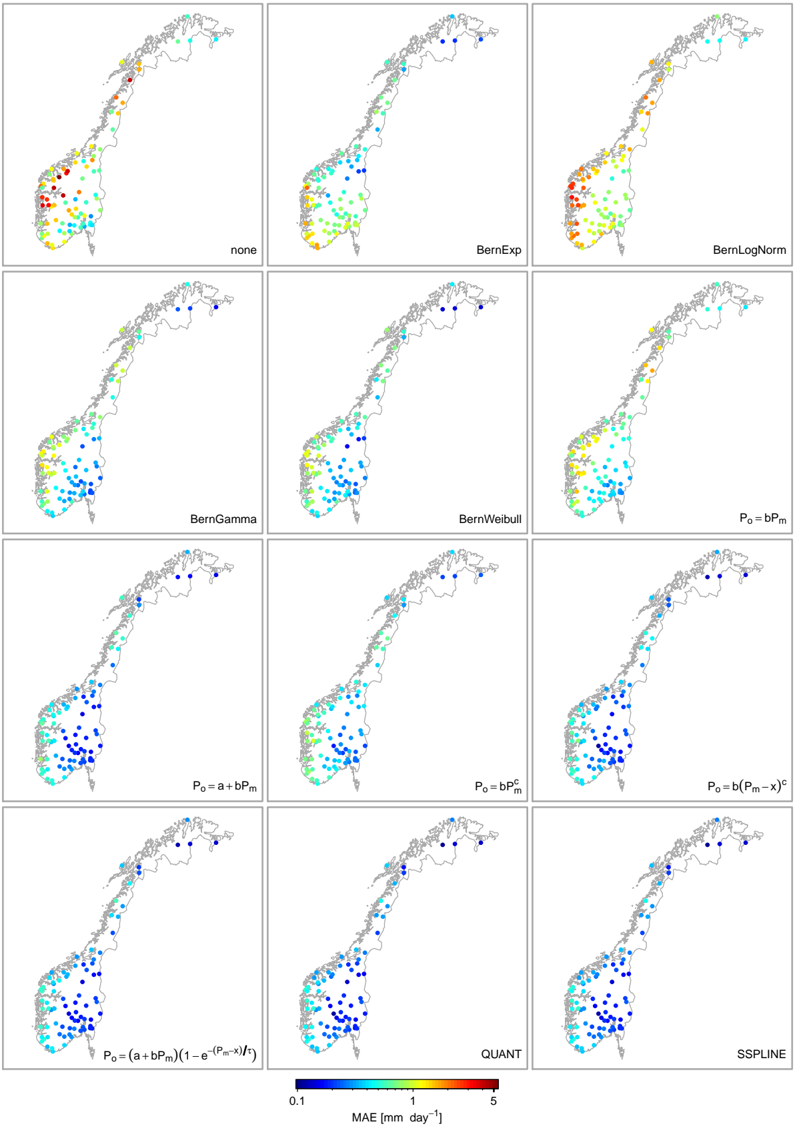
The impact of climate change on water resources is usually assessed at the local scale. However, regional climate models (RCMs) are known to exhibit systematic biases in precipitation. Hence, RCM simulations need to be post-processed in order to produce reliable estimates of local scale climate. Popular post-processing approaches are based on statistical transformations, which attempt to adjust the distribution of modelled data such that it closely resembles the observed climatology. However, the diversity of suggested methods renders the selection of optimal techniques difficult and therefore there is a need for clarification. In this paper, statistical transformations for post-processing RCM output are reviewed and classified into (1) distribution derived transformations, (2) parametric transformations and (3) nonparametric transformations, each differing with respect to their underlying assumptions. A real world application, using observations of 82 precipitation stations in Norway, showed that nonparametric transformations have the highest skill in systematically reducing biases in RCM precipitation.
Overview
The claims and statistics of this paper haven’t been checked yet.
Free: it reads the open-access text and checks the first 5 claims that cite a source we can check. Create a free account to check every claim.
Integrity signals
Registry
Cites
Statistics
Figures



Verification
Claims the paper makes
The claims and statistics of this paper haven’t been checked yet.
Free: it reads the open-access text and checks the first 5 claims that cite a source we can check. Create a free account to check every claim.
Claims other papers make about this one
Each is checked against this paper’s own text: does it say what the citing paper says it does?
The source backs part of the claim, not all of it — or backs it for a different population, condition or comparison.
In the citing paper
“Quantile mapping is the most used bias correction technique due to its ease of handling large amounts of data and its computational efficiency [58,59].”
From Climate Change Impacts on Streamflow in the Krishna River Basin, India: Uncertainty and Multi-Site Analysis (2022) · cites this paper as [58]
Experimental — accuracy not yet measured
Self-check
Percentages, sums and reported differences re-computed from the paper’s own numbers.
The self-check needs the paper’s full text.
Citations
Cites
The Elements of Statistical Learning
Hastie, T., Friedman, J., & Tibshirani, R. (2001) · Springer Series in Statistics · doi:10.1007/978-0-387-21606-5 · Cited by 24,162
Uppala, S. M., KÅllberg, P. W., Simmons, A. J., Andrae, U., Bechtold, V. D. C., Fiorino, M., Gibson, J. K., Haseler, J., Hernandez, A., Kelly, G. A., et al. (2005) · Quarterly Journal of the Royal Meteorological Society · doi:10.1256/qj.04.176 · Cited by 6,804 · cited 1×
“Modelled precipitation was extracted from a HIRHAM RCM simulation with 25 km resolution (Førland et al., 2009, 2011) forced with the ERA40 reanalysis (Uppala et al., 2005) on a model domain covering Norway and the Nordic Arctic.”
MethodTeutschbein, C., & Seibert, J. (2012) · Journal of Hydrology · doi:10.1016/j.jhydrol.2012.05.052 · Cited by 2,214 · cited 13×
“, 2011; Teutschbein and Seibert, 2012), the standard deviation (Engen-Skaugen, 2007; Li et al., 2010; Themeßl et al., 2011; Teutschbein and Seibert, 2012) and the skewness (Li et al.”
BackgroundMethodResultInfluentialHydrologic Implications of Dynamical and Statistical Approaches to Downscaling Climate Model Outputs
Wood, A. W., Leung, L. R., Sridhar, V., & Lettenmaier, D. P. (2004) · Climatic Change · doi:10.1023/b:clim.0000013685.99609.9e · Cited by 1,886 · cited 3×
“(2) using the empirical CDF of observed and modelled values instead of assuming parametric distributions (e.g.Panofsky and Brier, 1968; Wood et al., 2004; Reichle and Koster, 2004; Boé et al., 2007; Themeßl et al., 2011, 2012).”
BackgroundMethodMaraun, D., Wetterhall, F., Ireson, A. M., Chandler, R. E., Kendon, E. J., Widmann, M., Brienen, S., Rust, H. W., Sauter, T., Themeßl, M., et al. (2010) · Reviews of Geophysics · doi:10.1029/2009rg000314 · Cited by 1,805 · cited 3×
“Further, “statistical bias correction” (Piani et al., 2010a,b), “direct error correction methods” (Themeßl et al., 2011) and “model output statistics (MOS)” (Maraun et al., 2010) have been used to refer to the methods under investigation.”
MethodStatistical bias correction for daily precipitation in regional climate models over Europe
Piani, C., Haerter, J. O., & Coppola, E. (2010) · Theoretical and Applied Climatology · doi:10.1007/s00704-009-0134-9 · Cited by 1,154 · cited 9×
“…a set of scores is needed that quantifies the similarity of the observed and the (corrected) modelled empirical CDF. Previously used scores include overall measures, such as the root mean square error (Piani et al., 2010b) or the Kolmogorov-Smirnov two sample statistic (Dosio and Paruolo, 2011).”
BackgroundMethodInfluentialSome applications of statistics to meteorology
Panofsky, H. A., Brier, G. W., & Best, W. H. (1958) · University of Michigan Library Repository · Cited by 1,083
Li, H., Sheffield, J., & Wood, E. F. (2010) · Journal of Geophysical Research: Atmospheres · doi:10.1029/2009jd012882 · Cited by 901 · cited 6×
“Other suggested scores assess specific moments of the distribution including the mean (Engen-Skaugen, 2007; Li et al., 2010; Dosio and Paruolo, 2011; Themeßl et al., 2011; Turco et al., 2011; Teutschbein and Seibert, 2012), the standard deviation (Engen-Skaugen, 2007; Li et al., 2010; Themeßl et…”
BackgroundMethodInfluentialHow Well Do Coupled Models Simulate Today's Climate?
Reichler, T., & Kim, J. (2008) · Bulletin of the American Meteorological Society · doi:10.1175/bams-89-3-303 · Cited by 881
Piani, C., Weedon, G. P., Best, M., Gomes, S. M., Viterbo, P., Hagemann, S., & Haerter, J. O. (2010) · Journal of Hydrology · doi:10.1016/j.jhydrol.2010.10.024 · Cited by 868 · cited 9×
“…a set of scores is needed that quantifies the similarity of the observed and the (corrected) modelled empirical CDF. Previously used scores include overall measures, such as the root mean square error (Piani et al., 2010b) or the Kolmogorov-Smirnov two sample statistic (Dosio and Paruolo, 2011).”
BackgroundMethodInfluential
Cited by
Cannon, A. J., Sobie, S. R., & Murdock, T. Q. (2015) · Journal of Climate · doi:10.1175/jcli-d-14-00754.1 · Cited by 1,700
“Of quantile mapping algorithms, those that rely on nonparametric estimates of quantiles have tended to out-perform those that fit a parametric distribution to data (Gudmundsson et al. 2012).”
A trend-preserving bias correction – the ISI-MIP approach
Hempel, S., Frieler, K., Warszawski, L., Schewe, J., & Piontek, F. (2013) · Earth System Dynamics · doi:10.5194/esd-4-219-2013 · Cited by 1,238
“Non-parametric methods have been shown to be very successful in mapping simulations to the present climate owing to there flexibility (Gudmundsson et al., 2012).”
MethodCannon, A. J. (2018) · Climate Dynamics · doi:10.1007/s00382-017-3580-6 · Cited by 663
Towards process-informed bias correction of climate change simulations
Maraun, D., Shepherd, T. G., Widmann, M., Zappa, G., Walton, D., Gutiérrez, J. M., Hagemann, S., Richter, I., Soares, P. M. M., Hall, A., et al. (2017) · Nature Climate Change · doi:10.1038/nclimate3418 · Cited by 630
“Cross-validation is widely used for establishing skill of bias correction, often only for calibrated properties of the marginal distribution 6,47,48,23,49 (some exceptions evaluate temporal or spatial depen-89 dence 24,27 ).”
MethodChen, J., Brissette, F. P., Chaumont, D., & Braun, M. (2013) · Water Resources Research · doi:10.1002/wrcr.20331 · Cited by 516
Metadata
- Authors
- Gudmundsson, L., Bremnes, J. B., Haugen, J. E., & Engen-Skaugen, T.
- Affiliations
- Norwegian Meteorological Institute (NO)
- Venue
- Hydrology and Earth System Sciences
- Publisher
- Copernicus GmbH
- Published
- 2012-09-21
- Volume
- 16
- Issue
- 9
- Pages
- 3383-3390
- ISSN
- 1027-5606 (ISSN-L)
- 1607-7938
- OpenAlex
- W2166535858
- Cited by
- 1,318
- References
- 41
- Citations by year
- 2026: 132 · 2025: 134 · 2024: 124 · 2023: 136 · 2022: 137 · 2021: 172 · 2020: 116 · 2019: 85 · 2018: 76 · 2017: 68 · 2016: 63 · 2015: 35 · 2014: 20 · 2013: 17 · 2012: 3
- FWCI
- 20.14
- Type
- journal article
- Language
- en
- Open access
- gold
- doi.org
- Licence
- Locations
- Hydrology and earth system sciences (publishedVersion, cc-by)
- DOAJ (DOAJ: Directory of Open Access Journals) (submittedVersion)
- Repository for Publications and Research Data (ETH Zurich) (submittedVersion, cc-by)
- ETH Zürich Research Collection (cc-by)
- Topics
- Physical Sciences › Environmental Science › Global and Planetary Change › Climate variability and models
- Physical Sciences › Earth and Planetary Sciences › Atmospheric Science › Precipitation Measurement and Analysis
- Physical Sciences › Environmental Science › Water Science and Technology › Hydrology and Watershed Management Studies
- Keywords
- dynamical downscaling, precipitation bias correction, statistical post-processing, parametric transformation, climate change impacts on water resources
About these checks
Registry, retraction, Cites and statistics results are computed, not judged, with one exception: a printed reference that no index lists is read once by a model before it counts as a citation error. Claims are extracted by a model and kept only when their quote appears verbatim in the text; each cited source is then checked, with a model’s help, for whether it says what the claim relies on. Those verdicts can be wrong — read the claim’s quote and the cited source before relying on one.
Statistics and arithmetic are recomputed, not judged.
Confidence bands are shown only for fields calibrated on our annotated test set. None is calibrated yet, so no band is shown.
What counts as a claim ›How we measure confidence ›How we check this ›
Are you an author, or do you see a problem with this page? Request a review
How to cite
Cite CoChat for the checks on this page, and the paper for its own findings.
- This page
- CoChat. (2026). Citation check: Technical Note: Downscaling RCM precipitation to the station scale using statistical transformations—A comparison of methods. https://app.cochat.ai/papers/10.5194/hess-16-3383-2012
- The paper
- Gudmundsson, L., Bremnes, J. B., Haugen, J. E., & Engen-Skaugen, T. (2012). Technical Note: Downscaling RCM precipitation to the station scale using statistical transformations—A comparison of methods. Hydrology and Earth System Sciences. https://doi.org/10.5194/hess-16-3383-2012
Data sources
Bibliographic data: Semantic Scholar, OpenAlex, Crossref.
Contains information from the Semantic Scholar Academic Graph Datasets, made available under the ODC Attribution License (ODC-BY 1.0).
Semantic Scholar’s data is described in: Kinney, R., et al. (2023). The Semantic Scholar Open Data Platform. arXiv:2301.10140.
