

Technical Note: Downscaling RCM precipitation to the station scale using statistical transformations—A comparison of methods
Open accessPublished version of a preprint
The DOI matches its Crossref record; 41 of the 41 references it cites were found in a registry or an index.
Abstract
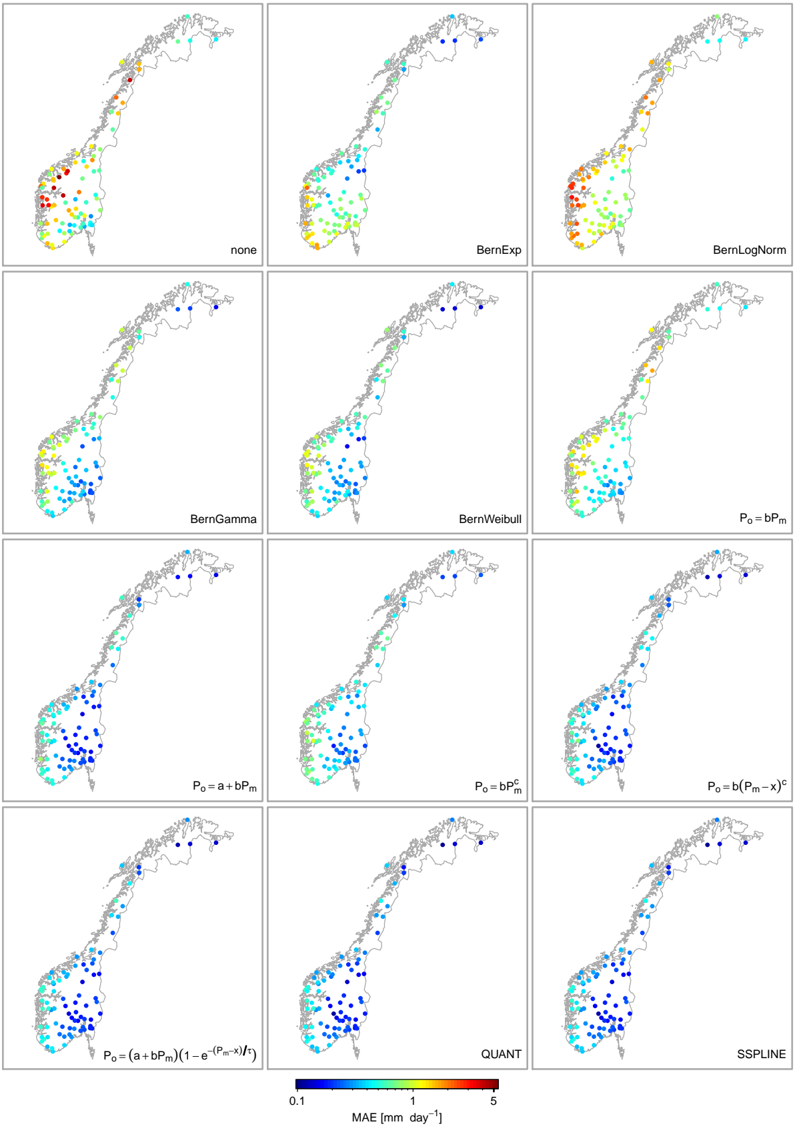
The impact of climate change on water resources is usually assessed at the local scale. However, regional climate models (RCMs) are known to exhibit systematic biases in precipitation. Hence, RCM simulations need to be post-processed in order to produce reliable estimates of local scale climate. Popular post-processing approaches are based on statistical transformations, which attempt to adjust the distribution of modelled data such that it closely resembles the observed climatology. However, the diversity of suggested methods renders the selection of optimal techniques difficult and therefore there is a need for clarification. In this paper, statistical transformations for post-processing RCM output are reviewed and classified into (1) distribution derived transformations, (2) parametric transformations and (3) nonparametric transformations, each differing with respect to their underlying assumptions. A real world application, using observations of 82 precipitation stations in Norway, showed that nonparametric transformations have the highest skill in systematically reducing biases in RCM precipitation.
Overview
The claims and statistics of this paper haven’t been checked yet.
Free: it reads the open-access text and checks the first 5 claims that cite a source we can check. Create a free account to check every claim.
Integrity signals
Registry
Cites
Statistics
Figures



Verification
Claims the paper makes
The claims and statistics of this paper haven’t been checked yet.
Free: it reads the open-access text and checks the first 5 claims that cite a source we can check. Create a free account to check every claim.
Claims other papers make about this one
Each is checked against this paper’s own text: does it say what the citing paper says it does?
The source backs part of the claim, not all of it — or backs it for a different population, condition or comparison.
In the citing paper
“Quantile mapping is the most used bias correction technique due to its ease of handling large amounts of data and its computational efficiency [58,59].”
From Climate Change Impacts on Streamflow in the Krishna River Basin, India: Uncertainty and Multi-Site Analysis (2022) · cites this paper as [58]
Experimental — accuracy not yet measured
Self-check
Percentages, sums and reported differences re-computed from the paper’s own numbers.
The self-check needs the paper’s full text.
Citations
Cites
The Elements of Statistical Learning
Hastie, T., Friedman, J., & Tibshirani, R. (2001) · Springer Series in Statistics · doi:10.1007/978-0-387-21606-5 · Cited by 24,162
Uppala, S. M., KÅllberg, P. W., Simmons, A. J., Andrae, U., Bechtold, V. D. C., Fiorino, M., Gibson, J. K., Haseler, J., Hernandez, A., Kelly, G. A., et al. (2005) · Quarterly Journal of the Royal Meteorological Society · doi:10.1256/qj.04.176 · Cited by 6,804 · cited 1×
“Modelled precipitation was extracted from a HIRHAM RCM simulation with 25 km resolution (Førland et al., 2009, 2011) forced with the ERA40 reanalysis (Uppala et al., 2005) on a model domain covering Norway and the Nordic Arctic.”
MethodTeutschbein, C., & Seibert, J. (2012) · Journal of Hydrology · doi:10.1016/j.jhydrol.2012.05.052 · Cited by 2,214 · cited 13×
“, 2011; Teutschbein and Seibert, 2012), the standard deviation (Engen-Skaugen, 2007; Li et al., 2010; Themeßl et al., 2011; Teutschbein and Seibert, 2012) and the skewness (Li et al.”
BackgroundMethodResultInfluentialHydrologic Implications of Dynamical and Statistical Approaches to Downscaling Climate Model Outputs
Wood, A. W., Leung, L. R., Sridhar, V., & Lettenmaier, D. P. (2004) · Climatic Change · doi:10.1023/b:clim.0000013685.99609.9e · Cited by 1,886 · cited 3×
“(2) using the empirical CDF of observed and modelled values instead of assuming parametric distributions (e.g.Panofsky and Brier, 1968; Wood et al., 2004; Reichle and Koster, 2004; Boé et al., 2007; Themeßl et al., 2011, 2012).”
BackgroundMethodMaraun, D., Wetterhall, F., Ireson, A. M., Chandler, R. E., Kendon, E. J., Widmann, M., Brienen, S., Rust, H. W., Sauter, T., Themeßl, M., et al. (2010) · Reviews of Geophysics · doi:10.1029/2009rg000314 · Cited by 1,805 · cited 3×
“Further, “statistical bias correction” (Piani et al., 2010a,b), “direct error correction methods” (Themeßl et al., 2011) and “model output statistics (MOS)” (Maraun et al., 2010) have been used to refer to the methods under investigation.”
MethodStatistical bias correction for daily precipitation in regional climate models over Europe
Piani, C., Haerter, J. O., & Coppola, E. (2010) · Theoretical and Applied Climatology · doi:10.1007/s00704-009-0134-9 · Cited by 1,154 · cited 9×
“…a set of scores is needed that quantifies the similarity of the observed and the (corrected) modelled empirical CDF. Previously used scores include overall measures, such as the root mean square error (Piani et al., 2010b) or the Kolmogorov-Smirnov two sample statistic (Dosio and Paruolo, 2011).”
BackgroundMethodInfluentialSome applications of statistics to meteorology
Panofsky, H. A., Brier, G. W., & Best, W. H. (1958) · University of Michigan Library Repository · Cited by 1,083
Li, H., Sheffield, J., & Wood, E. F. (2010) · Journal of Geophysical Research: Atmospheres · doi:10.1029/2009jd012882 · Cited by 901 · cited 6×
“Other suggested scores assess specific moments of the distribution including the mean (Engen-Skaugen, 2007; Li et al., 2010; Dosio and Paruolo, 2011; Themeßl et al., 2011; Turco et al., 2011; Teutschbein and Seibert, 2012), the standard deviation (Engen-Skaugen, 2007; Li et al., 2010; Themeßl et…”
BackgroundMethodInfluentialHow Well Do Coupled Models Simulate Today's Climate?
Reichler, T., & Kim, J. (2008) · Bulletin of the American Meteorological Society · doi:10.1175/bams-89-3-303 · Cited by 881
Piani, C., Weedon, G. P., Best, M., Gomes, S. M., Viterbo, P., Hagemann, S., & Haerter, J. O. (2010) · Journal of Hydrology · doi:10.1016/j.jhydrol.2010.10.024 · Cited by 868 · cited 9×
“…a set of scores is needed that quantifies the similarity of the observed and the (corrected) modelled empirical CDF. Previously used scores include overall measures, such as the root mean square error (Piani et al., 2010b) or the Kolmogorov-Smirnov two sample statistic (Dosio and Paruolo, 2011).”
BackgroundMethodInfluential
Cited by
Cannon, A. J., Sobie, S. R., & Murdock, T. Q. (2015) · Journal of Climate · doi:10.1175/jcli-d-14-00754.1 · Cited by 1,700
“Of quantile mapping algorithms, those that rely on nonparametric estimates of quantiles have tended to out-perform those that fit a parametric distribution to data (Gudmundsson et al. 2012).”
A trend-preserving bias correction – the ISI-MIP approach
Hempel, S., Frieler, K., Warszawski, L., Schewe, J., & Piontek, F. (2013) · Earth System Dynamics · doi:10.5194/esd-4-219-2013 · Cited by 1,238
“Non-parametric methods have been shown to be very successful in mapping simulations to the present climate owing to there flexibility (Gudmundsson et al., 2012).”
MethodCannon, A. J. (2018) · Climate Dynamics · doi:10.1007/s00382-017-3580-6 · Cited by 663
Towards process-informed bias correction of climate change simulations
Maraun, D., Shepherd, T. G., Widmann, M., Zappa, G., Walton, D., Gutiérrez, J. M., Hagemann, S., Richter, I., Soares, P. M. M., Hall, A., et al. (2017) · Nature Climate Change · doi:10.1038/nclimate3418 · Cited by 630
“Cross-validation is widely used for establishing skill of bias correction, often only for calibrated properties of the marginal distribution 6,47,48,23,49 (some exceptions evaluate temporal or spatial depen-89 dence 24,27 ).”
MethodChen, J., Brissette, F. P., Chaumont, D., & Braun, M. (2013) · Water Resources Research · doi:10.1002/wrcr.20331 · Cited by 516
Bias-corrected climate projections for South Asia from Coupled Model Intercomparison Project-6
Mishra, V., Bhatia, U., & Tiwari, A. D. (2020) · Scientific Data · doi:10.1038/s41597-020-00681-1 · Cited by 472
Teutschbein, C., & Seibert, J. (2013) · Hydrology and Earth System Sciences · doi:10.5194/hess-17-5061-2013 · Cited by 425
Wang, L., & Chen, W. (2014) · International Journal of Climatology · doi:10.1002/joc.3822 · Cited by 402
“Furthermore, if the theoretical distribution of the variable of interest is known, expression 1 can be written as (Gudmundsson et al., 2012): x̃adjst = F−1o−c · Fm−c (x) (2) where F−1o−c is the quantile function corresponding to observations and F m − c is the cumulative distribution function (CDF)…”
BackgroundMethodInfluentialThe European climate under a 2 °C global warming
Vautard, R., Gobiet, A., Sobolowski, S., Kjellström, E., Stegehuis, A., Watkiss, P., Mendlik, T., Landgren, O., Nikulin, G., Teichmann, C., et al. (2014) · Environmental Research Letters · doi:10.1088/1748-9326/9/3/034006 · Cited by 389
The 2018–2020 Multi‐Year Drought Sets a New Benchmark in Europe
Rakovec, O., Samaniego, L., Hari, V., Markonis, Y., Moravec, V., Thober, S., Hanel, M., & Kumar, R. (2022) · Earth's Future · doi:10.1029/2021ef002394 · Cited by 332
“The overlapping period allowed for correction of biases (Gudmundsson et al., 2012) in the data set of Casty with respect to E-OBS (Hanel et al., 2018; Moravec et al., 2021), and the merged meteorologic product is used as an input into the mHM (Kumar et al., 2013; Samaniego et al., 2010) to obtain…”
MethodSwitanek, M. B., Troch, P. A., Castro, C. L., Leuprecht, A., Chang, H.-I., Mukherjee, R., & Demaria, E. M. C. (2017) · Hydrology and Earth System Sciences · doi:10.5194/hess-21-2649-2017 · Cited by 257
Hosseinzadehtalaei, P., Tabari, H., & Willems, P. (2020) · Journal of Hydrology · doi:10.1016/j.jhydrol.2020.125249 · Cited by 250
Bias correction of climate models for hydrological modelling – are simple methods still useful?
Shrestha, M., Acharya, S. C., & Shrestha, P. K. (2017) · Meteorological Applications · doi:10.1002/met.1655 · Cited by 249
“…climate estimates of varying resolutions over a range of physiographical regions (Yang et al., 2010; Themeßl et al., 2011; Berg et al., 2012; Gudmundsson et al., 2012; Piani and Haerter, 2012; Teutschbein and Seibert, 2012, 2013; Chen et al., 2013; Gutjahr and Heinemann, 2013; Teng et al.,…”
BackgroundMethodInfluentialCannon, A. J. (2016) · Journal of Climate · doi:10.1175/jcli-d-15-0679.1 · Cited by 237
“Recent reviews of multiple methods by Teutschbein and Seibert (2012),Gudmundsson et al. (2012), andChen et al. (2013) have recommended the use of quantile mapping bias correction algorithms, which adjust the distribution of a modeled variable so that it matches that of observations.”
MethodMultivariate—Intervariable, Spatial, and Temporal—Bias Correction*
Vrac, M., & Friederichs, P. (2015) · Journal of Climate · doi:10.1175/jcli-d-14-00059.1 · Cited by 236
“(1) This mapping function h can be derived from distributions and regression-like transformations: in both cases either parametric or nonparametric (for some details, see, e.g., Gudmundsson et al. 2012).”
BackgroundMethodTong, Y., Gao, X., Han, Z., Xu, Y., Xu, Y., & Giorgi, F. (2021) · Climate Dynamics · doi:10.1007/s00382-020-05447-4 · Cited by 220
“The RQUANT method is a non-parametric quantile mapping using robust empirical quantiles.”
MethodInfluentialLuo, M., Liu, T., Meng, F., Duan, Y., Frankl, A., Bao, A., & De Maeyer, P. (2018) · Water · doi:10.3390/w10081046 · Cited by 223
“simul tion of convectiv precipitatio [40].”
BackgroundInfluentialBias correcting precipitation forecasts to improve the skill of seasonal streamflow forecasts
Crochemore, L., Ramos, M.-H., & Pappenberger, F. (2016) · Hydrology and Earth System Sciences · doi:10.5194/hess-20-3601-2016 · Cited by 225
“A range of methods has been proposed in the literature, with performance varying depending on on the modelling 25 chain and the studied area (Christensen et al., 2008; Gudmundsson et al., 2012).”
BackgroundMendez, M., Maathuis, B., Hein-Griggs, D., & Alvarado-Gamboa, L.-F. (2020) · Water · doi:10.3390/w12020482 · Cited by 221
“explanation of these methods can be found in literature [2,6,22,29,32,43,69,87].”
MethodMultivariate bias corrections of climate simulations: which benefits for which losses?
François, B., Vrac, M., Cannon, A. J., Robin, Y., & Allard, D. (2020) · Earth System Dynamics · doi:10.5194/esd-11-537-2020 · Cited by 202
Sunyer, M. A., Hundecha, Y., Lawrence, D., Madsen, H., Willems, P., Martinkova, M., Vormoor, K., Bürger, G., Hanel, M., Kriaučiūnienė, J., et al. (2015) · Hydrology and Earth System Sciences · doi:10.5194/hess-19-1827-2015 · Cited by 203
Maurer, E. P., & Pierce, D. W. (2014) · Hydrology and Earth System Sciences · doi:10.5194/hess-18-915-2014 · Cited by 191
“While both parametric and nonparametric approaches are widely used in QM, nonparametric methods have shown higher skill in reducing systematic errors in modeled precipitation (Gudmundsson et al., 2012).”
BackgroundMethodSchwingshackl, C., Sillmann, J., Vicedo‐Cabrera, A. M., Sandstad, M., & Aunan, K. (2021) · Earth's Future · doi:10.1029/2020ef001885 · Cited by 190
“To test the robustness of our results, we additionally perform bias adjustment using quantile mapping (Gudmundsson et al., 2012) and multivariate bias correction (Cannon, 2016, 2018) for comparison (see Text S4).”
MethodHow Suitable is Quantile Mapping For Postprocessing GCM Precipitation Forecasts?
Zhao, T., Bennett, J. C., Wang, Q. J., Schepen, A., Wood, A. W., Robertson, D. E., & Ramos, M.-H. (2017) · Journal of Climate · doi:10.1175/jcli-d-16-0652.1 · Cited by 181
“…and can be implemented relatively easily: FX( ) and FO( ) can be derived parametrically by fitting a distribution to the data (Piani et al. 2010; Gudmundsson et al. 2012) or nonparametrically through an empirical distribution function, ‘‘lookup table,’’ or kernel density estimation (Wood et al.…”
BackgroundMethodInfluentialAdaptation of urban drainage networks to climate change: A review
Kourtis, I. M., & Tsihrintzis, V. A. (2021) · Science of The Total Environment · doi:10.1016/j.scitotenv.2021.145431 · Cited by 174
How does bias correction of regional climate model precipitation affect modelled runoff?
Teng, J., Potter, N. J., Chiew, F. H. S., Zhang, L., Wang, B., Vaze, J., & Evans, J. P. (2015) · Hydrology and Earth System Sciences · doi:10.5194/hess-19-711-2015 · Cited by 171
“In this study, this method served as the benchmark as LS has been identified in various studies as the least skilful bias correction method (Gudmundsson et al., 2012; Lafon, 2013; Chen et al., 2013; Teutschbein and Seibert, 2012).”
BackgroundMethodVormoor, K., Lawrence, D., Heistermann, M., & Bronstert, A. (2015) · Hydrology and Earth System Sciences · doi:10.5194/hess-19-913-2015 · Cited by 172
“For Øvrevatn and Junkerdalselv in the north, as well as for Atnasjø and Kråkfoss in central and south-eastern Norway, the SD quartiles indicate dominant POT events during spring/summer.”
MethodInfluentialDevkota, L. P., & Gyawali, D. R. (2015) · Journal of Hydrology: Regional Studies · doi:10.1016/j.ejrh.2015.06.023 · Cited by 173
Brunner, M. I., Björnsen Gurung, A., Zappa, M., Zekollari, H., Farinotti, D., & Stähli, M. (2019) · Science of The Total Environment · doi:10.1016/j.scitotenv.2019.02.169 · Cited by 168
Smitha, P. S., Narasimhan, B., Sudheer, K. P., & Annamalai, H. (2018) · Journal of Hydrology · doi:10.1016/j.jhydrol.2017.11.010 · Cited by 169
Construction of a high-resolution gridded rainfall dataset for Peru from 1981 to the present day
Aybar, C., Fernández, C., Huerta, A., Lavado, W., Vega, F., & Felipe-Obando, O. (2020) · Hydrological Sciences Journal · doi:10.1080/02626667.2019.1649411 · Cited by 129
“…serially complete time series, the quantile mapping bias correction (Qm), produced by matching the empirical cumulative distribution of the collocated grid cell (CHIRPM, see Section 2.3) to the available gauge data (Gudmundsson et al. 2012), is used to infill the remaining gaps of each raingauge.”
MethodInfluentialAli, S., Eum, H.-I., Cho, J., Dan, L., Khan, F., Dairaku, K., Shrestha, M. L., Hwang, S., Nasim, W., Khan, I. A., et al. (2019) · Atmospheric Research · doi:10.1016/j.atmosres.2019.02.009 · Cited by 161
Changes in Winter Warming Events in the Nordic Arctic Region
Vikhamar-Schuler, D., Isaksen, K., Haugen, J. E., Tømmervik, H., Luks, B., Schuler, T. V., & Bjerke, J. W. (2016) · Journal of Climate · doi:10.1175/jcli-d-15-0763.1 · Cited by 163
“Temperature and precipitation values were interpolated from the model grid to station locations and adjusted for each site, using a quantile-mapping procedure for each variable separately (Gudmundsson et al. 2012).”
MethodSelf-citationAnthropogenic climate change affects meteorological drought risk in Europe
Gudmundsson, L., & Seneviratne, S. I. (2016) · Environmental Research Letters · doi:10.1088/1748-9326/11/4/044005 · Cited by 155
“As there are model specific biases in simulated precipitation, the regional precipitation series where bias corrected to match the distribution of the E-OBS data using a power-law transformation (Gudmundsson et al 2012).”
MethodSelf-citationA nonstationary bias‐correction technique to remove bias in GCM simulations
Miao, C., Su, L., Sun, Q., & Duan, Q. (2016) · Journal of Geophysical Research Atmospheres · doi:10.1002/2015jd024159 · Cited by 170
Gudmundsson, L., Wagener, T., Tallaksen, L. M., & Engeland, K. (2012) · Water Resources Research · doi:10.1029/2011wr010911 · Cited by 168
“…are repeatedly reported for various variables of the terrestrial water cycle such as soil moisture [Guo et al., 2006, 2007], discharge from large river basins [Hagemann and Jacob, 2007; Materia et al., 2010] and continental scale summaries of annual low and high flows [Gudmundsson et al., 2012a].”
BackgroundSelf-citationNgai, S. T., Tangang, F., & Juneng, L. (2016) · Global and Planetary Change · doi:10.1016/j.gloplacha.2016.12.009 · Cited by 165
Yue, Y., Yan, D., Yue, Q., Ji, G., & Wang, Z. (2021) · Atmospheric Research · doi:10.1016/j.atmosres.2021.105828 · Cited by 160
Ayar, P. V., Vrac, M., Bastin, S., Carreau, J., Déqué, M., & Gallardo, C. (2015) · Climate Dynamics · doi:10.1007/s00382-015-2647-5 · Cited by 162
Lin, Q., Steger, S., Pittore, M., Zhang, J., Wang, L., Jiang, T., & Wang, Y. (2022) · The Science of The Total Environment · doi:10.1016/j.scitotenv.2022.158049 · Cited by 158
Meyer, J. L., Kohn, I., Stahl, K., Hakala, K., Seibert, J., & Cannon, A. J. (2019) · Hydrology and earth system sciences · doi:10.5194/hess-23-1339-2019 · Cited by 159
“For hydrological impact studies quantile mapping approaches, which correct for biases in the data’s entire distribution, have often been recommended (Teutschbein and Seibert, 2012; Gudmundsson et al., 2012; Chen et al., 2013).”
Heo, J., Ahn, H., Shin, J., Kjeldsen, T., & Jeong, C. (2019) · Water · doi:10.3390/w11071475 · Cited by 153
Does nonstationarity in rainfall require nonstationary intensity–duration–frequency curves?
Ganguli, P., & Coulibaly, P. (2017) · Hydrology and earth system sciences · doi:10.5194/hess-21-6461-2017 · Cited by 152
Belitz, K., & Stackelberg, P. E. (2021) · Environmental Modelling & Software · doi:10.1016/j.envsoft.2021.105006 · Cited by 149
Sachindra, D. A., Huang, F., Barton, A., & Perera, B. J. C. (2014) · International Journal of Climatology · doi:10.1002/joc.3915 · Cited by 148
Marcos-Garcia, P., Lopez‐Nicolas, A., & Pulido-Velázquez, M. (2017) · Journal of Hydrology · doi:10.1016/j.jhydrol.2017.09.028 · Cited by 141
Gutjahr, O., & Heinemann, G. (2013) · Theoretical and Applied Climatology · doi:10.1007/s00704-013-0834-z · Cited by 145
“Hereby, eQM did perform best, and the errors due to interpolation and due to the reduction of the calibration period were smallest, which was also found by Themeßl et al. (2012) and Gudmundsson et al. (2012).”
BackgroundMethodResultInfluentialBias correction of precipitation through Singularity Stochastic Removal: Because occurrences matter
Vrac, M., Noël, T., & Vautard, R. (2016) · Journal of Geophysical Research Atmospheres · doi:10.1002/2015jd024511 · Cited by 145
Estimating daily meteorological data and downscaling climate models over landscapes
Cáceres, M. D., Martin-StPaul, N. K., Turco, M., Cabon, A., & Granda, V. (2018) · Environmental Modelling & Software · doi:10.1016/j.envsoft.2018.08.003 · Cited by 125
Projecting meteorological, hydrological and agricultural droughts for the Yangtze River basin
Sun, F., Mejía, A., Zeng, P., & Che, Y. (2019) · The Science of The Total Environment · doi:10.1016/j.scitotenv.2019.134076 · Cited by 125
Bias correction of surface downwelling longwave and shortwave radiation for the EWEMBI dataset
Lange, S. (2018) · Earth System Dynamics · doi:10.5194/esd-9-627-2018 · Cited by 119
“Potentially, non-parametric quantile mapping methods (that do not rely on such assumptions) could yield better cross-validation results as long as overfitting is avoided (e.g., Gudmundsson et al., 2012).”
BackgroundMethodFuture shifts in extreme flow regimes in Alpine regions
Brunner, M. I., Farinotti, D., Zekollari, H., Huss, M., & Zappa, M. (2019) · Hydrology and earth system sciences · doi:10.5194/hess-23-4471-2019 · Cited by 129
“The scenarios are based on representative concentration pathways (RCPs) (Moss et al., 2010; Meinshausen et al., 2011; van Vuuren et al., 2011) and a regional downscaling approach based on quantile mapping (Themeßl et al., 2012; Gudmundsson et al., 2012).”
MethodLarge Projected Decline in Dissolved Oxygen in a Eutrophic Estuary Due to Climate Change
Ni, W., Li, M. H., Ross, A. C., & Najjar, R. G. (2019) · Journal of Geophysical Research Oceans · doi:10.1029/2019jc015274 · Cited by 129
“To correct the biases in the NARCCAP meteorological outputs, we applied the empirical quantile mapping method, using historical data from the North American Regional Reanalysis as the observational reference (Gudmundsson et al., 2012; Mesinger et al., 2006; Wood et al., 2004).”
MethodDeep Learning for Improving Numerical Weather Prediction of Heavy Rainfall
Hess, P., & Boers, N. (2022) · Journal of Advances in Modeling Earth Systems · doi:10.1029/2021ms002765 · Cited by 153
“Among them, quantile mapping (QM) has become particularly popular for weather and climate model applications (Cannon et al., 2015; Déqué, 2007; Gudmundsson et al., 2012; Tong et al., 2021), as it allows to correct for biases over the entire distribution.”
BackgroundATTRICI v1.1 – counterfactual climate for impact attribution
Mengel, M., Treu, S., Lange, S., & Frieler, K. (2021) · Geoscientific Model Development · doi:10.5194/gmd-14-5269-2021 · Cited by 119
Wang, L., & Chen, W. (2013) · Atmospheric Science Letters · doi:10.1002/asl2.454 · Cited by 123
“Consequently, the more effective approach to bias correction is a nonparametric method, which has been proved to be the best at reducing biases in regional climate models (RCMs) in Norway (Gudmundsson et al., 2012).”
MethodPerformance of bias-correction schemes for CMORPH rainfall estimates in the Zambezi River basin
Gumindoga, W., Rientjes, T. H. M., Haile, A. T., Makurira, H., & Reggiani, P. (2019) · Hydrology and earth system sciences · doi:10.5194/hess-23-2915-2019 · Cited by 117
Song, Y. H., Chung, ., & Shahid, S. (2022) · The Science of The Total Environment · doi:10.1016/j.scitotenv.2022.156162 · Cited by 122
Yang, X., Wood, E. F., Sheffield, J., Ren, L., Zhang, M., & Wang, Y. (2018) · Journal of Hydrometeorology · doi:10.1175/jhm-d-17-0180.1 · Cited by 113
Adeyeri, O. E., Lawin, A. E., Laux, P., Ishola, K. A., & Ige, S. O. (2019) · Weather and Climate Extremes · doi:10.1016/j.wace.2019.100194 · Cited by 117
Hanzer, F., Förster, K., Nemec, J., & Strasser, U. (2018) · Hydrology and earth system sciences · doi:10.5194/hess-22-1593-2018 · Cited by 115
Camici, S., Ciabatta, L., Massari, C., & Brocca, L. (2018) · Journal of Hydrology · doi:10.1016/j.jhydrol.2018.06.067 · Cited by 121
Ahmed, K., Shahid, S., Chung, ., Wang, X., & Harun, S. B. (2019) · Journal of Hydrology · doi:10.1016/j.jhydrol.2019.01.019 · Cited by 113
Evaluation of Past and Future Climate Trends under CMIP6 Scenarios for the UBNB (Abay), Ethiopia
Alaminie, A. A., Tilahun, S. A., Legesse, S. A., Zimale, F. A., Tarekegn, G. B., & Jury, M. R. (2021) · Water · doi:10.3390/w13152110 · Cited by 125
“Model PRECP RQUANT (NSE) QUANT (NSE) SSPLIN (NSE) RQUANT (MAE) QUANT (MAE) SSPLIN (MAE) BCC-CSM2-MR 0.756 0.755 0.734 40.402 40.464 41.168 CAMS-CSM1-0 0.603 0.599 0.600 26.400 26.521 26.469 CanESM5p1 0.758 0.758 0.754 39.235 39.332 39.514 CanESM5p2 0.735 0.731 0.728 41.812 42.017 42.183 CESM2 0.748 0.748 0.740 46.733…”
BackgroundMethodInfluentialAssessing the impact of climate-change scenarios on landslide occurrence in Umbria Region, Italy
Ciabatta, L., Camici, S., Brocca, L., Ponziani, F., Stelluti, M., Berni, N., & Moramarco, T. (2016) · Journal of Hydrology · doi:10.1016/j.jhydrol.2016.02.007 · Cited by 122
Gizaw, M. S., & Gan, T. Y. (2016) · Journal of Hydrology · doi:10.1016/j.jhydrol.2016.04.041 · Cited by 116
Camici, S., Brocca, L., Melone, F., & Moramarco, T. (2013) · Journal of Hydrologic Engineering · doi:10.1061/(asce)he.1943-5584.0000959 · Cited by 121
A Quantile Mapping Bias Correction Method Based on Hydroclimatic Classification of the Guiana Shield
Ringard, J., Seyler, F., & Linguet, L. (2017) · Sensors · doi:10.3390/s17061413 · Cited by 115
“There are several statistical transformations related to the QM method for modeling the quantile-quantile relationship [62].”
BackgroundMethodInfluentialSharma, A., & Goyal, M. K. (2019) · Atmospheric Research · doi:10.1016/j.atmosres.2019.104670 · Cited by 118
Extreme precipitation events under climate change in the Iberian Peninsula
Pereira, S. C., Marta‐Almeida, M., Carvalho, A. C., & Rocha, A. C. (2019) · International Journal of Climatology · doi:10.1002/joc.6269 · Cited by 117
“QM has been widely used for correcting daily precipitation results (Gudmundsson et al., 2012; Wilcke et al., 2013; Miao et al., 2016; Reiter et al., 2018), with the effect of BC on the projected climate change signal being less commonly investigated.”
BackgroundMethodInfluentialYira, Y., Diekkrüger, B., Steup, G., & Bossa, A. Y. (2017) · Hydrology and earth system sciences · doi:10.5194/hess-21-2143-2017 · Cited by 114
“A precipitation bias correction was therefore applied to the six RCMs–GCMs following the non-parametric quantile mapping using the empirical quantiles method (Gudmundsson et al., 2012).”
MethodMaraun, D., Widmann, M., & Gutiérrez, J. M. (2018) · International Journal of Climatology · doi:10.1002/joc.5877 · Cited by 103
Rajczak, J., Kotlarski, S., & Schär, C. (2016) · Journal of Climate · doi:10.1175/jcli-d-15-0162.1 · Cited by 102
Climate Change and Maize Yield in Iowa
Xu, H., Twine, T. E., & Girvetz, E. (2016) · PLOS ONE · doi:10.1371/journal.pone.0156083 · Cited by 100
“The bias correction was conducted using the R statistical program contributed package Qmap, which performs a quantile mapping using robust empirical quantiles [33].”
MethodCook, L. M., McGinnis, S., & Samaras, C. (2020) · Climatic Change · doi:10.1007/s10584-019-02649-6 · Cited by 113
An evaluation of statistical, NMME and hybrid models for drought prediction in China
Xu, L., Chen, N., Zhang, X., & Chen, Z. (2018) · Journal of Hydrology · doi:10.1016/j.jhydrol.2018.09.020 · Cited by 101
Advances in CMIP6 INM-CM5 over CMIP5 INM-CM4 for precipitation simulation in South Korea
Song, Y. H., Nashwan, M. S., Chung, ., & Shahid, S. (2020) · Atmospheric Research · doi:10.1016/j.atmosres.2020.105261 · Cited by 100
Future Increases in North American Extreme Precipitation in CMIP6 Downscaled with LOCA
Pierce, D. W., Cayan, D. R., Feldman, D., & Risser, M. D. (2023) · Journal of Hydrometeorology · doi:10.1175/jhm-d-22-0194.1 · Cited by 123
“…observed relationships between weather phenomena at large and small scales to translate coarse-resolution ESM fi elds into a more fi nely resolved representation (e.g., Wood et al. 2004; Fowler et al. 2007; Gudmundsson et al. 2012; Pierce et al. 2013b; Bukovsky et al. 2015; Jacob et al. 2020).”
BackgroundConsequences of rapid ice sheet melting on the Sahelian population vulnerability
Defrance, D., Ramstein, G., Charbit, S., Vrac, M., Famien, A. M., Sultan, B., Swingedouw, D., Dumas, C., Gemenne, F., Álvarez-Solas, J., et al. (2017) · Proceedings of the National Academy of Sciences · doi:10.1073/pnas.1619358114 · Cited by 112
Hess, P., Drüke, M., Petri, S., Strnad, F., & Boers, N. (2022) · Nature Machine Intelligence · doi:10.1038/s42256-022-00540-1 · Cited by 140
“Quantile mapping (QM), in particular, has become a popular method for improving the model output statistics of precipitation (D´equ´e, 2007; Tong et al., 2021; Gudmundsson et al., 2012; Cannon et al., 2015).”
MethodEum, H., & Cannon, A. J. (2016) · International Journal of Climatology · doi:10.1002/joc.4924 · Cited by 100
The critical role of uncertainty in projections of hydrological extremes
Meresa, H. K., & Romanowicz, R. J. (2017) · Hydrology and earth system sciences · doi:10.5194/hess-21-4245-2017 · Cited by 100
“Several studies have identified the need to check and correct bias, in the GCM/RCMs output, before its use in impact studies (Gudmundsson et al., 2012; Gutjahr and Heinemann, 2013; Teutschbein and Seibert, 2013; Teng et al., 2015).”
Agricultural conservation practices can help mitigate the impact of climate change
Wagena, M. B., & Easton, Z. M. (2018) · The Science of The Total Environment · doi:10.1016/j.scitotenv.2018.04.110 · Cited by 106
Muelchi, R., Rößler, O., Schwanbeck, J., Weingartner, R., & Martius, O. (2021) · Hydrology and earth system sciences · doi:10.5194/hess-25-3071-2021 · Cited by 105
“More sophisticated downscaling approaches have been developed, such as quantile mapping (Teutschbein and Seibert, 2012; Gudmundsson et al., 2012).”
BackgroundMethodAlamdari, N., Sample, D. J., Steinberg, P. D., Ross, A. C., & Easton, Z. M. (2017) · Water · doi:10.3390/w9070464 · Cited by 105
“[17] compared distribution derived, parametric, and nonparametric transformation methods for correcting bias of RCM outputs.”
MethodDing, Y., Wang, W., Song, R., Shao, Q., Jiao, X., & Xing, W. (2017) · Agricultural Water Management · doi:10.1016/j.agwat.2017.08.008 · Cited by 95
de Hipt, F. O., Diekkrüger, B., Steup, G., Yira, Y., Hoffmann, T., Rode, M., & Näschen, K. (2018) · The Science of The Total Environment · doi:10.1016/j.scitotenv.2018.10.351 · Cited by 109
Song, Z., Xia, J., She, D., Li, L., Hu, C., & Hong, S. (2021) · Journal of Hydrology · doi:10.1016/j.jhydrol.2021.126643 · Cited by 96
Heat index trends and climate change implications for occupational heat exposure in Da Nang, Vietnam
Opitz-Stapleton, S., Sabbag, L., Hawley, K., Tran, P., Hoang, L., & Nguyen, P. H. (2016) · Climate Services · doi:10.1016/j.cliser.2016.08.001 · Cited by 109
Alamgir, M., Khan, N., Shahid, S., Yaseen, Z. M., Dewan, A. M., Hassan, Q. K., & Rasheed, B. (2020) · Stochastic Environmental Research and Risk Assessment · doi:10.1007/s00477-020-01768-2 · Cited by 96
“Gudmundsson et al. (2012) formulated QM for correction of the bias present in GCM with the following equation: Po ¼ F 1o Fm Pmð Þ ð4Þ where Po represents bias corrected rainfall, Pm is GCM simulated rainfall, F 1o is the inverse CDF of observed rainfall and Fm is the CDF of GCM rainfall.”
BackgroundAn evaluation framework for downscaling and bias correction in climate change impact studies
Vogel, E., Johnson, F. M., Marshall, L. A., Bende‐Michl, U., Wilson, L., Peter, J., Wasko, C., Srikanthan, S., Sharples, W., Dowdy, A. J., et al. (2023) · Journal of Hydrology · doi:10.1016/j.jhydrol.2023.129693 · Cited by 91
Hydro-Meteorological Drought Projections into the 21-st Century for Selected Polish Catchments
Meresa, H. K., Osuch, M., & Romanowicz, R. J. (2016) · Water · doi:10.3390/w8050206 · Cited by 97
“In this study, the Quantile Mapping (QM) method [40–42] was applied for each catchment to correct the simulated precipitation and air temperature time series.”
MethodAssessment of rainfall bias correction techniques for improved hydrological simulation
Ghimire, U., Srinivasan, G., & Agarwal, A. (2018) · International Journal of Climatology · doi:10.1002/joc.5959 · Cited by 97
“These techniques have been discussed in (Gudmundsson et al., 2012).”
MethodInfluentialBucak, T., Trolle, D., Andersen, H. E., Thodsen, H., Erdoğan, Ş., Levi, E. E., Filiz, N., Jeppesen, E., & Beklioğlu, M. (2017) · The Science of The Total Environment · doi:10.1016/j.scitotenv.2016.12.149 · Cited by 108
Hydrological response of Chamelia watershed in Mahakali Basin to climate change
Pandey, V. P., Dhaubanjar, S., Bharati, L., & Thapa, B. R. (2018) · The Science of The Total Environment · doi:10.1016/j.scitotenv.2018.09.053 · Cited by 93
Holthuijzen, M., Beckage, B., Clemins, P. J., Higdon, D., & Winter, J. M. (2022) · Theoretical and Applied Climatology · doi:10.1007/s00704-022-04035-2 · Cited by 103
“The Gamma distribution is often used to model wet-day precipitation (e.g., (Lafon et al. 2013; Gudmundsson et al. 2012; Luo et al. 2018)) but is generally not adequate for modeling extreme precipitation tails (Heo et al. 2019; Gutjahr and Heinemann 2013).”
BackgroundMethodInfluentialBottino, M. J., Nobre, P., Giarolla, E., da Silva, M. B., Capistrano, V., Malagutti, M., Tamaoki, J. N., de Oliveira, B. F. A., & Nobre, C. A. (2024) · Scientific Reports · doi:10.1038/s41598-024-55176-5 · Cited by 117
Methods and Model Dependency of Extreme Event Attribution: The 2015 European Drought
Hauser, M., Gudmundsson, L., Orth, R., Jézéquel, A., Haustein, K., Vautard, R., van Oldenborgh, G. J., Wilcox, L., & Seneviratne, S. I. (2017) · Earth's Future · doi:10.1002/2017ef000612 · Cited by 88
“All area-averaged data (models and observations) are then bias-corrected using a power transformation (Gudmundsson et al., 2012) to best match the cumulative density function of the E-OBS dataset for the period 1965–2013 (1985–2013 for the w@h simulations and 1971–2013 for the RCM simulations).”
MethodSelf-citationTefera, G. W., Teferi, E., Bantider, A., & Dile, Y. T. (2019) · Theoretical and Applied Climatology · doi:10.1007/s00704-019-03053-x · Cited by 89
“Distribution mapping uses the Gamma distribution (Gudmundsson et al. 2012) and the Gaussian distributions (Cramér 1999) to fit distribution of rainfall and temperature of RCMs with observational data.”
BackgroundMethodInfluentialSong, Y. H., Chung, ., & Shahid, S. (2021) · International Journal of Climatology · doi:10.1002/joc.7159 · Cited by 98
“It fits a cubic smoothing spline to the quantile–quantile (Q–Q) plot of observed and modelled time series (Koenker and Schorfheide, 1994; Gudmundsson et al., 2012), as formulated below:”
Background
Metadata
- Authors
- Gudmundsson, L., Bremnes, J. B., Haugen, J. E., & Engen-Skaugen, T.
- Affiliations
- Norwegian Meteorological Institute (NO)
- Venue
- Hydrology and Earth System Sciences
- Publisher
- Copernicus GmbH
- Published
- 2012-09-21
- Volume
- 16
- Issue
- 9
- Pages
- 3383-3390
- ISSN
- 1027-5606 (ISSN-L)
- 1607-7938
- OpenAlex
- W2166535858
- Cited by
- 1,318
- References
- 41
- Citations by year
- 2026: 132 · 2025: 134 · 2024: 124 · 2023: 136 · 2022: 137 · 2021: 172 · 2020: 116 · 2019: 85 · 2018: 76 · 2017: 68 · 2016: 63 · 2015: 35 · 2014: 20 · 2013: 17 · 2012: 3
- FWCI
- 20.14
- Type
- journal article
- Language
- en
- Open access
- gold
- doi.org
- Licence
- Locations
- Hydrology and earth system sciences (publishedVersion, cc-by)
- DOAJ (DOAJ: Directory of Open Access Journals) (submittedVersion)
- Repository for Publications and Research Data (ETH Zurich) (submittedVersion, cc-by)
- ETH Zürich Research Collection (cc-by)
- Topics
- Physical Sciences › Environmental Science › Global and Planetary Change › Climate variability and models
- Physical Sciences › Earth and Planetary Sciences › Atmospheric Science › Precipitation Measurement and Analysis
- Physical Sciences › Environmental Science › Water Science and Technology › Hydrology and Watershed Management Studies
- Keywords
- dynamical downscaling, precipitation bias correction, statistical post-processing, parametric transformation, climate change impacts on water resources
About these checks
Registry, retraction, Cites and statistics results are computed, not judged, with one exception: a printed reference that no index lists is read once by a model before it counts as a citation error. Claims are extracted by a model and kept only when their quote appears verbatim in the text; each cited source is then checked, with a model’s help, for whether it says what the claim relies on. Those verdicts can be wrong — read the claim’s quote and the cited source before relying on one.
Statistics and arithmetic are recomputed, not judged.
Confidence bands are shown only for fields calibrated on our annotated test set. None is calibrated yet, so no band is shown.
What counts as a claim ›How we measure confidence ›How we check this ›
Are you an author, or do you see a problem with this page? Request a review
Data sources
Bibliographic data: Semantic Scholar, OpenAlex, Crossref.
Contains information from the Semantic Scholar Academic Graph Datasets, made available under the ODC Attribution License (ODC-BY 1.0).
Semantic Scholar’s data is described in: Kinney, R., et al. (2023). The Semantic Scholar Open Data Platform. arXiv:2301.10140.
