

Parsimonious statistical learning models for low flow estimation
Open accessPreprint — published as 10.5194/hess-26-129-2022
The DOI matches its Crossref record; 75 of the 75 references it cites were found in a registry or an index.
Abstract
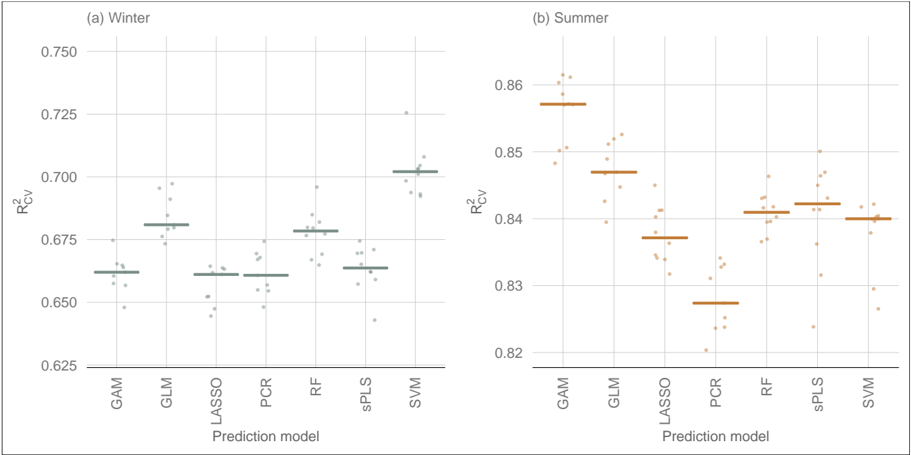
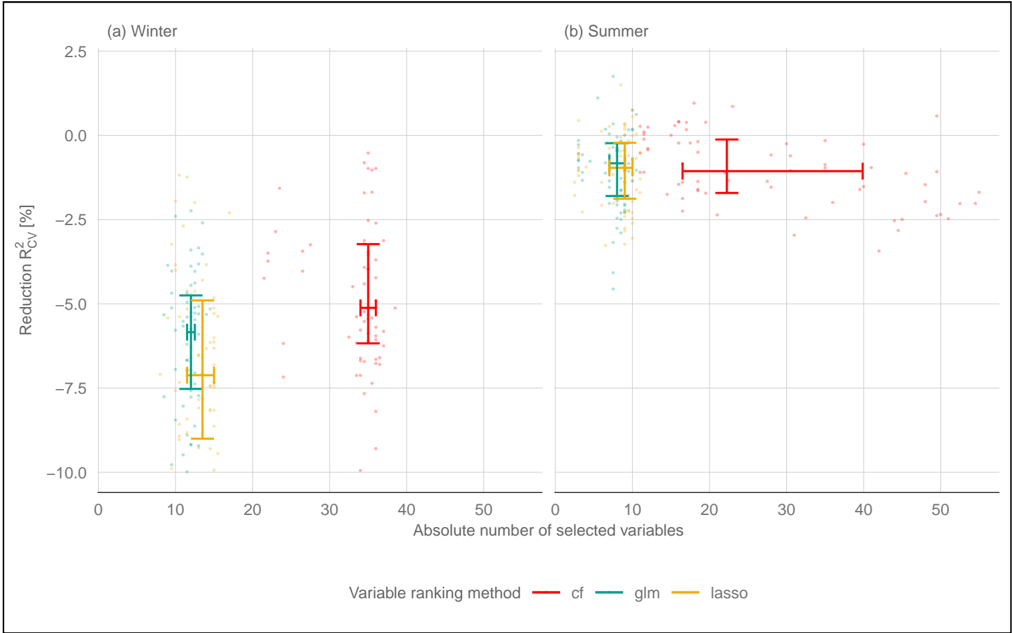
Statistical learning methods offer a promising approach for low flow regionalization. We examine seven statistical learning models (lasso, linear and non-linear model based boosting, sparse partial least squares, principal component regression, random forest, and support vector machine regression) for the prediction of winter and summer low flow based on a hydrological diverse dataset of 260 catchments in Austria. In order to produce sparse models we adapt the recursive feature elimination for variable preselection and propose to use three different variable ranking methods (conditional forest, lasso and linear model based boosting) for each of the prediction models. Results are evaluated for the low flow characteristic Q95 (Pr(Q>Q95) = 0.95) standardized by catchment area using a repeated nested cross validation scheme. We found a generally high prediction accuracy for winter (R2CV of 0.66 to 0.7) and summer (R2CV of 0.83 to 0.86). The models perform similar or slightly better than a Top-kriging model that constitutes the current benchmark for the study area. The best performing models are support vector machine regression (winter) and non-linear model based boosting (summer), but linear models exhibit similar prediction accuracy. The use of variable preselection can significantly reduce the complexity of all models with only a small loss of performance. The so obtained learning models are more parsimonious, thus easier to interpret and more robust when predicting at ungauged sites. A direct comparison of linear and non-linear models reveals that non-linear relationships can be sufficiently captured by linear learning models, so there is no need to use more complex models or to add non-liner effects. When performing low flow regionalization in a seasonal climate, the temporal stratification into summer and winter low flows was shown to increase the predictive performance of all learning models, offering an alternative to catchment grouping that is recommended otherwise.
Overview
The claims and statistics of this paper haven’t been checked yet.
Free: it reads the open-access text and checks the first 5 claims that cite a source we can check. Create a free account to check every claim.
Integrity signals
Registry
Cites
Statistics
Figures
Verification
Claims the paper makes
The claims and statistics of this paper haven’t been checked yet.
Free: it reads the open-access text and checks the first 5 claims that cite a source we can check. Create a free account to check every claim.
Self-check
Percentages, sums and reported differences re-computed from the paper’s own numbers.
The self-check needs the paper’s full text.
Citations
Cites
Breiman, L. (2001) · Machine Learning · doi:10.1023/a:1010933404324 · Cited by 133,538 · cited 1×
“RF is a bagging (bootstrap aggregating) method originally developed by Breiman (2001).”
MethodRegression shrinkage and selection via the lasso
Tibshirani, R. (1996) · Journal of the Royal Statistical Society Series B: Statistical Methodology · doi:10.1111/j.2517-6161.1996.tb02080.x · Cited by 51,482 · cited 1×
“Lasso was originally introduced by Tibshirani (1996), where the regression coefficients β lasso can be defined as follows: β lasso = argminβ{1/2 N∑ i=1 (yi −β0− p∑ j=1 xijβj ) + λ p∑ j=1 |βj |}, (1) with β0 as the intercept and βj as the regression coefficients.”
The Elements of Statistical Learning
Hastie, T., Tibshirani, R., & Friedman, J. (2009) · Springer Series in Statistics · doi:10.1007/978-0-387-84858-7 · Cited by 25,970
Regularization Paths for Generalized Linear Models via Coordinate Descent
Friedman, J., Hastie, T., & Tibshirani, R. (2010) · Journal of Statistical Software · doi:10.18637/jss.v033.i01 · Cited by 19,927 · cited 3×
“The Lasso approach can handle high correlated data, coefficients can be shrunk to zero, and correlated variables do not enter the final model (Friedman et al., 2010).”
BackgroundMethodThe Nature of Statistical Learning Theory
Vapnik, V. N. (2000) · Springer eBooks · doi:10.1007/978-1-4757-3264-1 · Cited by 10,696 · cited 1×
“(7) V can be any loss function, but in the initial idea of Vapnik (2000), it is defined by a threshold r .”
BackgroundGene selection for cancer classification using support vector machines
Guyon, I., Weston, J., Barnhill, S., & Vapnik, V. (2002) · Machine Learning · doi:10.1023/a:1012487302797 · Cited by 9,954
Geurts, P., Ernst, D., & Wehenkel, L. (2006) · Machine Learning · doi:10.1007/s10994-006-6226-1 · Cited by 9,300 · cited 1×
“We used the estimated response variance as a splitting criterion because rank-based approaches or the use of extremely randomized trees (Geurts et al., 2006) did not improve prediction accuracy.”
MethodWrappers for feature subset selection
Kohavi, R., & John, G. H. (1997) · Artificial Intelligence · doi:10.1016/s0004-3702(97)00043-x · Cited by 8,947 · cited 2×
“, Lasso, boosting models, or treebased methods; (ii) filter-based methods (Guyon and Elisseeff, 2003), which include correlation-based variable selection or univariate regression filters; finally, (iii) wrapper-based methods (Kohavi and John, 1997) such as recursive feature elimination (RFE) (Guyon et al.”
MethodAn introduction to variable and feature selection
GuyonIsabelle, & ElisseeffAndré (2003) · Journal of Machine Learning Research · doi:10.5555/944919.944968 · Cited by 7,715
Unbiased Recursive Partitioning: A Conditional Inference Framework
Hothorn, T., Hornik, K., & Zeileis, A. (2006) · Journal of Computational and Graphical Statistics · doi:10.1198/106186006x133933 · Cited by 4,021 · cited 2×
“– The third method (cfrank) uses conditional forests (Hothorn et al., 2006; Strobl et al., 2007, 2009) for variable ranking, where the standardized coefficients are a sum of the main and interaction effects for each variable.”
MethodBias in random forest variable importance measures: Illustrations, sources and a solution
Strobl, C., Boulesteix, A.-L., Zeileis, A., & Hothorn, T. (2007) · BMC Bioinformatics · doi:10.1186/1471-2105-8-25 · Cited by 3,688
ranger: A Fast Implementation of Random Forests for High Dimensional Data in C++ and R
Wright, M. N., & Ziegler, A. (2017) · Journal of Statistical Software · doi:10.18637/jss.v077.i01 · Cited by 3,340 · cited 2×
“There are several packages in R that can estimate RF models, but due to the computational burden of the study we used the fast ranger package (Wright and Ziegler, 2017).”
MethodInfluentialStrobl, C., Malley, J., & Tutz, G. (2009) · Psychological Methods · doi:10.1037/a0016973 · Cited by 2,583 · cited 1×
“The third method (cfrank) uses conditional forests (Hothorn et al., 2006; Strobl et al., 2007, 2009) for variable ranking, where the standardized coefficients are a sum of the main and interaction effects for each variable.”
MethodRegularization Paths for Cox's Proportional Hazards Model via Coordinate Descent
Simon, N., Friedman, J., Hastie, T., & Tibshirani, R. (2011) · Journal of Statistical Software · doi:10.18637/jss.v039.i05 · Cited by 2,499 · cited 2×
“We use the glmnet package in R for computation (Simon et al., 2011), where the coefficients are estimated by cyclical coordinate descent (Friedman et al., 2010).”
MethodMeinshausen, N., & Bühlmann, P. (2010) · Journal of the Royal Statistical Society Series B: Statistical Methodology · doi:10.1111/j.1467-9868.2010.00740.x · Cited by 2,215 · cited 2×
“However, these approaches can be misleading when variables in boosting models are falsely selected (Meinshausen and Bühlmann, 2010; Hofner et al., 2015) or variables in RF are ranked mistakenly high (Strobl et al.”
BackgroundSIMPLS: An alternative approach to partial least squares regression
de Jong, S. (1993) · Chemometrics and Intelligent Laboratory Systems · doi:10.1016/0169-7439(93)85002-x · Cited by 1,905 · cited 1×
“This process is repeated until M PLS components are extracted (de Jong, 1993).”
caret: Classification and Regression Training
Kuhn, M. (2007) · CRAN: Contributed Packages · doi:10.32614/cran.package.caret · Cited by 1,786
Smakhtin, V. U. (2001) · Journal of Hydrology · doi:10.1016/s0022-1694(00)00340-1 · Cited by 1,702 · cited 2×
“Estimating long-term averages of low flow in ungauged basins is crucial for a wide range of applications, e.g., water resource management and engineering, hydropower planning, or ecological issues (Smakhtin, 2001).”
BackgroundSelection bias in gene extraction on the basis of microarray gene-expression data
Ambroise, C., & McLachlan, G. J. (2002) · Proceedings of the National Academy of Sciences · doi:10.1073/pnas.102102699 · Cited by 1,480 · cited 4×
“As one aim of this study is to get unbiased predictions (Solomatine and Ostfeld, 2008; Ambroise and McLachlan, 2002), we employ a nested CV scheme (referred to as double CV in Varmuza and Filzmoser (2016)).”
BackgroundMethodInfluentialIntroduction to Multivariate Statistical Analysis in Chemometrics
Varmuza, K., & Filzmoser, P. (2016) · CRC Press eBooks · doi:10.1201/9781420059496 · Cited by 1,228 · cited 1×
“(10) As one aim of this study is to get unbiased predictions (Solomatine and Ostfeld, 2008; Ambroise and McLachlan, 2002), we employ a nested CV scheme (referred to as double CV in Varmuza and Filzmoser, 2016).”
BackgroundKratzert, F., Klotz, D., Shalev, G., Klambauer, G., Hochreiter, S., & Nearing, G. (2019) · Hydrology and Earth System Sciences · doi:10.5194/hess-23-5089-2019 · Cited by 1,223 · cited 1×
“The applications include rainfall–runoff modeling by neural networks (e.g., Kratzert et al., 2019a, b), using support vector machines (SVM) for prediction of karst tracers (Mewes et al., 2020) or reference evapotranspiration (Tabari et al., 2012) and random forest for flood event classification…”
MethodToward Improved Predictions in Ungauged Basins: Exploiting the Power of Machine Learning
Kratzert, F., Klotz, D., Herrnegger, M., Sampson, A. K., Hochreiter, S., & Nearing, G. S. (2019) · Water Resources Research · doi:10.1029/2019wr026065 · Cited by 990 · cited 1×
“The applications include rainfall–runoff modeling by neural networks (e.g., Kratzert et al., 2019a, b), using support vector machines (SVM) for prediction of karst tracers (Mewes et al., 2020) or reference evapotranspiration (Tabari et al., 2012) and random forest for flood event classification…”
MethodSparse Partial Least Squares Regression for Simultaneous Dimension Reduction and Variable Selection
Chun, H., & Keleş, S. (2010) · Journal of the Royal Statistical Society Series B: Statistical Methodology · doi:10.1111/j.1467-9868.2009.00723.x · Cited by 908
Hydrological modelling using artificial neural networks
Dawson, C. W., & Wilby, R. L. (2001) · Progress in Physical Geography: Earth and Environment · doi:10.1177/030913330102500104 · Cited by 903 · cited 2×
“Regression methods cover a wide spectrum of models and especially in the last decade there was gaining interest in statistical learning models in hydrology (Abrahart et al., 2012; Dawson and Wilby, 2001; Nearing et al., 2021; Solomatine and Ostfeld, 2008), with the 25 terms statistical learning and machine learning be…”
BackgroundMethodWhat Role Does Hydrological Science Play in the Age of Machine Learning?
Nearing, G. S., Kratzert, F., Sampson, A. K., Pelissier, C. S., Klotz, D., Frame, J. M., Prieto, C., & Gupta, H. V. (2021) · Water Resources Research · doi:10.1029/2020wr028091 · Cited by 894
Support vector machine applications in the field of hydrology: A review
Raghavendra. N, S., & Deka, P. C. (2014) · Applied Soft Computing · doi:10.1016/j.asoc.2014.02.002 · Cited by 780
Tyralis, H., Papacharalampous, G., & Langousis, A. (2019) · Water · doi:10.3390/w11050910 · Cited by 771 · cited 4×
“Finally, we use two models that are popular in hydrology: (vi) RF, (Tyralis et al., 2019) and (vii) SVR (Sujay Raghavendra and Deka, 2014).”
MethodInfluentialBoosting Algorithms: Regularization, Prediction and Model Fitting
Bühlmann, P., & Hothorn, T. (2007) · Statistical Science · doi:10.1214/07-sts242 · Cited by 726 · cited 1×
“The boosting algorithm is an iterative process, with the following steps (Bühlmann and Hothorn, 2007; Mayr and Hofner, 2018; Melcher et al., 2017).”
MethodData-driven modelling: some past experiences and new approaches
Solomatine, D. P., & Ostfeld, A. (2008) · Journal of Hydroinformatics · doi:10.2166/hydro.2008.015 · Cited by 723 · cited 4×
“(10) As one aim of this study is to get unbiased predictions (Solomatine and Ostfeld, 2008; Ambroise and McLachlan, 2002), we employ a nested CV scheme (referred to as double CV in Varmuza and Filzmoser, 2016).”
BackgroundMethodInfluentialRecursive feature elimination with random forest for PTR-MS analysis of agroindustrial products
Granitto, P. M., Furlanello, C., Biasioli, F., & Gasperi, F. (2006) · Chemometrics and Intelligent Laboratory Systems · doi:10.1016/j.chemolab.2006.01.007 · Cited by 663 · cited 2×
“RFE is a prospective method that initially ranks the predictor variables after some measurements of importance, and the least important variables are removed in a backward procedure (Granitto et al., 2006).”
MethodDefining and Using Reference Evapotranspiration
Hargreaves, G. H. (1994) · Journal of Irrigation and Drainage Engineering · doi:10.1061/(asce)0733-9437(1994)120:6(1132 · Cited by 601
Feature Engineering and Selection: A Practical Approach for Predictive Models
Kuhn, M., & Johnson, K. (2019) · doi:10.1201/9781315108230 · Cited by 523
Runoff Prediction in Ungauged Basins: Synthesis Across Processes, Places and Scales
Luce, C. (2014) · Eos · doi:10.1002/2014eo020025 · Cited by 405 · cited 2×
“In a comparative assessment of low-flow studies based on the PUB assessment report (Blöschl et al., 2013), Salinas et al. (2013) showed that prediction accuracy is not only a function of model selection, but also of the specific setting of the study area.”
BackgroundPENALIZED STRUCTURED ADDITIVE REGRESSION FOR SPACE-TIME DATA: A BAYESIAN PERSPECTIVE
Fahrmeir, L., Kneib, T., & Lang, S. (2004) · GoeScholar The Publication Server of the Georg-August-Universität Göttingen (Georg-August-Universität Göttingen) · Cited by 403
Tabari, H., Kisi, O., Ezani, A., & Hosseinzadeh Talaee, P. (2012) · Journal of Hydrology · doi:10.1016/j.jhydrol.2012.04.007 · Cited by 311 · cited 2×
“, 2020) or reference evapotranspiration (Tabari et al., 2012) and random forest for flood event classification (Oppel and Mewes, 2020).”
BackgroundMethodButcher, B., & Smith, B. J. (2020) · The American Statistician · doi:10.1080/00031305.2020.1790217 · Cited by 305 · cited 5×
“…Elisseeff, 2003), which include correlation-based variable selection or univariate regression filters; finally, (iii) wrapper-based methods (Kohavi and John, 1997) such as recursive feature elimination (RFE) (Guyon et al., 2002; Granitto et al., 2006) or genetic algorithms (Kuhn and Johnson, 2019).”
BackgroundMethodInfluentialAbrahart, R. J., Anctil, F., Coulibaly, P., Dawson, C. W., Mount, N. J., See, L. M., Shamseldin, A. Y., Solomatine, D. P., Toth, E., & Wilby, R. L. (2012) · Progress in Physical Geography: Earth and Environment · doi:10.1177/0309133312444943 · Cited by 296 · cited 2×
“Regression methods cover a wide spectrum of models and especially in the last decade there was gaining interest in statistical learning models in hydrology (Abrahart et al., 2012; Dawson and Wilby, 2001; Nearing et al., 2021; Solomatine and Ostfeld, 2008).”
BackgroundModel-based boosting in R: a hands-on tutorial using the R package mboost
Hofner, B., Mayr, A., Robinzonov, N., & Schmid, M. (2014) · Computational Statistics · doi:10.1007/s00180-012-0382-5 · Cited by 258 · cited 1×
“, linear, nonlinear, spatial, or random effects (Hofner et al., 2014).”
A framework to assess the realism of model structures using hydrological signatures
Euser, T., Winsemius, H., Hrachowitz, M., et al. (2012) · doi:10.5194/hess-17-1893-2013 · Cited by 256 · cited 1×
“The two main approaches for predicting low-flow indices are based on either physically based models (e.g., Euser et al., 2013) or statistical models.”
MethodHaslinger, K., Koffler, D., Schöner, W., & Laaha, G. (2014) · Water Resources Research · doi:10.1002/2013wr015051 · Cited by 243
Self-citationTop-kriging - geostatistics on stream networks
Skøien, J. O., Merz, R., & Blöschl, G. (2006) · Hydrology and Earth System Sciences · doi:10.5194/hess-10-277-2006 · Cited by 215 · cited 1×
“Top kriging (TK, Skøien et al., 2006) is a geostatistical method that uses stream-network distance for low-flow prediction and was shown to be more adequate than ordinary kriging approaches.”
MethodThe Elements of Statistical Learning
Ziegel, E. R. (2003) · Technometrics · doi:10.1198/tech.2003.s770 · Cited by 199 · cited 4×
“The final regression coefficients of the principal components (zm) can be defined by Hastie et al. (2009) βpcr(M)= M∑ m=1 θmνm, (2) where θm is θm = Cov(zm,y)/Var(zm).”
BackgroundMethodInfluentialPrediction, Estimation, and Attribution
Efron, B. (2020) · Journal of the American Statistical Association · doi:10.1080/01621459.2020.1762613 · Cited by 197 · cited 1×
“This leads to a major criticism of statistical learning models, as they are often inferred as “black box” models (Efron, 2020; See et al., 2007), meaning that prediction accuracy and process understanding cannot be reached at the same time (Kuhn and Johnson, 2019).”
BackgroundA comparison of low flow regionalisation methods—catchment grouping
Laaha, G., & Blöschl, G. (2006) · Journal of Hydrology · doi:10.1016/j.jhydrol.2005.09.001 · Cited by 188 · cited 4×
“Statistical low-flow models can be further subdivided into geostatistical models (e.g., Castiglioni et al., 2009, 2011; Laaha et al., 2014) and regression-based methods (e.g., Laaha and Blöschl, 2006, 2007); an overview is given by Salinas et al. (2013).”
MethodInfluentialSelf-citationProcess-based snowmelt modeling: does it require more input data than temperature-index modeling?
Todd Walter, M., Brooks, E. S., McCool, D. K., King, L. G., Molnau, M., & Boll, J. (2005) · Journal of Hydrology · doi:10.1016/j.jhydrol.2004.05.002 · Cited by 187
Controlling false discoveries in high-dimensional situations: boosting with stability selection
Hofner, B., Boccuto, L., & Göker, M. (2015) · BMC Bioinformatics · doi:10.1186/s12859-015-0575-3 · Cited by 170 · cited 2×
“However, these approaches can be misleading when variables in boosting models are falsely selected (Meinshausen and Bühlmann, 2010; Hofner et al., 2015) or variables in RF are ranked mistakenly high (Strobl et al.”
BackgroundHiebl, J., & Frei, C. (2018) · Theoretical and Applied Climatology · doi:10.1007/s00704-017-2093-x · Cited by 170 · cited 1×
“The calculation of the climate characteristics is based on the SPARTACUS dataset for daily precipitation (Hiebl and Frei, 2018) and daily minimum and maximum temperature (Hiebl and Frei, 2016).”
MethodKroll, C. N., & Song, P. (2013) · Water Resources Research · doi:10.1002/wrcr.20315 · Cited by 164 · cited 6×
“Apart from stepwise regression procedures (e.g., Laaha and Blöschl, 2007; Kroll and Song, 2013), Tyralis et al. (2021) tested the inherent variable selection of the boosting algorithm and found the number of selected variables to depend on the runoff characteristics to be predicted.”
BackgroundMethodInfluentialPredicting Runoff Signatures Using Regression and Hydrological Modeling Approaches
Zhang, Y., Chiew, F. H. S., Li, M., & Post, D. (2018) · Water Resources Research · doi:10.1029/2018wr023325 · Cited by 164
Daily temperature grids for Austria since 1961—concept, creation and applicability
Hiebl, J., & Frei, C. (2015) · Theoretical and Applied Climatology · doi:10.1007/s00704-015-1411-4 · Cited by 155 · cited 1×
“The calculation of the climate characteristics is based on the SPARTACUS dataset for daily precipitation (Hiebl and Frei, 2018) and daily minimum and maximum temperature (Hiebl and Frei, 2016).”
MethodBoosting additive models using component-wise P-Splines
Schmid, M. C., & Hothorn, T. (2008) · Computational Statistics & Data Analysis · doi:10.1016/j.csda.2008.09.009 · Cited by 144 · cited 1×
“Nonlinear effects are modeled as P splines (Schmid and Hothorn, 2008), which are decomposed into an unpenalized linear base learner and a penalized nonlinear base learner, each with 1 degree of freedom.”
BackgroundVariable Selection and Model Choice in Geoadditive Regression Models
Kneib, T., Hothorn, T., & Tutz, G. (2008) · Biometrics · doi:10.1111/j.1541-0420.2008.01112.x · Cited by 142
Comparative assessment of predictions in ungauged basins – Part 2: Flood and low flow studies
Salinas, J., Laaha, G., Rogger, M., et al. (2013) · doi:10.5194/hess-17-2637-2013 · Cited by 141 · cited 9×
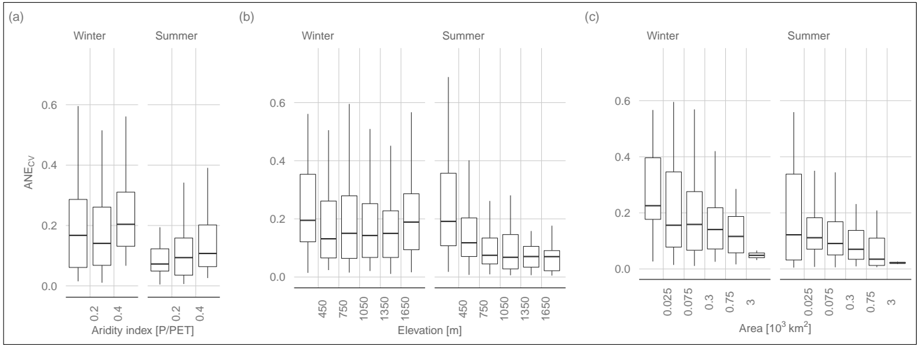
“5 of Salinas et al. (2013), shows the ANECV as a function of the aridity index, the catchment area and the catchment altitude.”
BackgroundMethodResultInfluentialSelf-citationImproving predictions of hydrological low-flow indices in ungaged basins using machine learning
Worland, S. C., Farmer, W. H., & Kiang, J. E. (2018) · Environmental Modelling & Software · doi:10.1016/j.envsoft.2017.12.021 · Cited by 125 · cited 13×
“Worland et al. (2018) and Ferreira et al. (2021) assessed their prediction models for low-flow characteristics such as Q95 and a quite similar characteristic 7Q10, but these were not standardized by catchment area as in our study.”
BackgroundMethodInfluentialConstruction of a 10‐min‐gridded precipitation data set for the Greater Alpine Region for 1800–2003
Efthymiadis, D. A., Jones, P. D., Briffa, K. R., Auer, I., Böhm, R., Schöner, W., Frei, C., & Schmidli, J. (2006) · Journal of Geophysical Research Atmospheres · doi:10.1029/2005jd006120 · Cited by 111
Low flow estimates from short stream flow records—a comparison of methods
Laaha, G., & Blöschl, G. (2004) · Journal of Hydrology · doi:10.1016/j.jhydrol.2004.09.012 · Cited by 99 · cited 1×
“The catchment characteristics used in this study are fully described in, e.g., Laaha and Blöschl (2005, 2006).”
MethodSelf-citationMachine learning models for streamflow regionalization in a tropical watershed
Ferreira, R. G., da Silva, D. D., Elesbon, A. A. A., Filho, E. I. F., Veloso, G. V., Fraga, M. D. S., & Ferreira, L. B. (2020) · Journal of Environmental Management · doi:10.1016/j.jenvman.2020.111713 · Cited by 99 · cited 10×
“Worland et al. (2018) and Ferreira et al. (2021) assessed their prediction models for low-flow characteristics such as Q95 and a quite similar characteristic 7Q10, but these were not standardized by catchment area as in our study.”
BackgroundMethodInfluentialSpatial prediction on river networks: comparison of top-kriging with regional regression
Laaha, G., Skøien, J. O., & Blöschl, G. (2012) · Hydrological Processes · doi:10.1002/hyp.9578 · Cited by 91 · cited 1×
“Statistical low-flow models can be further subdivided into geostatistical models (e.g., Castiglioni et al., 2009, 2011; Laaha et al., 2014) and regression-based methods (e.”
BackgroundSelf-citationCastiglioni, S., Castellarin, A., Montanari, A., Skøien, J. O., Laaha, G., & Blöschl, G. (2011) · Hydrology and earth system sciences · doi:10.5194/hess-15-715-2011 · Cited by 87 · cited 1×
“Statistical low-flow models can be further subdivided into geostatistical models (e.g., Castiglioni et al., 2009, 2011; Laaha et al., 2014) and regression-based methods (e.g., Laaha and Blöschl, 2006, 2007); an overview is given by Salinas et al. (2013).”
MethodSelf-citationA national low flow estimation procedure for Austria
Laaha, G., & Blöschl, G. (2007) · Hydrological Sciences Journal · doi:10.1623/hysj.52.4.625 · Cited by 85 · cited 2×
“Statistical low-flow models can be further subdivided into geostatistical models (e.g., Castiglioni et al., 2009, 2011; Laaha et al., 2014) and regression-based methods (e.g., Laaha and Blöschl, 2006, 2007); an overview is given by Salinas et al. (2013).”
MethodSelf-citationPrediction of low-flow indices in ungauged basins through physiographical space-based interpolation.
Castiglioni, S., Castellarin, A., & Montanari, A. (2009) · Journal of Hydrology · doi:10.1016/j.jhydrol.2009.09.032 · Cited by 70 · cited 1×
“Statistical low-flow models can be further subdivided into geostatistical models (e.g., Castiglioni et al., 2009, 2011; Laaha et al., 2014) and regression-based methods (e.g., Laaha and Blöschl, 2006, 2007); an overview is given by Salinas et al. (2013).”
Methodwesanderson: A Wes Anderson Palette Generator
Ram, K., & Wickham, H. (2014) · doi:10.32614/cran.package.wesanderson · Cited by 65
Ouarda, T. B. M. J., Charron, C., Hundecha, Y., St‐Hilaire, A., & Chebana, F. (2018) · Environmental Modelling & Software · doi:10.1016/j.envsoft.2018.08.031 · Cited by 53 · cited 1×
“A maximum likelihood estimation of a generalized additive model in a regional frequency approach for low flow was already adapted by Ouarda et al. (2018).”
BackgroundBoosting for statistical modelling-A non-technical introduction
Mayr, A. J., & Hofner, B. (2018) · Statistical Modelling · doi:10.1177/1471082x17748086 · Cited by 52 · cited 3×
“When predictors X are entered as separate learners, so that the prediction function f is an additive estimate based on simple linear terms fj (xj )= βjxj , the approach allows one to obtain an inherent variable selection and can penalize regression coefficients (Mayr and Hofner, 2018).”
MethodHothorn, T., Bühlmann, P., Kneib, T., Schmid, M. C., & Hofner, B. (2006) · doi:10.32614/cran.package.mboost · Cited by 52
See, L., Solomatine, D., Abrahart, R., et al. (2007) · Hydrological Sciences Journal · doi:10.1623/hysj.52.3.391 · Cited by 40 · cited 1×
“This leads to a major criticism of statistical learning models, as they are often inferred as “black box” models (Efron, 2020; See et al., 2007), meaning that prediction accuracy and process understanding cannot be reached at the same time (Kuhn and Johnson, 2019).”
Backgroundspls: Sparse Partial Least Squares (SPLS) Regression and Classification
Chung, D., Chun, H., & Keles, S. (2008) · doi:10.32614/cran.package.spls · Cited by 33
On the choice and influence of the number of boosting steps for high-dimensional linear Cox-models
Seibold, H., Bernau, C., Boulesteix, A., & Bin, R. D. (2017) · Computational Statistics · doi:10.1007/s00180-017-0773-8 · Cited by 32 · cited 1×
“Although studies indicate that repeated CV would yield more robust results (Seibold et al., 2018), due to computational costs and the low risk of overfitting 10-fold CV seemed sufficient.”
BackgroundInformation‐Based Machine Learning for Tracer Signature Prediction in Karstic Environments
Mewes, B., Oppel, H., Marx, V., & Hartmann, A. (2020) · Water Resources Research · doi:10.1029/2018wr024558 · Cited by 30 · cited 1×
“…rainfall–runoff modeling by neural networks (e.g., Kratzert et al., 2019a, b), using support vector machines (SVM) for prediction of karst tracers (Mewes et al., 2020) or reference evapotranspiration (Tabari et al., 2012) and random forest for flood event classification (Oppel and Mewes, 2020).”
MethodDevelopment of a longterm dataset of solid/liquid precipitation
Chimani, B., Böhm, R., Matulla, C., et al. (2011) · doi:10.5194/asr-6-39-2011 · Cited by 26 · cited 4×
“for a finer resolution, as it already relies on a statistical relationship of temperature with solid precipitation (Chimani et al., 2011).”
BackgroundMethodInfluentialOn the Automation of Flood Event Separation From Continuous Time Series
Oppel, H., & Mewes, B. (2020) · Frontiers in Water · doi:10.3389/frwa.2020.00018 · Cited by 25 · cited 2×
“, 2012) and random forest for flood event classification (Oppel and Mewes, 2020).”
BackgroundMethodTyralis, H., Papacharalampous, G., Langousis, A., & Papalexiou, S. M. (2021) · Remote Sensing · doi:10.3390/rs13030333 · Cited by 22 · cited 10×
“Tree-based methods performed better in terms of point prediction for the CAMELS dataset (Tyralis et al., 2021) or an Australian dataset of 605 stations (Zhang et al.”
BackgroundMethodInfluentialBoosted structured additive regression for Escherichia coli fed‐batch fermentation modeling
Melcher, M., Scharl, T., Luchner, M., Striedner, G., & Leisch, F. (2016) · Biotechnology and Bioengineering · doi:10.1002/bit.26073 · Cited by 16
Self-citationRegional low flow analysis in Sefidrood Drainage Basin, Iran using principal component regression
Nosrati, K., Laaha, G., Sharifnia, S. A., et al. (2015) · Hydrology research · doi:10.2166/nh.2014.087 · Cited by 11
Self-citationFeature Engineering and Selection: Introduction
Kuhn, M., & Johnson, K. (2019) · Feature Engineering and Selection · doi:10.1201/9781315108230-1 · Cited by 1 · cited 5×
“…Elisseeff, 2003), which include correlation-based variable selection or univariate regression filters; finally, (iii) wrapper-based methods (Kohavi and John, 1997) such as recursive feature elimination (RFE) (Guyon et al., 2002; Granitto et al., 2006) or genetic algorithms (Kuhn and Johnson, 2019).”
BackgroundMethodInfluential
Research works printed but not linked: 2
- https://doi.org/10.5194/hess-2021-481 Preprint. Discussion started: 22 September 2021 c Author(s) 2021. CC BY 4.0 License. · doi:10.5194/hess-2021-481preprint.discussionstarted:22september2021cauthor
- Wold, H.: Estimation of principal components and related models by iterative least squares, Multivariate analysis, pp. 391-420, 1966. https://doi.org/10.5194/hess-2021-481 Preprint. Discussion started: 22 September 2021 c Author(s) 2021. CC BY 4.0 License. · doi:10.5194/hess-2021-481preprint.discussionstarted:22september2021cauthor
Cited by
Papacharalampous, G., & Tyralis, H. (2022) · Water · doi:10.3390/w14101657 · Cited by 19
“…signature regionalization (see, e.g., the modelling works by Beck et al. 2015; Westerberg et al. 2016; Addor et al. 2018; Tyralis et al. 2021b; Laimighofer et al. 2022, as well as the reviews and taxonomies of streamflow signatures by McMillan et al. 2017; McMillan 2020) and catchment model…”
Laimighofer, J., Melcher, M., & Laaha, G. (2022) · Hydrology and Earth System Sciences · doi:10.5194/hess-26-4553-2022 · Cited by 12
“…from (cid:58)(cid:58)(cid:58)(cid:58)(cid:58) model (cid:58)(cid:58)(cid:58)(cid:58)(cid:58)(cid:58) fitting The applied method is fully described in Laimighofer et al. (2022) and to increase clarity we added a visual explanation of the full cross validation procedure (Fig.”
Self-citationLaaha, G. (2023) · Hydrology and Earth System Sciences · doi:10.5194/hess-27-689-2023 · Cited by 8
Self-citationDelSanto, A., Bhuiyan, M. A. E., Andreadis, K. M., & Palmer, R. N. (2023) · Water · doi:10.3390/w15152813 · Cited by 12
A novel ensemble feature selection method for pixel-level segmentation of HER2 overexpression
Aguilera, A., Raquel Pezoa, R., & Rodríguez-Delherbe, A. (2022) · Complex & Intelligent Systems · doi:10.1007/s40747-022-00774-x · Cited by 10
“A parsimonious model implies learning models less complex, thus easier to interpret, to understand and more robust when predicting new samples [61].”
Background
Metadata
- Authors
- Laimighofer, J., Melcher, M., & Laaha, G.
- Affiliations
- BOKU University (AT)
- FH JOANNEUM University of Applied Sciences (AT)
- Corresponding author
- Laimighofer, Johannes
- Laaha, Gregor
- Venue
- Hydrology and earth system sciences
- Publisher
- Copernicus GmbH
- Published
- 2021-09-22
- Volume
- 26
- Issue
- 1
- Pages
- 129-148
- ISSN
- 1027-5606 (ISSN-L)
- OpenAlex
- W4225623739
- Cited by
- 30
- References
- 65
- Citations by year
- 2026: 1 · 2025: 6 · 2024: 5 · 2023: 6 · 2022: 12
- FWCI
- 2.12
- Type
- journal article
- Language
- en
- Open access
- gold
- doi.org
- Licence
- Locations
- Hydrology and earth system sciences (publishedVersion, cc-by)
- FH JOANNEUM ePUB (submittedVersion, cc-by)
- DOAJ (DOAJ: Directory of Open Access Journals) (submittedVersion, cc-by-sa)
- Funders
- Österreichischen Akademie der Wissenschaften (25819)
- Topics
- Physical Sciences › Environmental Science › Water Science and Technology › Hydrology and Watershed Management Studies
- Physical Sciences › Environmental Science › Environmental Engineering › Hydrological Forecasting Using AI
- Physical Sciences › Environmental Science › Global and Planetary Change › Hydrology and Drought Analysis
- Keywords
- statistical learning models, recursive feature elimination, feature selection, feature ranking, support vector regression, sparse partial least squares, principal component regression, random forest, ungauged basins, seasonal stratification
About these checks
Registry, retraction, Cites and statistics results are computed, not judged, with one exception: a printed reference that no index lists is read once by a model before it counts as a citation error. Claims are extracted by a model and kept only when their quote appears verbatim in the text; each cited source is then checked, with a model’s help, for whether it says what the claim relies on. Those verdicts can be wrong — read the claim’s quote and the cited source before relying on one.
Statistics and arithmetic are recomputed, not judged.
Confidence bands are shown only for fields calibrated on our annotated test set. None is calibrated yet, so no band is shown.
What counts as a claim ›How we measure confidence ›How we check this ›
Are you an author, or do you see a problem with this page? Request a review
Data sources
Bibliographic data: Semantic Scholar, OpenAlex, Crossref.
Contains information from the Semantic Scholar Academic Graph Datasets, made available under the ODC Attribution License (ODC-BY 1.0).
Semantic Scholar’s data is described in: Kinney, R., et al. (2023). The Semantic Scholar Open Data Platform. arXiv:2301.10140.
