

The DOI matches its Crossref record; 45 of the 45 references it cites were found in a registry or an index.
Identification of ‘erasers’ for lysine crotonylated histone marks using a chemical proteomics approach
Open accessAbstract
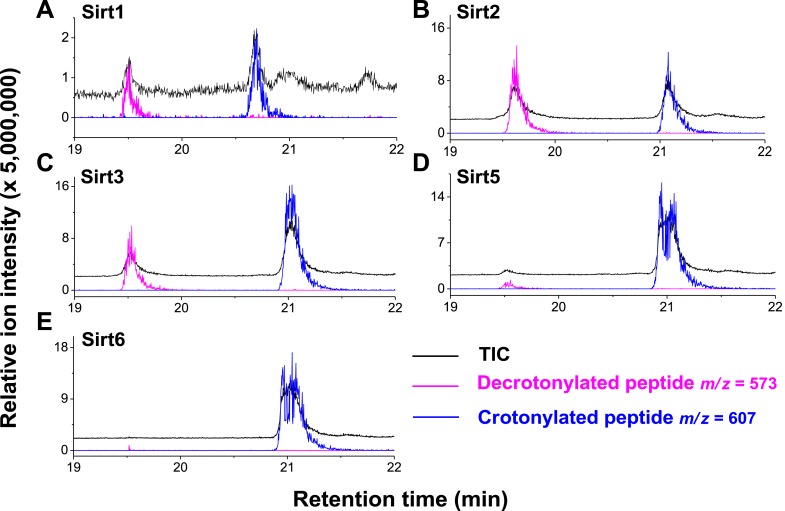
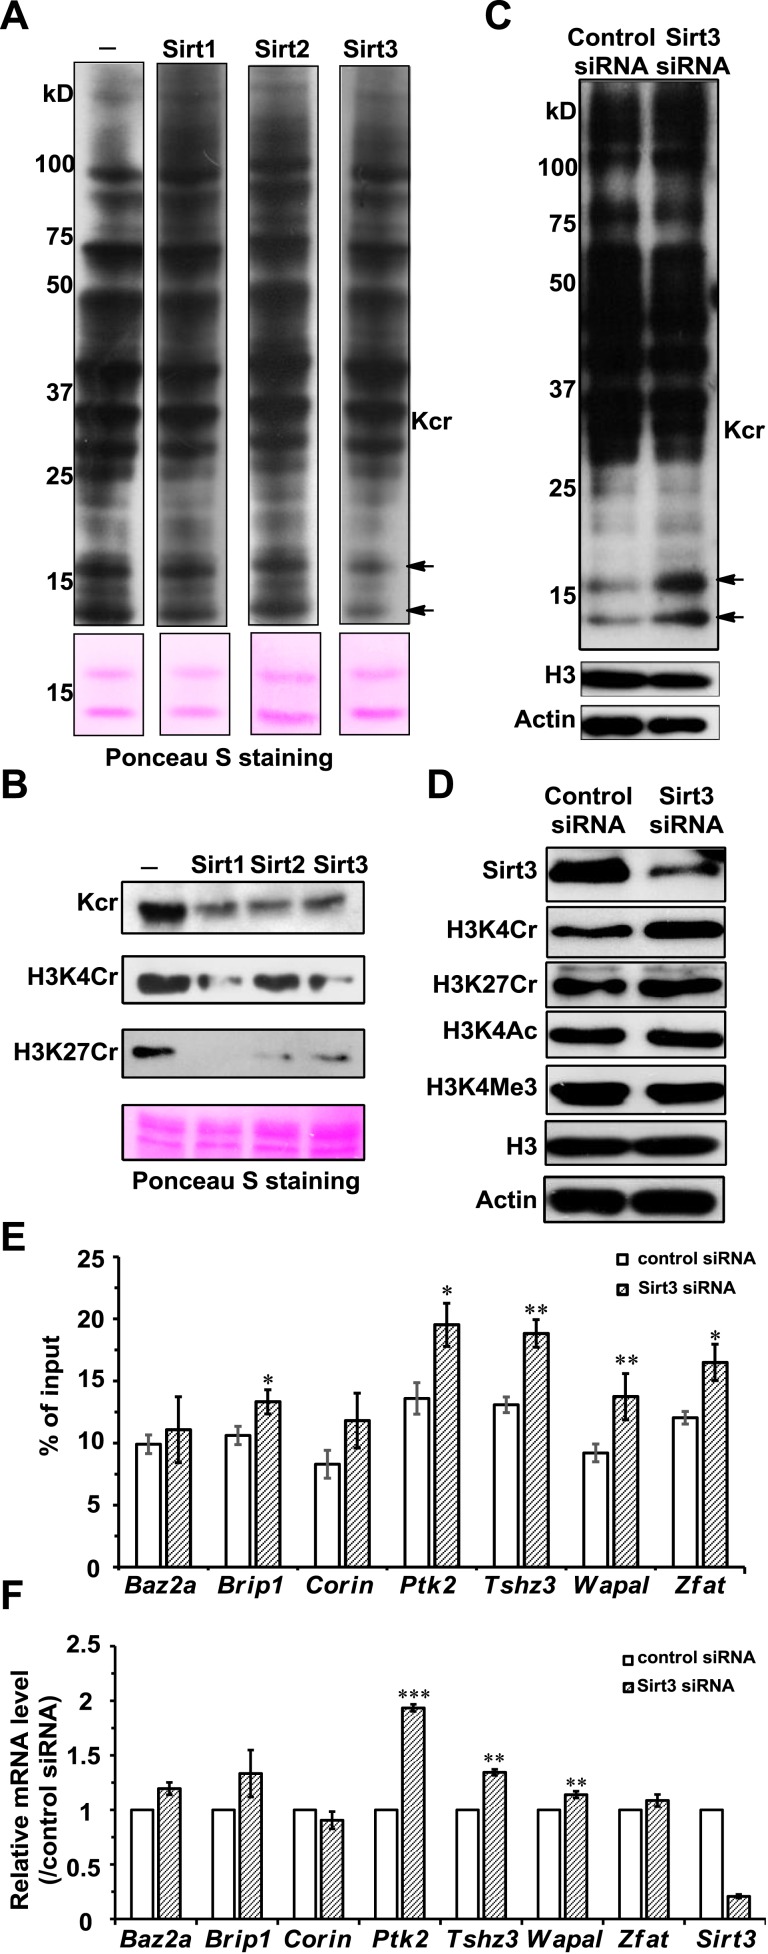
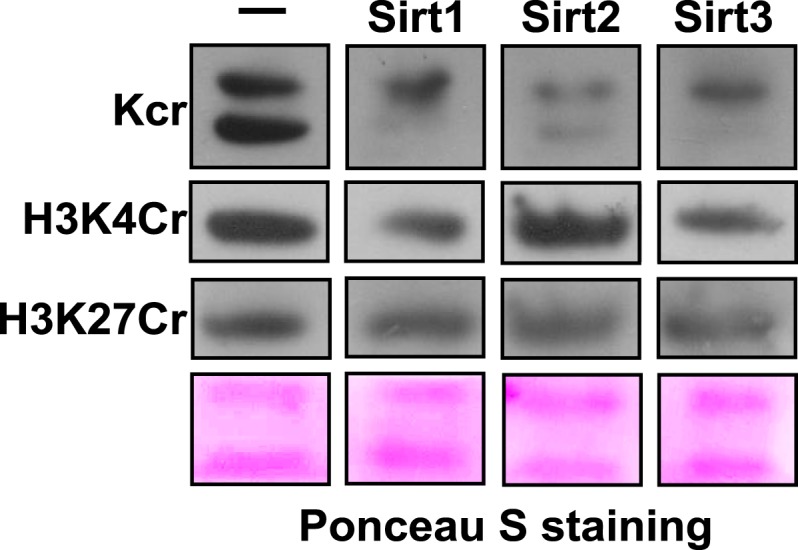
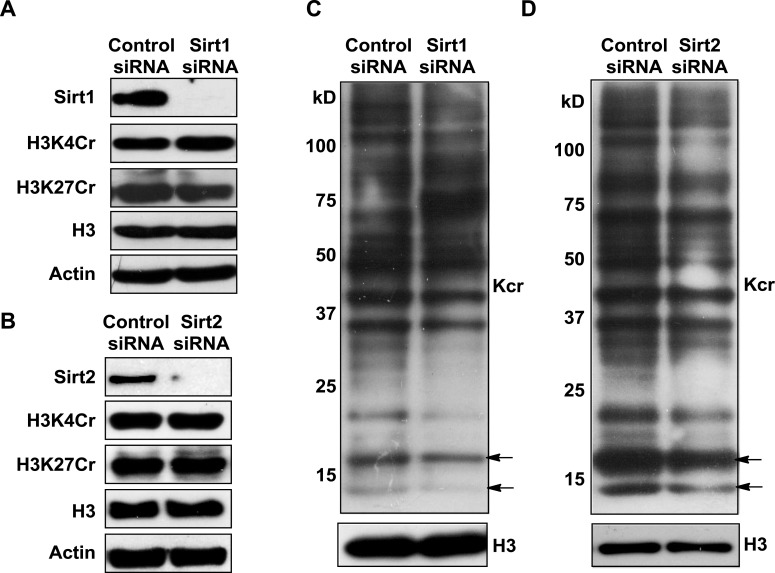
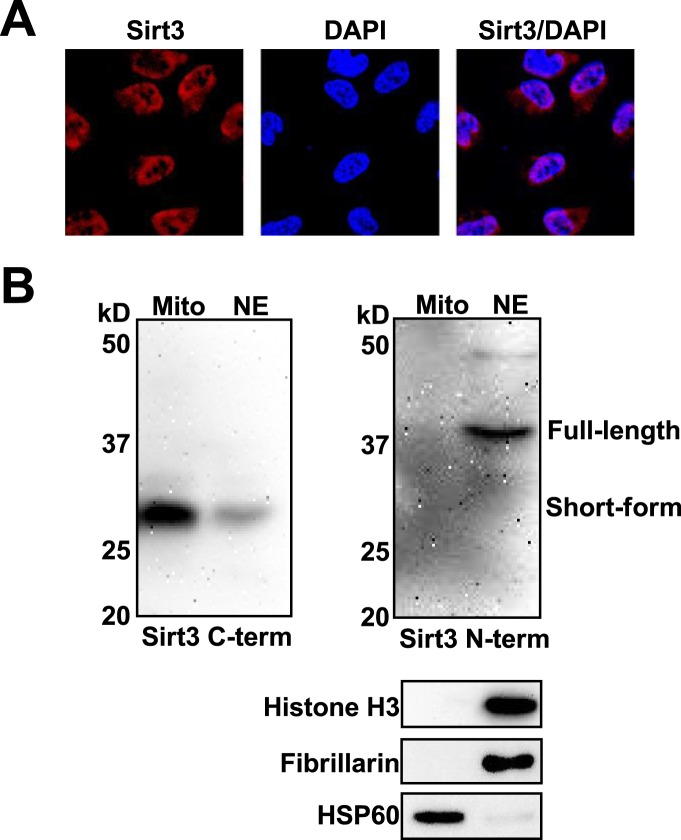
Posttranslational modifications (PTMs) play a crucial role in a wide range of biological processes. Lysine crotonylation (Kcr) is a newly discovered histone PTM that is enriched at active gene promoters and potential enhancers in mammalian cell genomes. However, the cellular enzymes that regulate the addition and removal of Kcr are unknown, which has hindered further investigation of its cellular functions. Here we used a chemical proteomics approach to comprehensively profile ‘eraser’ enzymes that recognize a lysine-4 crotonylated histone H3 (H3K4Cr) mark. We found that Sirt1, Sirt2, and Sirt3 can catalyze the hydrolysis of lysine crotonylated histone peptides and proteins. More importantly, Sirt3 functions as a decrotonylase to regulate histone Kcr dynamics and gene transcription in living cells. This discovery not only opens opportunities for examining the physiological significance of histone Kcr, but also helps to unravel the unknown cellular mechanisms controlled by Sirt3, that have previously been considered solely as a deacetylase.
Overview
The claims and statistics of this paper haven’t been checked yet.
Run the check — free, no account needed. It reads the open-access text and checks the sources it cites.
Integrity signals
Registry
Cites
Statistics
Figures
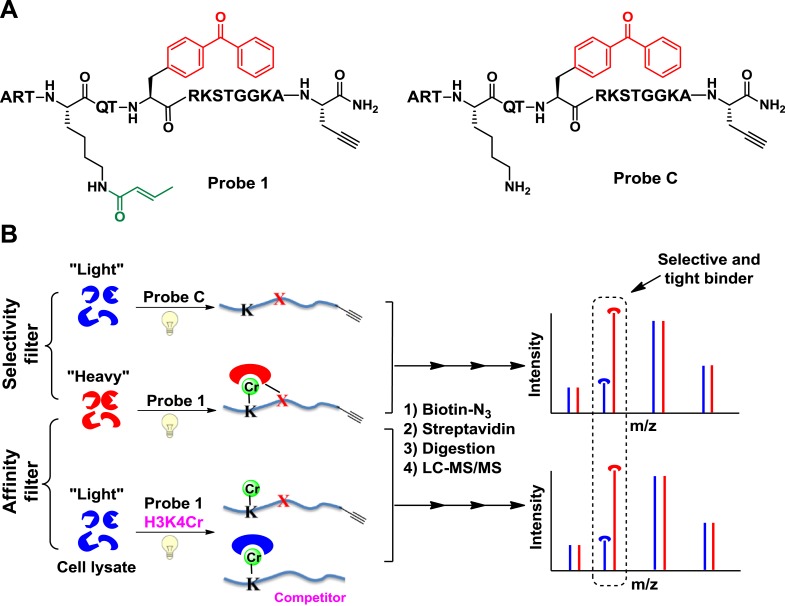
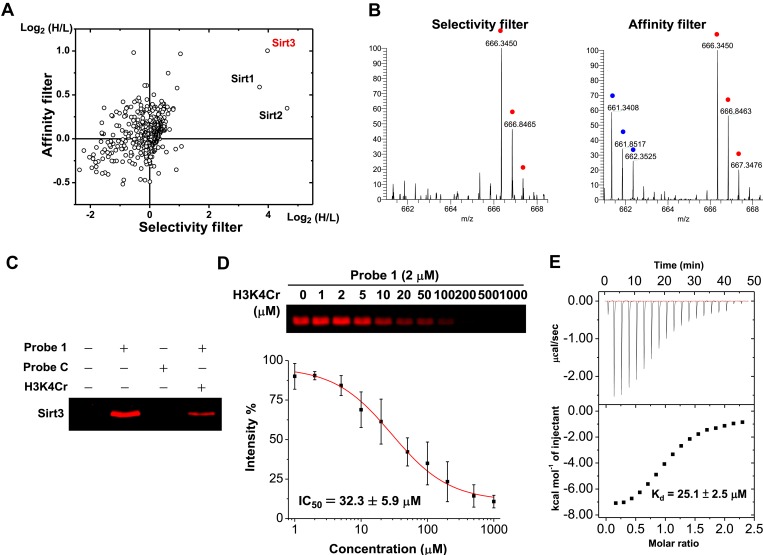
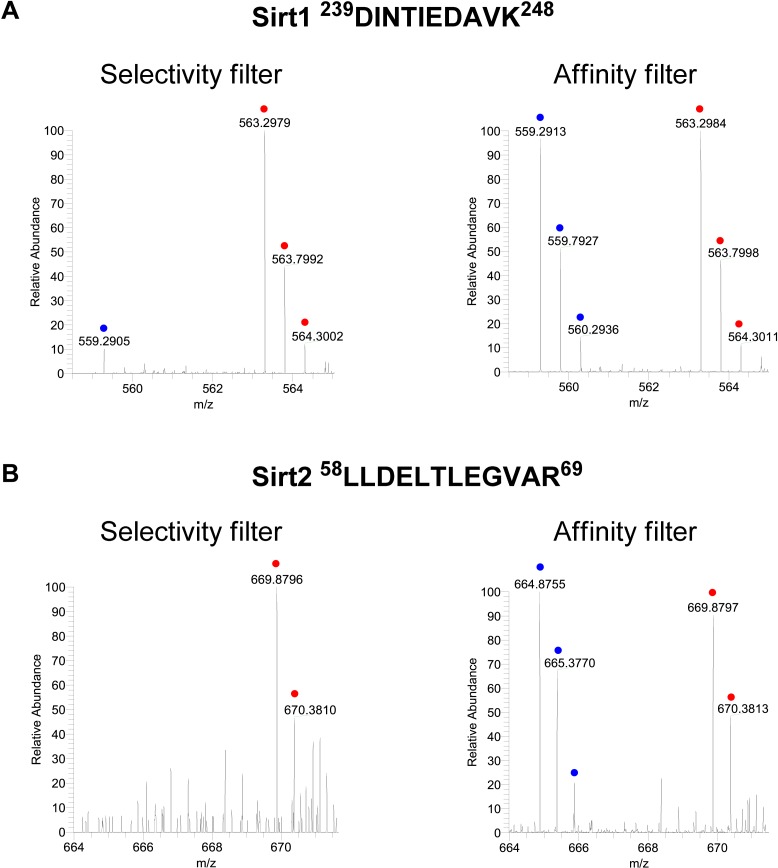
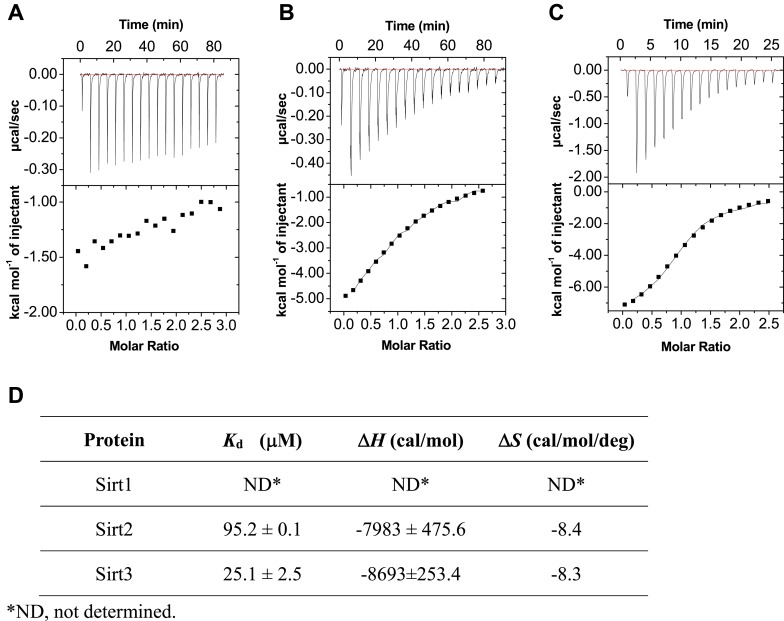
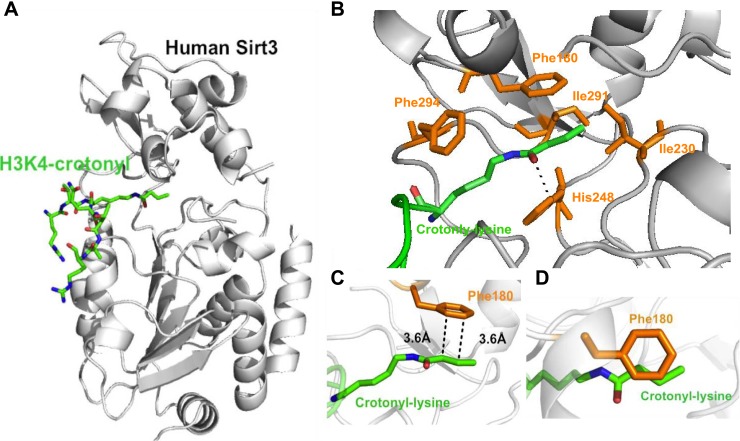
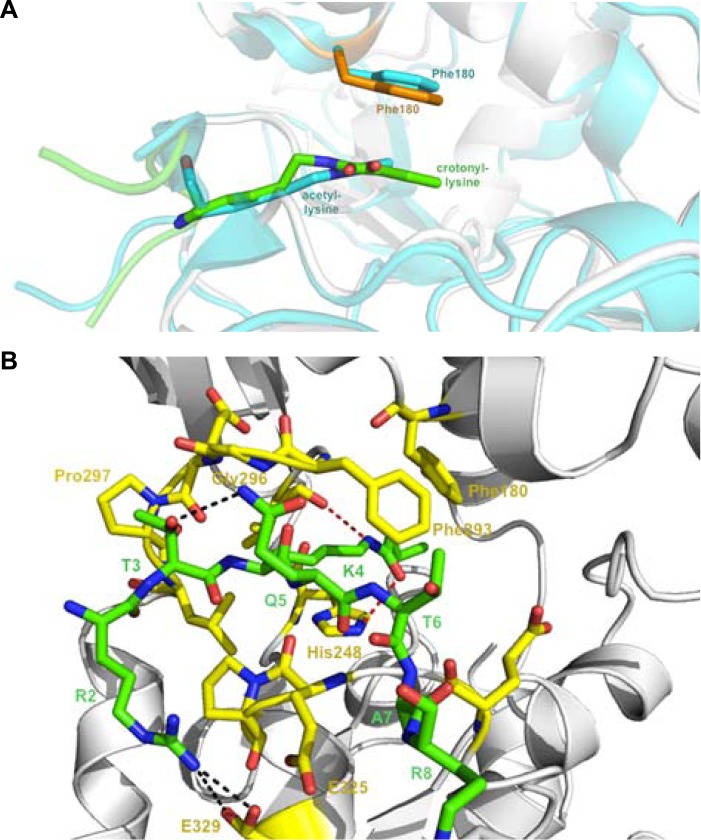
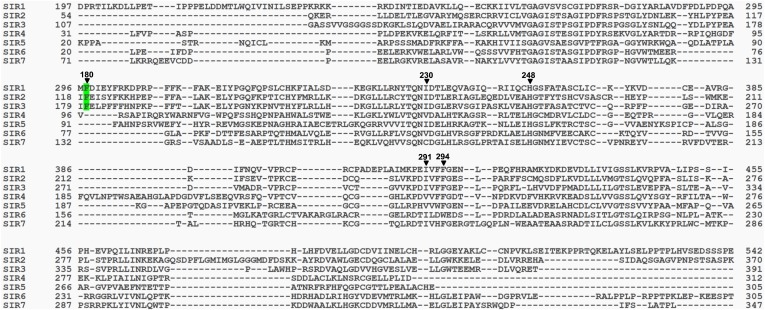
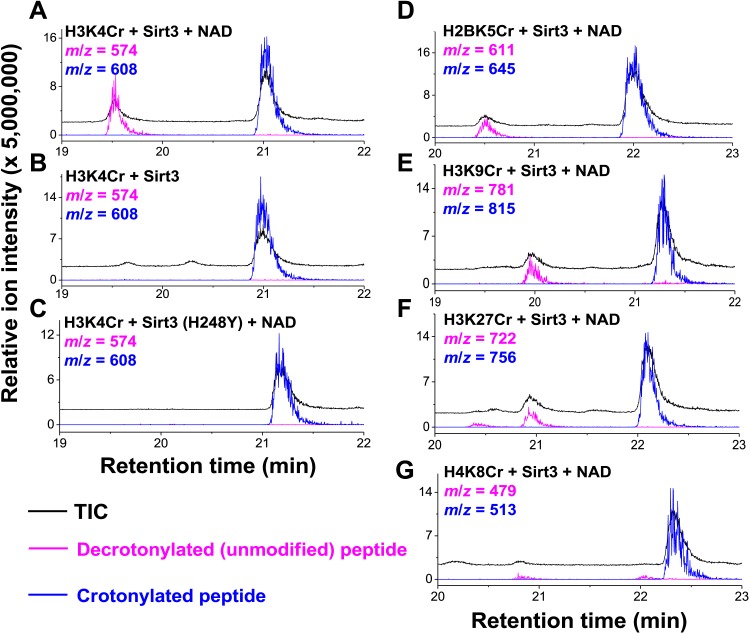
Verification
Claims the paper makes
The claims and statistics of this paper haven’t been checked yet.
Run the check — free, no account needed. It reads the open-access text and checks the sources it cites.
Claims other papers make about this one
Each is checked against this paper’s own text: does it say what the citing paper says it does?
In the citing paper
“Unsurprisingly, given the range of their potential substrates, sirtuins 1, 216 and 317 were shown to be decrotonylases in vitro.”
From Histone deacetylase (HDAC) 1 and 2 complexes regulate both histone acetylation and crotonylation in vivo (2018) · cites this paper as [17]
In the citing paper
“To date, decrotonylase activity has been described for HDAC1-3 and Sirtuins 1-316–18,21,22.”
From Histone deacetylase (HDAC) 1 and 2 complexes regulate both histone acetylation and crotonylation in vivo (2018) · cites this paper as [17]
Self-check
Percentages, sums and reported differences re-computed from the paper’s own numbers.
The self-check needs the paper’s full text.
Citations
Cites
[20] Processing of X-ray diffraction data collected in oscillation mode
Otwinowski, Z., & Minor, W. (1997) · Methods in Enzymology · doi:10.1016/s0076-6879(97)76066-x · Cited by 33,475
The CCP4 suite: programs for protein crystallography
Number Collaborative Computational Project (1994) · Acta Crystallographica Section D Biological Crystallography · doi:10.1107/s0907444994003112 · Cited by 17,317
Chromatin modifications and their function
Kouzarides, T. (2007) · Cell · doi:10.1016/j.cell.2007.02.005 · Cited by 10,883
Jenuwein, T., & Allis, C. D. (2001) · Science · doi:10.1126/science.1063127 · Cited by 9,756
Chen, X., Xiu, M., Xing, J., Yu, S., Min, D., & Guo, F. (2017) · Cellular Physiology and Biochemistry · doi:10.1159/000479439 · Cited by 5,760
Transcriptional silencing and longevity protein Sir2 is an NAD-dependent histone deacetylase
Imai, S.-I., Armstrong, C. M., Kaeberlein, M., & Guarente, L. (2000) · Nature · doi:10.1038/35001622 · Cited by 3,510
Histone acetylation in chromatin structure and transcription
Grunstein, M. (1997) · Nature · doi:10.1038/38664 · Cited by 2,884
ACETYLATION AND METHYLATION OF HISTONES AND THEIR POSSIBLE ROLE IN THE REGULATION OF RNA SYNTHESIS
Allfrey, V. G., Faulkner, R. D., & Mirsky, A. E. (1964) · Proceedings of the National Academy of Sciences · doi:10.1073/pnas.51.5.786 · Cited by 2,788
Haberland, M., Montgomery, R. L., & Olson, E. N. (2008) · Nature Reviews Genetics · doi:10.1038/nrg2485 · Cited by 2,600
Epigenetics: A landscape takes shape
Goldberg, A. D., Allis, C. D., & Bernstein, E. (2007) · Cell · doi:10.1016/j.cell.2007.02.006 · Cited by 2,466
Cited by
Sorted by citations
Cantó, C., Menzies, K. J., & Auwerx, J. (2015) · Cell Metabolism · doi:10.1016/j.cmet.2015.05.023 · Cited by 1,648
Metabolic regulation of gene expression through histone acylations
Sabari, B. R., Zhang, D., Allis, C. D., & Zhao, Y. (2016) · Nature Reviews Molecular Cell Biology · doi:10.1038/nrm.2016.140 · Cited by 1,168
Modulation of cellular processes by histone and non-histone protein acetylation
Shvedunova, M., & Akhtar, A. (2022) · Nature Reviews Molecular Cell Biology · doi:10.1038/s41580-021-00441-y · Cited by 1,007
Li, L., Shi, L., Yang, S., Yan, R., Zhang, D., Yang, J., He, L., Li, W., Yi, X., Sun, L., et al. (2016) · Nature Communications · doi:10.1038/ncomms12235 · Cited by 400
SIRT1 and SIRT6 Signaling Pathways in Cardiovascular Disease Protection
D’Onofrio, N., Servillo, L., & Balestrieri, M. L. (2017) · Antioxidants and Redox Signaling · doi:10.1089/ars.2017.7178 · Cited by 396
Molecular Coupling of Histone Crotonylation and Active Transcription by AF9 YEATS Domain
Li, Y., Sabari, B. R., Panchenko, T., Wen, H., Zhao, D., Guan, H., Wan, L., Huang, H., Tang, Z., Zhao, Y., et al. (2016) · Molecular Cell · doi:10.1016/j.molcel.2016.03.028 · Cited by 384
Wei, W., Liu, X., Chen, J., Gao, S., Lu, L., Zhang, H., Ding, G., Wang, Z., Chen, Z., Shi, T., et al. (2017) · Cell Research · doi:10.1038/cr.2017.68 · Cited by 304
Schiedel, M., Herp, D., Hammelmann, S., Swyter, S., Lehotzky, A., Robaa, D., Oláh, J., Ovádi, J., Sippl, W., & Jung, M. (2017) · Journal of Medicinal Chemistry · doi:10.1021/acs.jmedchem.6b01872 · Cited by 277
Functions of the sirtuin deacylase SIRT5 in normal physiology and pathobiology
Kumar, S., & Lombard, D. B. (2018) · Critical Reviews in Biochemistry and Molecular Biology · doi:10.1080/10409238.2018.1458071 · Cited by 273
Liu, R., Wu, J., Guo, H., Yao, W., Li, S., Lu, Y., Jia, Y., Liang, X., Tang, J., & Zhang, H. (2023) · MedComm · doi:10.1002/mco2.292 · Cited by 315
Compartmentalised acyl-CoA metabolism and roles in chromatin regulation
Trefely, S., Lovell, C. D., Snyder, N. W., & Wellen, K. E. (2020) · Molecular Metabolism · doi:10.1016/j.molmet.2020.01.005 · Cited by 272
Liu, S., Yu, H., Liu, Y., Liu, X., Zhang, Y., Bu, C., Yuan, S., Chen, Z., Xie, G., Li, W., et al. (2017) · Molecular Cell · doi:10.1016/j.molcel.2017.07.011 · Cited by 258
The Substrate Specificity of Sirtuins
Bheda, P., Jing, H., Wolberger, C., & Lin, H. (2016) · Annual Review of Biochemistry · doi:10.1146/annurev-biochem-060815-014537 · Cited by 251
Mitochondrial sirtuins, metabolism, and aging
Ji, Z., Liu, G., & Qu, J. T. (2021) · Journal of genetics and genomics/Journal of Genetics and Genomics · doi:10.1016/j.jgg.2021.11.005 · Cited by 250
Protein acylation: mechanisms, biological functions and therapeutic targets
Shang, S., Liu, J., & Hua, F. (2022) · Signal Transduction and Targeted Therapy · doi:10.1038/s41392-022-01245-y · Cited by 261
The Taf14 YEATS domain is a reader of histone crotonylation
Andrews, F. H., Shinsky, S. A., Shanle, E. K., Bridgers, J. B., Gest, A. M. M., Tsun, I. K., Krajewski, K., Shi, X., Strahl, B. D., & Kutateladze, T. G. (2016) · Nature Chemical Biology · doi:10.1038/nchembio.2065 · Cited by 248
Barnes, C. E., English, D. M., & Cowley, S. M. (2019) · Essays in Biochemistry · doi:10.1042/ebc20180061 · Cited by 249
Characterization of histone acylations links chromatin modifications with metabolism
Simithy, J., Sidoli, S., Yuan, Z., Coradin, M., Bhanu, N. V., Marchione, D. M., Klein, B. J., Bazilevsky, G. A., McCullough, C. E., Magin, R. S., et al. (2017) · Nature Communications · doi:10.1038/s41467-017-01384-9 · Cited by 246
Flynn, E. M., Huang, O. W., Poy, F., Oppikofer, M., Bellon, S. F., Tang, Y., & Cochran, A. G. (2015) · Structure · doi:10.1016/j.str.2015.08.004 · Cited by 235
SIRT3 regulates progression and development of diseases of aging
McDonnell, E., Peterson, B. S., Bomze, H. M., & Hirschey, M. D. (2015) · Trends in Endocrinology & Metabolism · doi:10.1016/j.tem.2015.06.001 · Cited by 217
Crossing epigenetic frontiers: the intersection of novel histone modifications and diseases
Yao, W., Hu, X., & Wang, X. (2024) · Signal Transduction and Targeted Therapy · doi:10.1038/s41392-024-01918-w · Cited by 257
Global profiling of crotonylation on non-histone proteins
Xu, W., Wan, J., Zhan, J., Li, X., He, H., Shi, Z., & Zhang, H. (2017) · Cell Research · doi:10.1038/cr.2017.60 · Cited by 213
Self-citationBeyond histone acetylation—writing and erasing histone acylations
Zhao, S., Zhang, X., & Li, H. (2018) · Current Opinion in Structural Biology · doi:10.1016/j.sbi.2018.10.001 · Cited by 215
The Role of Sirtuins in Cellular Homeostasis
Kupis, W., Pałyga, J., Tomal, E., & Niewiadomska, E. (2016) · Journal of Physiology and Biochemistry · doi:10.1007/s13105-016-0492-6 · Cited by 200
Li, W., Li, F., Zhang, X., Lin, H., & Xu, C. S. (2021) · Signal Transduction and Targeted Therapy · doi:10.1038/s41392-021-00825-8 · Cited by 211
Selective recognition of histone crotonylation by double PHD fingers of MOZ and DPF2
Xiong, X., Panchenko, T., Yang, S., Zhao, S., Yan, P., Zhang, W., Xie, W., Li, Y., Zhao, Y., Allis, C. D., et al. (2016) · Nature Chemical Biology · doi:10.1038/nchembio.2218 · Cited by 198
Christensen, D. G., Xie, X., Basisty, N., Byrnes, J., McSweeney, S. M., Schilling, B., & Wolfe, A. J. (2019) · Frontiers in Microbiology · doi:10.3389/fmicb.2019.01604 · Cited by 184
The role of mitochondrial sirtuins in health and disease
Osborne, B., Bentley, N. L., Montgomery, M. K., & Turner, N. A. (2016) · Free Radical Biology and Medicine · doi:10.1016/j.freeradbiomed.2016.04.197 · Cited by 183
HIV latency is reversed by ACSS2-driven histone crotonylation
Jiang, G., Nguyen, D. X., Archin, N. M., Yukl, S. A., Méndez‐Lagares, G., Tang, Y., Elsheikh, M. M., Thompson, G. R., Hartigan-O’Connor, D. J., Margolis, D. M., et al. (2018) · Journal of Clinical Investigation · doi:10.1172/jci98071 · Cited by 169
Structure of p300 in complex with acyl-CoA variants
Kaczmarska, Z., Ortega, E. M., Goudarzi, A., Huang, H., KIM, S. ‐., Márquez, J. A., Zhao, Y., Khochbin, S., & Panne, D. (2016) · Nature Chemical Biology · doi:10.1038/nchembio.2217 · Cited by 186
Understanding the Function of Mammalian Sirtuins and Protein Lysine Acylation
Wang, M., & Lin, H. (2021) · Annual Review of Biochemistry · doi:10.1146/annurev-biochem-082520-125411 · Cited by 174
Histone crotonylation promotes mesoendodermal commitment of human embryonic stem cells
Fang, Y., Xu, X., Ding, J., Yang, L., Doan, M. T., Karmaus, P. W. F., Snyder, N. W., Zhao, Y., Li, J., & Li, X. (2021) · Cell stem cell · doi:10.1016/j.stem.2020.12.009 · Cited by 158
Self-citationMitochondrial Sirtuins and Their Relationships with Metabolic Disease and Cancer
Kumar, S., & Lombard, D. B. (2014) · Antioxidants and Redox Signaling · doi:10.1089/ars.2014.6213 · Cited by 160
Histone lysine crotonylation during acute kidney injury in mice
Ruiz‐Andrés, O., Sánchez-Niño, M. D., Cannata‐Ortiz, P., Ruiz‐Ortega, M., Egido, J., Ortíz, A., & Sanz, A. B. (2016) · Disease Models & Mechanisms · doi:10.1242/dmm.024455 · Cited by 159
The chemical biology of sirtuins
Chen, B., Zang, W., Wang, J., Huang, Y., He, Y., Yan, L., Liu, J., & Zheng, W. (2015) · Chemical Society Reviews · doi:10.1039/c4cs00373j · Cited by 146
Kelly, R. D. W., Chandru, A., Watson, P. J., Song, Y., Blades, M., Robertson, N. S., Jamieson, A. G., Schwabe, J. W. R., & Cowley, S. M. (2018) · Scientific Reports · doi:10.1038/s41598-018-32927-9 · Cited by 138
Functions and mechanisms of lysine crotonylation
Wan, J., Liu, H., Chu, J., & Zhang, H. (2019) · Journal of Cellular and Molecular Medicine · doi:10.1111/jcmm.14650 · Cited by 142
Deep-Kcr: accurate detection of lysine crotonylation sites using deep learning method
Lv, H., Dao, F., Guan, Z.-X., Yang, H. Q., Li, Y., & Lin, H. (2020) · Briefings in Bioinformatics · doi:10.1093/bib/bbaa255 · Cited by 141
Protein lysine crotonylation: past, present, perspective
Jiang, G., Li, C., Lü, M. K., Lu, K., & Li, H. (2021) · Cell Death and Disease · doi:10.1038/s41419-021-03987-z · Cited by 138
Targeting epigenetic DNA and histone modifications to treat kidney disease
Fontecha‐Barriuso, M., Martín‐Sánchez, D., Ruiz‐Andrés, O., Poveda, J., Sánchez-Niño, M. D., Rivas, L. V., Ruiz‐Ortega, M., Ortíz, A., & Sanz, A. B. (2018) · Nephrology Dialysis Transplantation · doi:10.1093/ndt/gfy009 · Cited by 135
Recognition of Histone Crotonylation by Taf14 Links Metabolic State to Gene Expression
Gowans, G. J., Bridgers, J. B., Zhang, J., Dronamraju, R., Burnetti, A., King, D. A., Thiengmany, A., Shinsky, S. A., Bhanu, N. V., Garcia, B. A., et al. (2019) · Molecular Cell · doi:10.1016/j.molcel.2019.09.029 · Cited by 126
Self-citationIdentification of SIRT3 as an eraser of H4K16la
Fan, Z., Liu, Z., Zhang, N., Wei, W., Cheng, K., Sun, H., & Hao, Q. (2023) · iScience · doi:10.1016/j.isci.2023.107757 · Cited by 133
Self-citationMolecular basis for hierarchical histone de-β-hydroxybutyrylation by SIRT3
Zhang, X., Cao, R., Niu, J., Yang, S., Ma, H., Zhao, S., & Li, H. (2019) · Cell Discovery · doi:10.1038/s41421-019-0103-0 · Cited by 128
The Current State of NAD+‐Dependent Histone Deacetylases (Sirtuins) as Novel Therapeutic Targets
Schiedel, M., Robaa, D., Rumpf, T., Sippl, W., & Jung, M. (2017) · Medicinal Research Reviews · doi:10.1002/med.21436 · Cited by 125
Li, L., Xiang, T., Guo, J., Guo, F., Wu, Y., Feng, H., Liu, J., Tao, S., Fu, P., & Ma, L. (2024) · Nature Communications · doi:10.1038/s41467-024-47315-3 · Cited by 123
Aging Promotes Sirtuin 3–Dependent Cartilage Superoxide Dismutase 2 Acetylation and Osteoarthritis
Fu, Y. S., Kinter, M. T., Hudson, J., Humphries, K. M., Lane, R. S., White, J. R., Hakim, M., Pan, Y., Verdin, E. M., & Griffin, T. M. (2016) · Arthritis & Rheumatology · doi:10.1002/art.39618 · Cited by 115
Lu, Y., Xu, Q., Liu, Y. M., Yu, Y., Cheng, Z., Zhao, Y. J., & Zhou, D. (2018) · Genome biology · doi:10.1186/s13059-018-1533-y · Cited by 118
Investigating the Sensitivity of NAD+-dependent Sirtuin Deacylation Activities to NADH
Madsen, A. S., Andersen, C. D., Daoud, M., Anderson, K. A., Laursen, J. S., Chakladar, S., Huynh, F. K., Colaço, A. R., Backos, D. S., Fristrup, P., et al. (2016) · Journal of Biological Chemistry · doi:10.1074/jbc.m115.668699 · Cited by 111
Structure-guided development of YEATS domain inhibitors by targeting π-π-π stacking
Li, X., Li, X.-M., Jiang, Y., Liu, Z., Cui, Y., Fung, K. Y., van der Beelen, S. H. E., Tian, G., Wan, L., Shi, X., et al. (2018) · Nature Chemical Biology · doi:10.1038/s41589-018-0144-y · Cited by 107
Self-citationThe Regulation and Function of Histone Crotonylation
Ntorla, A., & Burgoyne, J. R. (2021) · Frontiers in Cell and Developmental Biology · doi:10.3389/fcell.2021.624914 · Cited by 112
Structural Insights into Histone Crotonyl-Lysine Recognition by the AF9 YEATS Domain
Zhang, Q., Zeng, L., Zhao, C., Ju, Y., Konuma, T., & Zhou, M. (2016) · Structure · doi:10.1016/j.str.2016.05.023 · Cited by 106
Liu, Y., Li, M., Fan, M., Song, Y., Yu, H., Zhi, X., Xiao, K., Lai, S., Zhang, J., Jin, X., et al. (2019) · Biological Psychiatry · doi:10.1016/j.biopsych.2018.11.025 · Cited by 106
Self-citationChemical and structural biology of protein lysine deacetylases
Yoshida, M., Kudo, N., Kosono, S., & Ito, A. (2017) · Proceedings of the Japan Academy Series B · doi:10.2183/pjab.93.019 · Cited by 109
Yang, Y., Wen, R., Yang, N., Zhang, T., & Liu, C. (2023) · Molecular Medicine · doi:10.1186/s10020-023-00684-9 · Cited by 107
SIRT2 and lysine fatty acylation regulate the transforming activity of K-Ras4a
Jing, H., Zhang, X., Wisner, S., Chen, X., Spiegelman, N. A., Linder, M. E., & Lin, H. (2017) · eLife · doi:10.7554/elife.32436 · Cited by 102
Photo-lysine captures proteins that bind lysine post-translational modifications
Yang, T., Li, X., Bao, X., Fung, Y. M. E., & Li, X. (2015) · Nature Chemical Biology · doi:10.1038/nchembio.1990 · Cited by 97
Self-citationJu, Z., & He, J. (2017) · Journal of Molecular Graphics and Modelling · doi:10.1016/j.jmgm.2017.08.020 · Cited by 96
Sun, H., Liu, X., Li, F., Li, W., Zhang, J., Xiao, Z., Shen, L., Li, Y., Wang, F., & Yang, J. (2017) · Scientific Reports · doi:10.1038/s41598-017-03369-6 · Cited by 96
Self-citationFu, Y., Yu, J., Li, F., & Ge, S. (2022) · Journal of Experimental & Clinical Cancer Research · doi:10.1186/s13046-022-02338-w · Cited by 104
Liu, S., Xue, C., Fang, Y., Chen, G., Peng, X., Zhou, Y., Chen, C., Liu, G., Gu, M., Wang, K., et al. (2018) · Molecular & Cellular Proteomics · doi:10.1074/mcp.ra118.000640 · Cited by 88
The therapeutic hope for HDAC6 inhibitors in malignancy and chronic disease
Batchu, S. N., Brijmohan, A. S., & Advani, A. (2016) · Clinical Science · doi:10.1042/cs20160084 · Cited by 86
Who watches the watchmen? Regulation of the expression and activity of sirtuins
Buler, M., Andersson, U., & Hakkola, J. (2016) · The FASEB Journal · doi:10.1096/fj.201600410rr · Cited by 92
Diverse Activities of Histone Acylations Connect Metabolism to Chromatin Function
Dutta, A., Abmayr, S. M., & Workman, J. L. (2016) · Molecular Cell · doi:10.1016/j.molcel.2016.06.038 · Cited by 87
Emerging role of SIRT3 in mitochondrial dysfunction and cardiovascular diseases
Wu, J., Zeng, Z., Zhang, W., Deng, Z., Wan, Y., Zhang, Y., An, S. L., Huang, Q., & Chen, Z. (2018) · Free Radical Research · doi:10.1080/10715762.2018.1549732 · Cited by 83
Histone acylation marks respond to metabolic perturbations and enable cellular adaptation
Jo, C., Park, S., Oh, S., Choi, J., Kim, E. K., Youn, H., & Cho, E. (2020) · Experimental & Molecular Medicine · doi:10.1038/s12276-020-00539-x · Cited by 86
Function and Mechanism of Novel Histone Posttranslational Modifications in Health and Disease
Xu, H., Wu, M., Ma, X., Huang, W. G., & Xu, Y. (2021) · BioMed Research International · doi:10.1155/2021/6635225 · Cited by 82
Sirtuin 2 deficiency aggravates ageing-induced vascular remodelling in humans and mice
Zhang, Y., Wang, X., Li, X.-K., Lv, S., Wang, H., Liu, Y., Zhou, J., Gong, H., Chen, X.-F., Ren, S., et al. (2023) · European Heart Journal · doi:10.1093/eurheartj/ehad381 · Cited by 84
Self-citationEpigenetic effects of short-chain fatty acids from the large intestine on host cells
Stein, R. A., & Riber, L. (2023) · microLife · doi:10.1093/femsml/uqad032 · Cited by 85
Wu, Q., Li, W., Wang, C., Fan, P., Cao, L., Wu, Z., & Wang, F. (2017) · Journal of Proteome Research · doi:10.1021/acs.jproteome.7b00380 · Cited by 79
Sex and gender differences in community-acquired pneumonia
Corica, B., Tartaglia, F., D’Amico, T., Romiti, G. F., & Cangemi, R. (2022) · Internal and Emergency Medicine · doi:10.1007/s11739-022-02999-7 · Cited by 90
Pharmacological intervention of histone deacetylase enzymes in the neurodegenerative disorders
Gupta, R. V., Ambasta, R. K., & Kumar, P. (2020) · Life Sciences · doi:10.1016/j.lfs.2020.117278 · Cited by 85
Histone Acylation beyond Acetylation: Terra Incognita in Chromatin Biology.
Rousseaux, S., & Khochbin, S. (2015) · PubMed · doi:10.22074/cellj.2015.506 · Cited by 74
Histone crotonylation-centric gene regulation
Li, K., & Wang, Z. (2021) · Epigenetics & Chromatin · doi:10.1186/s13072-021-00385-9 · Cited by 73
SIRT2 Reverses 4-Oxononanoyl Lysine Modification on Histones
Jin, J., He, B., Zhang, X., Lin, H., & Wang, Y. (2016) · Journal of the American Chemical Society · doi:10.1021/jacs.6b04977 · Cited by 73
Self-citationFluorescent Probes for Single-Step Detection and Proteomic Profiling of Histone Deacetylases
Xie, Y., Ge, J., Lei, J. H., Peng, B., Zhang, H., Wang, D., Pan, S., Chen, G., Chen, L., Wang, Y., et al. (2016) · Journal of the American Chemical Society · doi:10.1021/jacs.6b07334 · Cited by 74
Self-citationL- and D-Lactate: unveiling their hidden functions in disease and health
Li, J., Ma, P., Liu, Z., & Xie, J. (2025) · Cell Communication and Signaling · doi:10.1186/s12964-025-02132-z · Cited by 72
Self-citationUpdates on the epigenetic roles of sirtuins
Kosciuk, T., Wang, M., Hong, J. Y., & Lin, H. (2019) · Current Opinion in Chemical Biology · doi:10.1016/j.cbpa.2019.01.023 · Cited by 73
Chromatin dynamics and histone modifications in intestinal microbiota-host crosstalk
Fellows, R., & Varga‐Weisz, P. (2019) · Molecular Metabolism · doi:10.1016/j.molmet.2019.12.005 · Cited by 77
Multiple Roles of SIRT2 in Regulating Physiological and Pathological Signal Transduction
Zhu, C., Dong, X., Wang, X., Zheng, Y., Qiu, J., Peng, Y., Xu, J., Chai, Z., & Liu, C. (2022) · Genetics Research · doi:10.1155/2022/9282484 · Cited by 70
Transcriptional Regulation at DSBs: Mechanisms and Consequences
Machour, F. E., & Ayoub, N. (2020) · Trends in Genetics · doi:10.1016/j.tig.2020.01.001 · Cited by 68
Guo, Z., Zhang, Y., Wang, H., Liao, L., Ma, L., Zhao, Y., Yang, R., Li, X., Niu, J., Chu, Q., et al. (2024) · Nature Communications · doi:10.1038/s41467-024-51232-w · Cited by 70
Self-citationThe Role of SIRT3 in the Brain Under Physiological and Pathological Conditions
Sidorova‐Darmos, E., Sommer, R., & Eubanks, J. H. (2018) · Frontiers in Cellular Neuroscience · doi:10.3389/fncel.2018.00196 · Cited by 66
Modulation of cellular metabolism by protein crotonylation regulates pancreatic cancer progression
Zheng, Y., Le, Z., Qin, Z., Guo, Y., Wang, S., Xue, M., Shen, K.-Y., Hu, B., Wang, X., Wang, C., et al. (2023) · Cell Reports · doi:10.1016/j.celrep.2023.112666 · Cited by 67
Genetically Encoded Photoaffinity Histone Marks
Xie, X., Li, X., Lin, J., Lin, J., Zhang, G., Zhao, J., Bao, X., Zhu, R., Song, H., Li, X., et al. (2017) · Journal of the American Chemical Society · doi:10.1021/jacs.7b01431 · Cited by 65
Self-citationYuan, H., Zhao, M., Zhao, L., Yun, H., Yang, G., Geng, Y., Wang, Y.-F., Zheng, W., Yuan, Y., Song, T., et al. (2022) · Acta Pharmacologica Sinica · doi:10.1038/s41401-021-00841-y · Cited by 68
Self-citationLiao, W., Xu, N., Zhang, H., Liao, W., Wang, Y., Wang, S., Zhang, S., Jiang, Y., Xie, W., & Zhang, Y. (2022) · Clinical and Translational Medicine · doi:10.1002/ctm2.699 · Cited by 65
Self-citationZheng, Y., Gilgenast, M. J., Hauc, S. C., & Chatterjee, A. (2018) · ACS Chemical Biology · doi:10.1021/acschembio.8b00021 · Cited by 63
Hou, J., Cao, J., Gao, L., Zhang, F., Shen, J., Zhou, L., Shi, J., Feng, Y., Yan, Z., Wang, D., et al. (2021) · Biochemical and Biophysical Research Communications · doi:10.1016/j.bbrc.2021.09.027 · Cited by 63
Zhang, N., Wang, S., Zhao, S., Chen, D., Tian, H., Li, J., Zhang, L., Li, S., Liu, L., Shi, C., et al. (2023) · Science Advances · doi:10.1126/sciadv.adg1012 · Cited by 63
Identify and analysis crotonylation sites in histone by using support vector machines
Qiu, W., Sun, B., Tang, H., Huang, J. H., & Lin, H. (2017) · Artificial Intelligence in Medicine · doi:10.1016/j.artmed.2017.02.007 · Cited by 64
Tng, S. S., Le, N. Q. K., Yeh, H., & Chua, M. C. H. (2021) · Journal of Proteome Research · doi:10.1021/acs.jproteome.1c00848 · Cited by 62
Sirtuins and Renal Oxidative Stress
Ogura, Y., Kitada, M., & Koya, D. (2021) · Antioxidants · doi:10.3390/antiox10081198 · Cited by 61
Delaney, K., Tan, M., Zhu, Z., Gao, J., Dai, L., Kim, S., Ding, J., He, M., Halabelian, L., Yang, L., et al. (2021) · Cell Discovery · doi:10.1038/s41421-021-00344-4 · Cited by 60
Kudo, N., Ito, A., Arata, M., Nakata, A., & Yoshida, M. (2018) · Philosophical Transactions of the Royal Society B Biological Sciences · doi:10.1098/rstb.2017.0070 · Cited by 60
Current Trends in Sirtuin Activator and Inhibitor Development
Bursch, K. L., Goetz, C. J., & Smith, B. C. (2024) · Molecules · doi:10.3390/molecules29051185 · Cited by 60
Liao, M., Sun, X., Zheng, W., Wu, M., Wang, Y., Yao, J., Ma, Y., Gao, S., & Pei, D. (2023) · Molecular Cancer · doi:10.1186/s12943-023-01859-y · Cited by 58
Self-citationKwon, O. K., Kim, S. J., & Lee, S. (2018) · Scientific Reports · doi:10.1038/s41598-018-22069-3 · Cited by 59
A Novel Continuous Assay for the Deacylase Sirtuin 5 and Other Deacetylases
Roessler, C., Tüting, C., Meleshin, M., Steegborn, C., & Schutkowski, M. (2015) · Journal of Medicinal Chemistry · doi:10.1021/acs.jmedchem.5b00293 · Cited by 58
Sirtuins in Skin and Skin Cancers
Garcia‐Peterson, L. M., Wilking, M. J., Ndiaye, M. A., Philippe, C. G. A., Setaluri, V., & Ahmad, N. (2017) · Skin Pharmacology and Physiology · doi:10.1159/000477417 · Cited by 62
Tanabe, K., Liu, J., Kato, D., Kurumizaka, H., Yamatsugu, K., Kanai, M., & Kawashima, S. A. (2018) · Scientific Reports · doi:10.1038/s41598-018-21060-2 · Cited by 53
Metadata
- Authors
- Bao, X., Wang, Y., Li, X., Li, X.-M., Liu, Z., Yang, T., Wong, C. F., Zhang, J., Hao, Q., & Li, X. D.
- Affiliations
- University of Hong Kong (HK)
- Department of Chemistry, University of Hong Kong, Hong Kong, Hong Kong
- Corresponding author
- Hao, Quan
- Li, Xiang David
- Venue
- eLife
- Publisher
- eLife Sciences Publications, Ltd
- Published
- 2014-11-04
- Volume
- 3
- ISSN
- 2050-084X (ISSN-L)
- PMC
- PMC4358366
- OpenAlex
- W2109845335
- Cited by
- 324
- References
- 45
- Citations by year
- 2026: 23 · 2025: 27 · 2024: 31 · 2023: 28 · 2022: 29 · 2021: 44 · 2020: 18 · 2019: 18 · 2018: 32 · 2017: 25 · 2016: 31 · 2015: 16 · 2014: 2
- FWCI
- 10.11
- Type
- journal article
- Language
- en
- Open access
- gold
- doi.org
- Licence
- Locations
- eLife (publishedVersion, cc-by)
- Europe PMC (PubMed Central) (publishedVersion, cc-by)
- PubMed Central (publishedVersion, cc-by)
- PubMed (publishedVersion)
- DOAJ (DOAJ: Directory of Open Access Journals) (submittedVersion, cc-by-sa)
- The HKU Scholars Hub (University of Hong Kong) (submittedVersion, cc-by-nc-nd)
- Funders
- Research Grants Council, University Grants Committee, Hong Kong (Early Career Scheme, HKU 709813P, General Research Fund, GRF766510, General Research Fund, GRF17303114)
- University of Hong Kong (Hung Hing Ying Physical Science Research Fund, 20373739)
- Topics
- Life Sciences › Biochemistry, Genetics and Molecular Biology › Molecular Biology › Genomics and Chromatin Dynamics
- Life Sciences › Biochemistry, Genetics and Molecular Biology › Molecular Biology › Epigenetics and DNA Methylation
- Life Sciences › Biochemistry, Genetics and Molecular Biology › Molecular Biology › Histone Deacetylase Inhibitors Research
- Keywords
- lysine crotonylation, histone crotonylation, SIRT3, SIRT1, SIRT2, H3K4, histone modifications, transcriptional regulation, chemoproteomics
- MeSH terms
- Biotin, Crotonates, HeLa Cells, Histones, Humans, Hydrolysis, Isotope Labeling, Lysine, Models, Molecular, Peptides, Promoter Regions, Genetic, Protein Binding, Protein Processing, Post-Translational, Recombinant Proteins, Genome, Human, Streptavidin, Proteomics, Sirtuin 1, Sirtuin 2, Sirtuin 3, HEK293 Cells, Click Chemistry
About these checks
Registry, retraction, Cites and statistics results are computed, not judged, with one exception: a printed reference that no index lists is read once by a model before it counts as a citation error. Claims are extracted by a model and kept only when their quote appears verbatim in the text; each cited source is then checked, with a model’s help, for whether it says what the claim relies on. Those verdicts can be wrong — read the claim’s quote and the cited source before relying on one.
Statistics and arithmetic are recomputed, not judged.
Confidence bands are shown only for fields calibrated on our annotated test set. None is calibrated yet, so no band is shown.
What counts as a claim ›How we measure confidence ›How we check this ›
Are you an author, or do you see a problem with this page? Request a review
