Cited by 167Epigenetics and DNA MethylationGenomics and Chromatin DynamicsGenetic Syndromes and Imprinting

The DOI matches its Crossref record; 59 of the 59 references it cites were found in a registry or an index.

In vivo targeting of de novo DNA methylation by histone modifications in yeast and mouse

Open access

Abstract

Methylation of cytosines (5meC) is a widespread heritable DNA modification. During mammalian development, two global demethylation events are followed by waves of de novo DNA methylation. In vivo mechanisms of DNA methylation establishment are largely uncharacterized. Here, we use Saccharomyces cerevisiae as a system lacking DNA methylation to define the chromatin features influencing the activity of the murine DNMT3B. Our data demonstrate that DNMT3B and H3K4 methylation are mutually exclusive and that DNMT3B is co-localized with H3K36 methylated regions. In support of this observation, DNA methylation analysis in yeast strains without Set1 and Set2 shows an increase of relative 5meC levels at the transcription start site and a decrease in the gene-body, respectively. We extend our observation to the murine male germline, where H3K4me3 is strongly anti-correlated while H3K36me3 correlates with accelerated DNA methylation. These results show the importance of H3K36 methylation for gene-body DNA methylation in vivo.

Overview

The claims and statistics of this paper haven’t been checked yet.

Run the check — free, no account needed. It reads the open-access text and checks the sources it cites.

A few free checks a day · papers already verified open instantly · results are public

Integrity signals

Registry

Crossref · 10.7554/elife.06205

Cites

59 of 59 references verified0 citation errors · 0 not checkable

Statistics

Figures

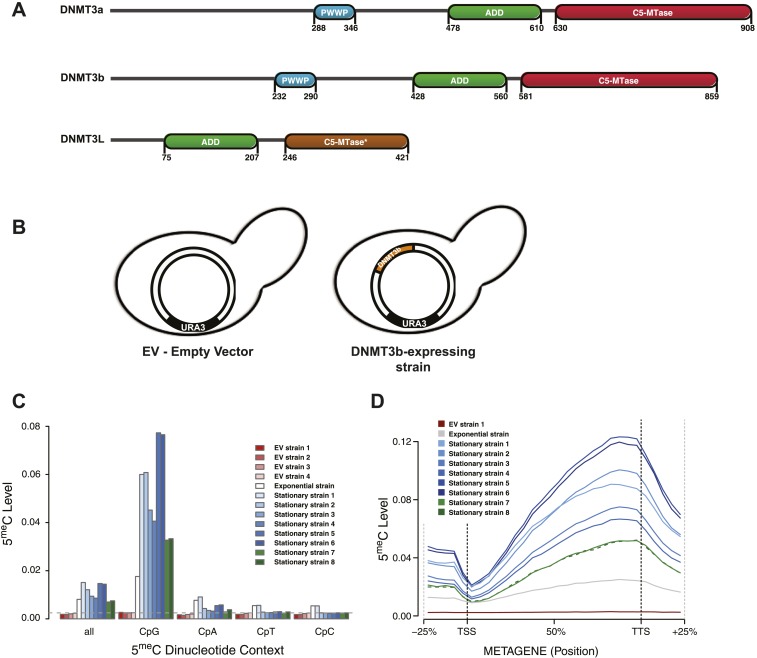
Figure 1. Distribution of induced DNA methylation in Saccharomyces cerevisiae. (A) Murine DNMT3 proteins with known domains: PWWP, ADD (ATRX–DNMT3–DNMT3L), and C-5 methyltransferase domain (not functional in DNMT3L). Accession numbers: DNMT3a = O88508; DNMT3b = O88509; DNMT3L = Q9CWR8. (B) Constructs used in this study. The empty vector (EV) is pYES2 (Life Technologies). DNMT3b expression is controlled by the GAL1 promoter. (C) Levels of 5meC in different dinucleotide contexts. The gray dotted line represents the unconversion rate. (D) Metagene plot of CpG methylation in cells expressing DNMT3b during logarithmic and stationary phase. EV (strain not expressing DNMT3b). Exponential and stationary strains 1–6 are derived from the W303 strain, while stationary strains 7 and 8 are in a BY4741 background. DOI: http://dx.doi.org/10.7554/eLife.06205.003
Figure 1. Distribution of induced DNA methylation in Saccharomyces cerevisiae. (A) Murine DNMT3 proteins with known domains: PWWP, ADD (ATRX–DNMT3–DNMT3L), and C-5 methyltransferase domain (not functional in DNMT3L). Accession numbers: DNMT3a = O88508; DNMT3b = O88509; DNMT3L = Q9CWR8. (B) Constructs used in this study. The empty vector (EV) is pYES2 (Life Technologies). DNMT3b expression is controlled by the GAL1 promoter. (C) Levels of 5meC in different dinucleotide contexts. The gray dotted line represents the unconversion rate. (D) Metagene plot of CpG methylation in cells expressing DNMT3b during logarithmic and stationary phase. EV (strain not expressing DNMT3b). Exponential and stationary strains 1–6 are derived from the W303 strain, while stationary strains 7 and 8 are in a BY4741 background. DOI: http://dx.doi.org/10.7554/eLife.06205.003CC BY · PubMed Central
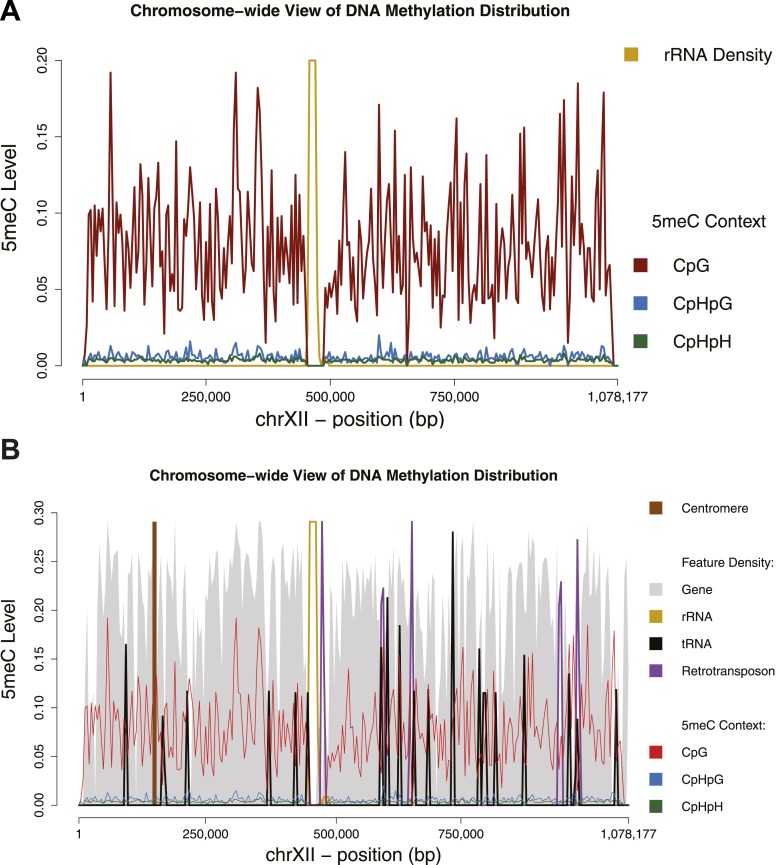
Figure 1—figure supplement 1. Chromosome-wide view of DNA methylation and genomic features. Distribution of DNA methylation on chromosome XII of S. cerevisiae (A and B). In (B) the density of other genomic features is shown (arbitrary units). Averages for DNA methylation and genomic features are calculated on 4 Kb bins. Areas of repetitive sequences (such as rRNA and transposable elements) show very little to no coverage. Gene-rich bins also correspond to peaks in DNA methylation levels. DOI: http://dx.doi.org/10.7554/eLife.06205.004
Figure 1—figure supplement 1. Chromosome-wide view of DNA methylation and genomic features. Distribution of DNA methylation on chromosome XII of S. cerevisiae (A and B). In (B) the density of other genomic features is shown (arbitrary units). Averages for DNA methylation and genomic features are calculated on 4 Kb bins. Areas of repetitive sequences (such as rRNA and transposable elements) show very little to no coverage. Gene-rich bins also correspond to peaks in DNA methylation levels. DOI: http://dx.doi.org/10.7554/eLife.06205.004CC BY · PubMed Central
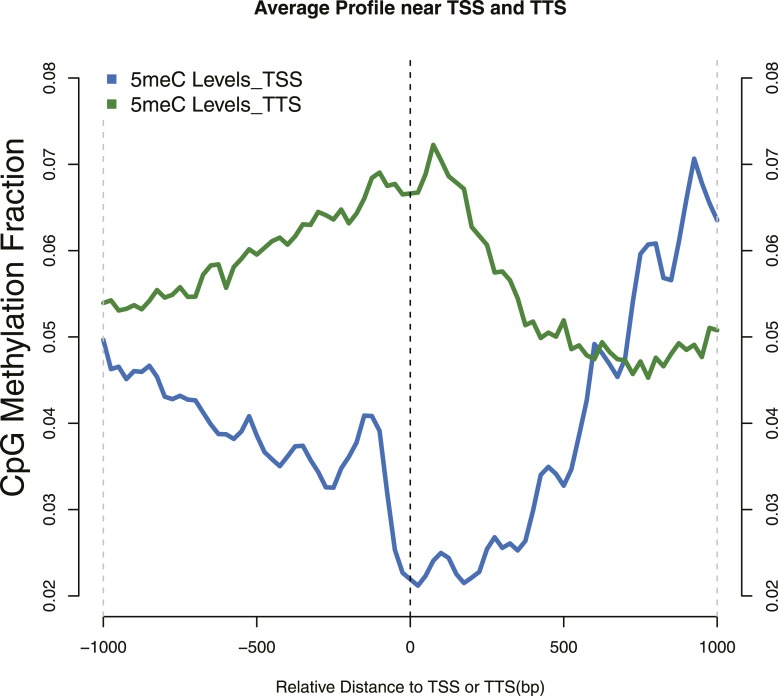
Figure 1—figure supplement 2. Distribution of 5meC around TSS and TTS. CpG methylation levels around (TSSs—blue) and (TTSs—green) of yeast genes. Periodic peaks of DNA methylation are evident at the TSS, where nucleosomes form a well positioned array. DOI: http://dx.doi.org/10.7554/eLife.06205.005
Figure 1—figure supplement 2. Distribution of 5meC around TSS and TTS. CpG methylation levels around (TSSs—blue) and (TTSs—green) of yeast genes. Periodic peaks of DNA methylation are evident at the TSS, where nucleosomes form a well positioned array. DOI: http://dx.doi.org/10.7554/eLife.06205.005CC BY · PubMed Central
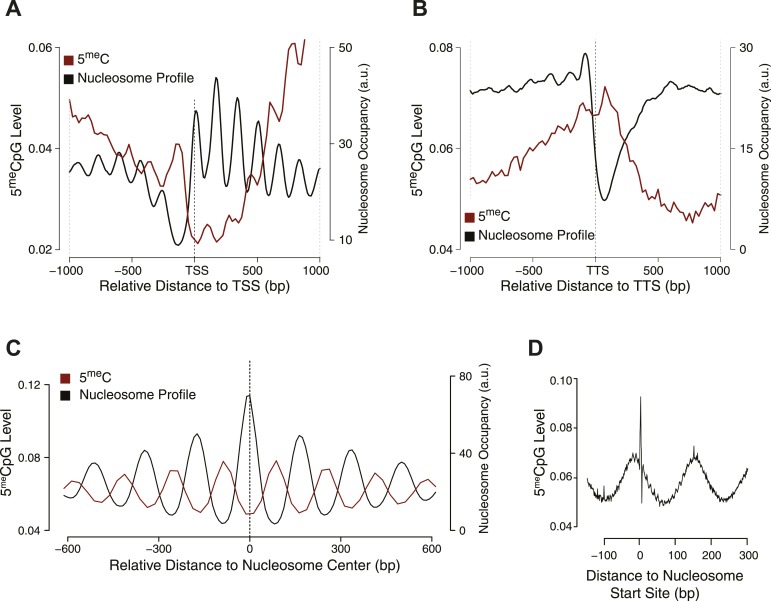
Figure 2. Influence of nucleosome positioning on DNA methylation. Average distribution of nucleosomes and DNA methylation (CpG context) around (A) Transcriptional Start Site (TSS), (B) Transcriptional Termination Site (TTS), and (C) nucleosome centers. (D) Meta-nucleosome plot of CpG methylation. a.u. = Arbitrary units. DOI: http://dx.doi.org/10.7554/eLife.06205.006
Figure 2. Influence of nucleosome positioning on DNA methylation. Average distribution of nucleosomes and DNA methylation (CpG context) around (A) Transcriptional Start Site (TSS), (B) Transcriptional Termination Site (TTS), and (C) nucleosome centers. (D) Meta-nucleosome plot of CpG methylation. a.u. = Arbitrary units. DOI: http://dx.doi.org/10.7554/eLife.06205.006CC BY · PubMed Central
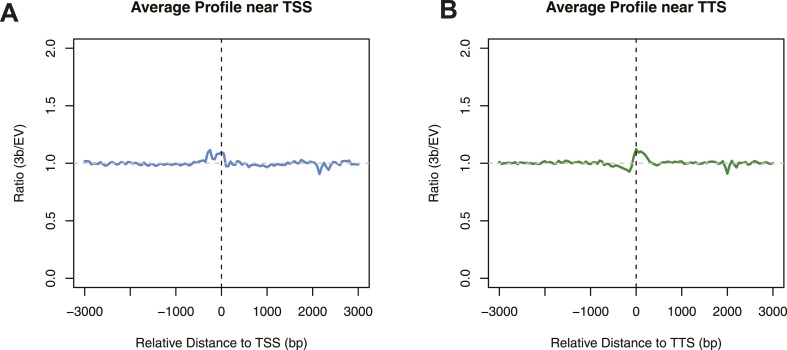
Figure 2—figure supplement 1. Differences in nucleosome occupancy between DNMT3b-expressing and non-expressing yeast strains. Ratio of nucleosome occupancy between DNMT3b-expressing (3b) and non-expressing (EV) yeast strains at TSS (A) and TTS (B). DOI: http://dx.doi.org/10.7554/eLife.06205.007
Figure 2—figure supplement 1. Differences in nucleosome occupancy between DNMT3b-expressing and non-expressing yeast strains. Ratio of nucleosome occupancy between DNMT3b-expressing (3b) and non-expressing (EV) yeast strains at TSS (A) and TTS (B). DOI: http://dx.doi.org/10.7554/eLife.06205.007CC BY · PubMed Central
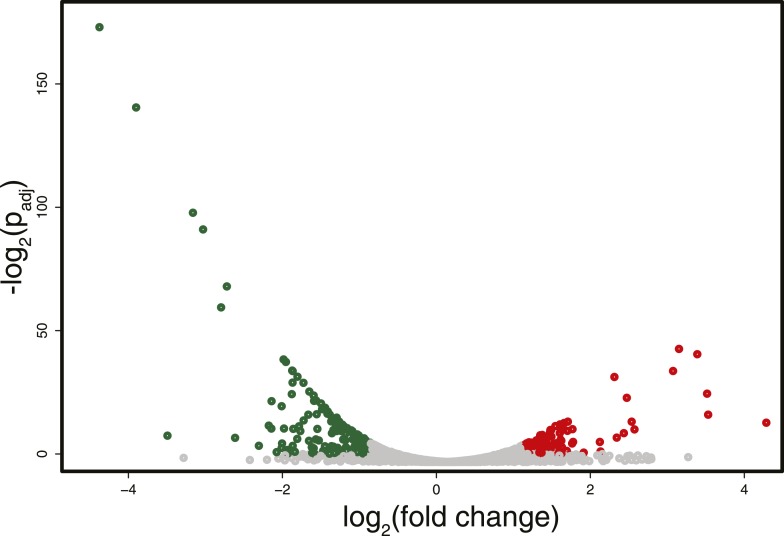
Figure 3. Differences in RNA expression between DNMT3b-expressing and non-expressing yeast strains. The expression difference in RNA expression between DNMT3b and EV strains is plotted on the x axis, and false discovery rate (FDR)-adjusted significance is plotted on the y-axis (–log2 scale). Upregulated and downregulated RNAs shown in red and green, respectively. Significantly expressed RNAs have a fold change bigger than two with a FDR smaller than 0.1. DOI: http://dx.doi.org/10.7554/eLife.06205.008
Figure 3. Differences in RNA expression between DNMT3b-expressing and non-expressing yeast strains. The expression difference in RNA expression between DNMT3b and EV strains is plotted on the x axis, and false discovery rate (FDR)-adjusted significance is plotted on the y-axis (–log2 scale). Upregulated and downregulated RNAs shown in red and green, respectively. Significantly expressed RNAs have a fold change bigger than two with a FDR smaller than 0.1. DOI: http://dx.doi.org/10.7554/eLife.06205.008CC BY · PubMed Central
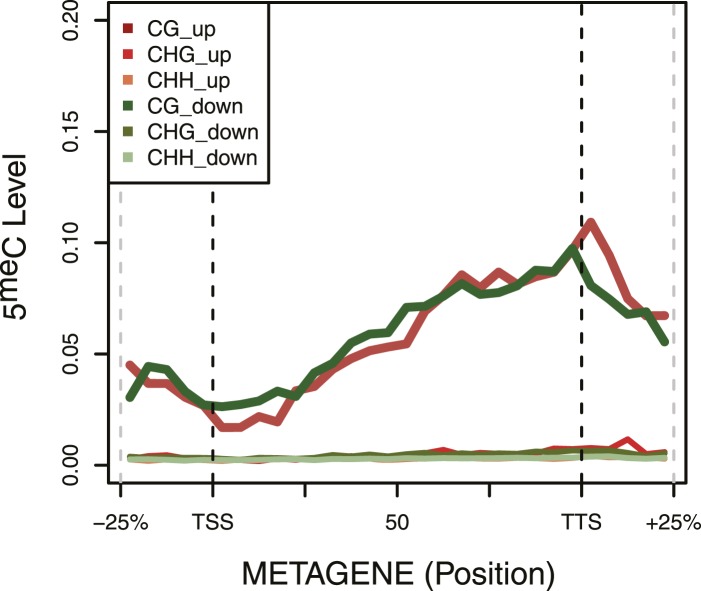
Figure 3—figure supplement 1. DNA Methylation in up- and down-regulated genes. Metagene plot of 5meC in different contexts (CpG, CpHpG, CpHpH) of upregulated (red) and downregulated (green) genes. DOI: http://dx.doi.org/10.7554/eLife.06205.009
Figure 3—figure supplement 1. DNA Methylation in up- and down-regulated genes. Metagene plot of 5meC in different contexts (CpG, CpHpG, CpHpH) of upregulated (red) and downregulated (green) genes. DOI: http://dx.doi.org/10.7554/eLife.06205.009CC BY · PubMed Central
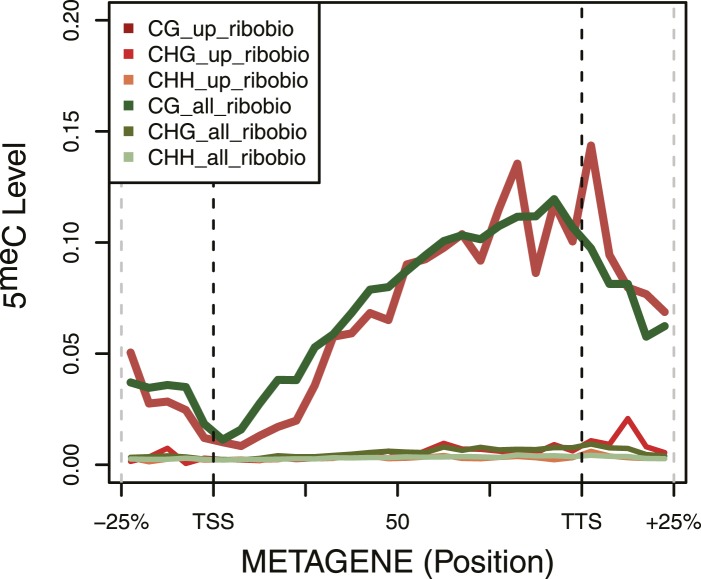
Figure 3—figure supplement 2. DNA Methylation in ribosomal biogenesis genes. Metagene plot of 5meC in different contexts (CpG, CpHpG, CpHpH) of upregulated ribosomal biogenesis genes (red) compared to all the genes of the same class (green). DOI: http://dx.doi.org/10.7554/eLife.06205.010
Figure 3—figure supplement 2. DNA Methylation in ribosomal biogenesis genes. Metagene plot of 5meC in different contexts (CpG, CpHpG, CpHpH) of upregulated ribosomal biogenesis genes (red) compared to all the genes of the same class (green). DOI: http://dx.doi.org/10.7554/eLife.06205.010CC BY · PubMed Central
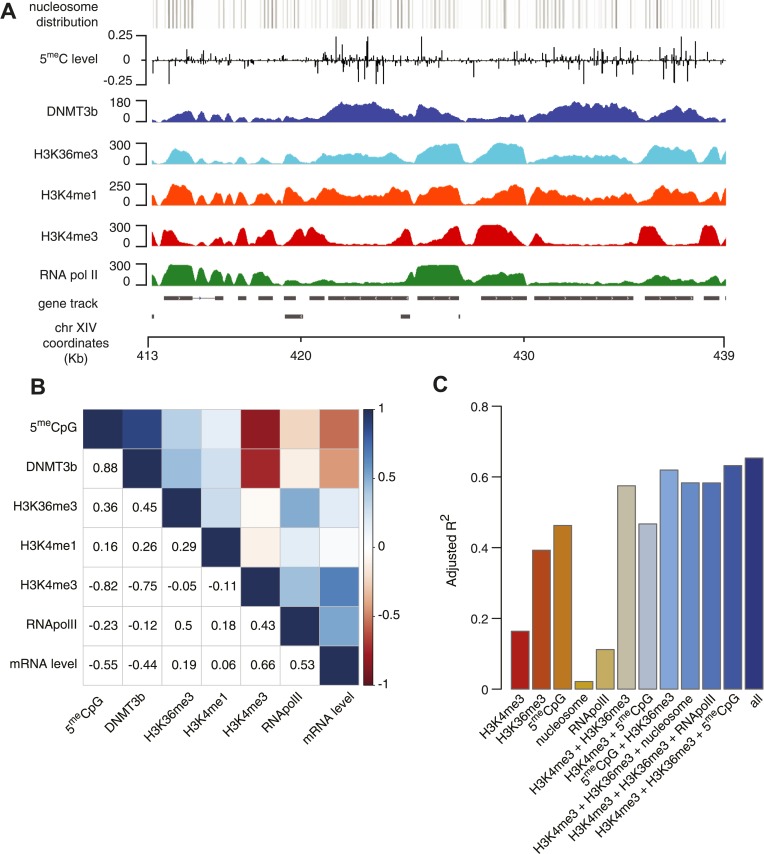
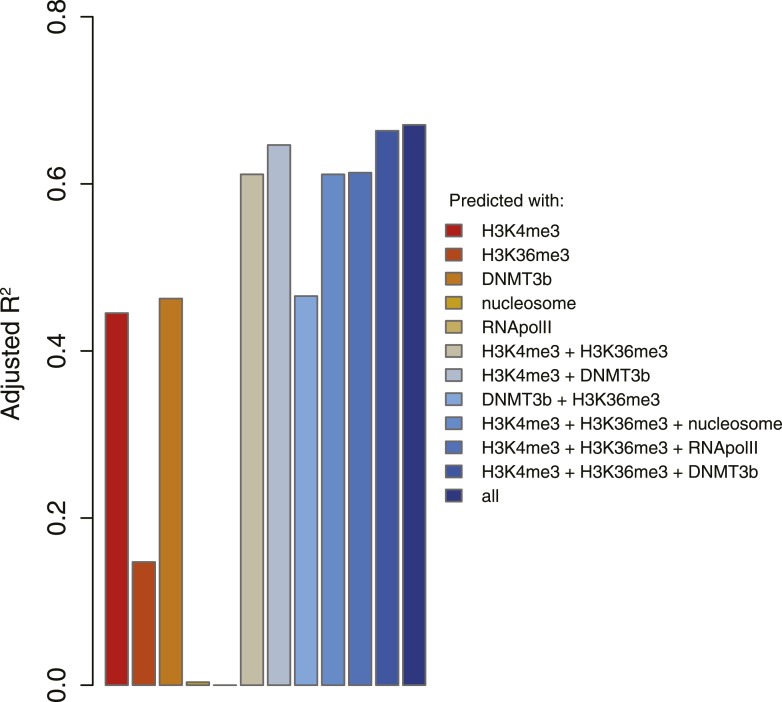
Figure 4. Correlation between histone marks and DNA methylation. (A) Genome-wide distribution of nucleosome, 5meC, DNMT3b, H3K36me3, H3K4me1, H3K4me3, and RNA polymerase II. (B) Spearman correlation coefficients between 5meC, histone marks, RNA polymerase II, DNMT3b and mRNA average levels for protein coding genes. (C) Prediction of DNMT3b levels using DNA methylation, H3K4 and H3K36 trimethylation, RNA polymerase II and nucleosome distribution as predictors. The y-axis shows the adjusted R2 value between the predicted linear model and observed values. DOI: http://dx.doi.org/10.7554/eLife.06205.011
Figure 4. Correlation between histone marks and DNA methylation. (A) Genome-wide distribution of nucleosome, 5meC, DNMT3b, H3K36me3, H3K4me1, H3K4me3, and RNA polymerase II. (B) Spearman correlation coefficients between 5meC, histone marks, RNA polymerase II, DNMT3b and mRNA average levels for protein coding genes. (C) Prediction of DNMT3b levels using DNA methylation, H3K4 and H3K36 trimethylation, RNA polymerase II and nucleosome distribution as predictors. The y-axis shows the adjusted R2 value between the predicted linear model and observed values. DOI: http://dx.doi.org/10.7554/eLife.06205.011CC BY · PubMed Central
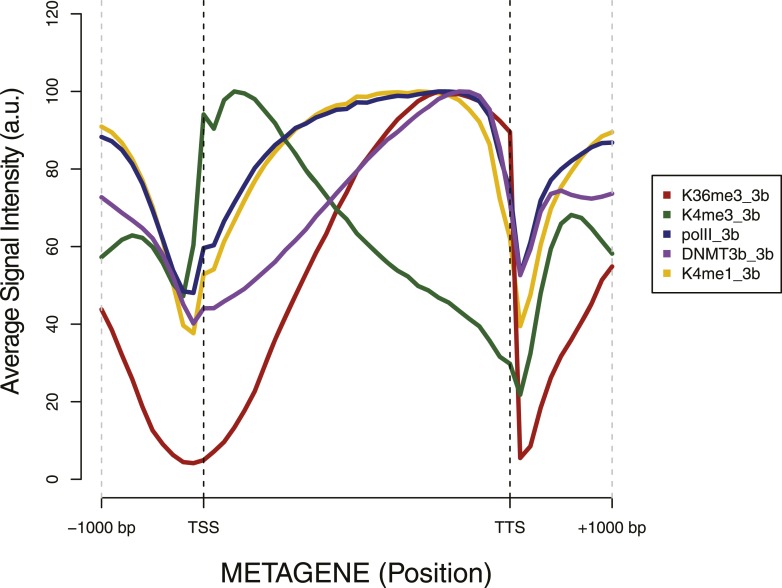
Figure 4—figure supplement 1. Metagene plot of ChIP sequencing in a DNMT3b-expressing strain. ChIP-seq reads average intensity across yeast genes and 1 Kb upstream and downstream. DOI: http://dx.doi.org/10.7554/eLife.06205.012
Figure 4—figure supplement 1. Metagene plot of ChIP sequencing in a DNMT3b-expressing strain. ChIP-seq reads average intensity across yeast genes and 1 Kb upstream and downstream. DOI: http://dx.doi.org/10.7554/eLife.06205.012CC BY · PubMed Central
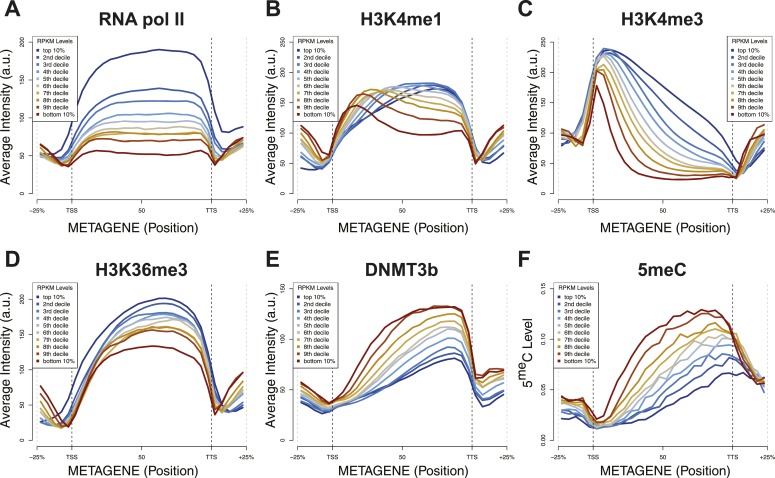
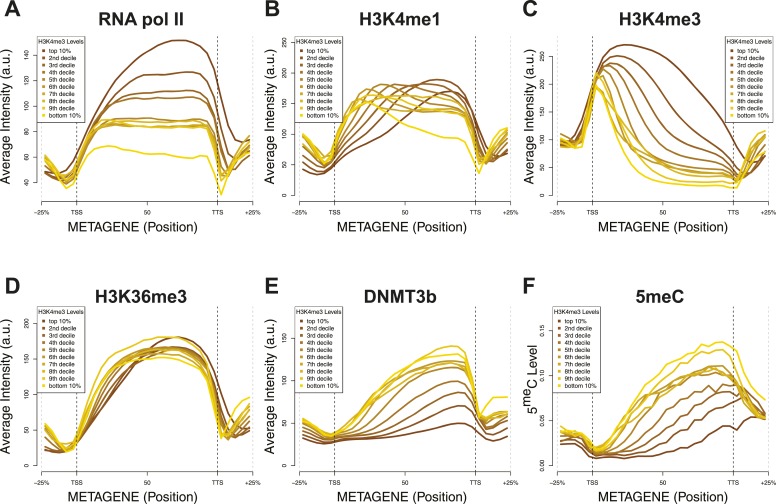
Figure 4—figure supplement 2. Relationship between transcription and 5meC or histone marks levels. Average ChIP-seq intensity (A–E) or 5meC levels (F) across yeast genes divided in deciles based on RNA values (RPKM). a.u. = Arbitrary units. DOI: http://dx.doi.org/10.7554/eLife.06205.013
Figure 4—figure supplement 2. Relationship between transcription and 5meC or histone marks levels. Average ChIP-seq intensity (A–E) or 5meC levels (F) across yeast genes divided in deciles based on RNA values (RPKM). a.u. = Arbitrary units. DOI: http://dx.doi.org/10.7554/eLife.06205.013CC BY · PubMed Central
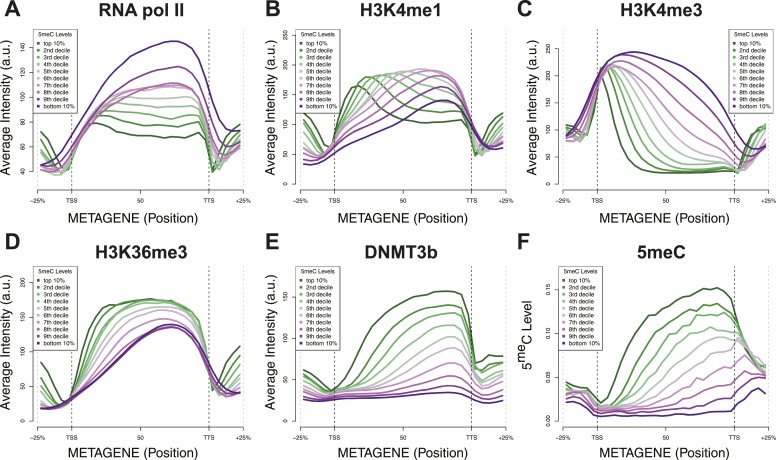
Figure 4—figure supplement 3. Relationship between DNA methylation and histone marks levels. Average ChIP-seq (A–E) or DNA methylation (F) distribution across yeast genes divided in deciles based on average 5meCpG intragenic levels. a.u. = Arbitrary units. DOI: http://dx.doi.org/10.7554/eLife.06205.014
Figure 4—figure supplement 3. Relationship between DNA methylation and histone marks levels. Average ChIP-seq (A–E) or DNA methylation (F) distribution across yeast genes divided in deciles based on average 5meCpG intragenic levels. a.u. = Arbitrary units. DOI: http://dx.doi.org/10.7554/eLife.06205.014CC BY · PubMed Central
Figure 4—figure supplement 4. Relationship between H3K4me3 and 5meC or histone marks levels. Average ChIP-seq intensity (A–E) or 5meC levels (F) across yeast genes divided in deciles based on H3K4me3 average in the last third of each gene. a.u. = Arbitrary units. DOI: http://dx.doi.org/10.7554/eLife.06205.015
Figure 4—figure supplement 4. Relationship between H3K4me3 and 5meC or histone marks levels. Average ChIP-seq intensity (A–E) or 5meC levels (F) across yeast genes divided in deciles based on H3K4me3 average in the last third of each gene. a.u. = Arbitrary units. DOI: http://dx.doi.org/10.7554/eLife.06205.015CC BY · PubMed Central
Figure 4—figure supplement 5. 5meC levels prediction using chromatin marks. Prediction of 5meC levels across the genome divided in 200-bp bins with a linear multivariate regression method using several combinations of chromatin marks. On the y-axis the adjusted R2 value is reported. DOI: http://dx.doi.org/10.7554/eLife.06205.016
Figure 4—figure supplement 5. 5meC levels prediction using chromatin marks. Prediction of 5meC levels across the genome divided in 200-bp bins with a linear multivariate regression method using several combinations of chromatin marks. On the y-axis the adjusted R2 value is reported. DOI: http://dx.doi.org/10.7554/eLife.06205.016CC BY · PubMed Central
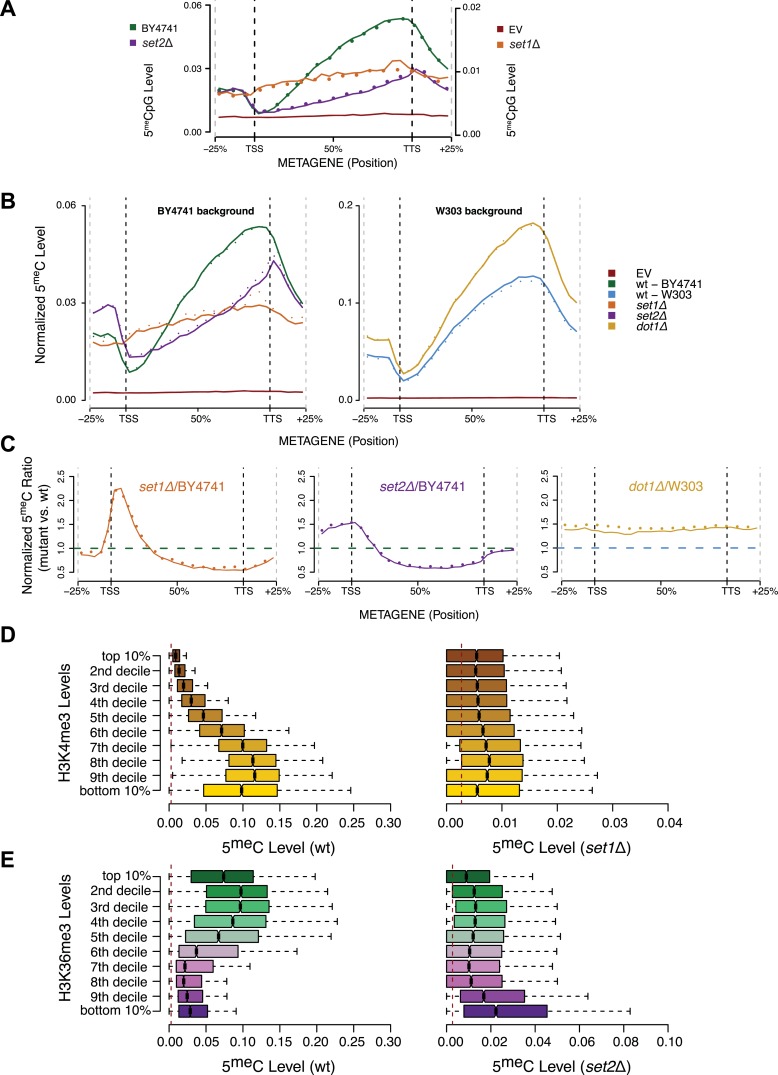
Figure 5. Effect of histone lysine methyltransferase deletions on the distribution of DNA methylation. (A) Metagene plot of CpG methylation in set1Δ and set2Δ cells expressing DNMT3b. Differently from Figure 5B, 5meC levels are not normalized. Replicates of the same strain are represented as dotted lines. Data from BY4741-derived strains. BY4741 = Wild type (wt); EV = Empty vector. (B) Metagene plot of CpG methylation in set1Δ, set2Δ, and dot1Δ cells expressing DNMT3b. set1Δ, set2Δ are in a BY4741 background, while dot1Δ is in a W303 background. 5meC levels are normalized by DNMT3b expression measured by RT-qPCR. Two replicates for each strain are shown (solid and dotted line). (C) Metagene plots of CpG methylation ratio between the mutant and its wt counterpart. Two replicates for each mutant strain are shown (solid and dotted line). Wt ratios (=1) are represented by the horizontal dashed line (green or blue). (D) Boxplots showing levels of DNA methylation in the wt (left) and set1Δ strain (right) of 200-bp genome bins sorted into deciles by H3K4me3 level. (E) Boxplots showing levels of DNA methylation in the wt (left) and set2Δ strain (right) of 200-bp genome bins sorted into deciles by H3K36me3 level. The dashed red line represents background levels of DNA methylation due to incomplete bisulfite conversion (>99.7%). DOI: http://dx.doi.org/10.7554/eLife.06205.017
Figure 5. Effect of histone lysine methyltransferase deletions on the distribution of DNA methylation. (A) Metagene plot of CpG methylation in set1Δ and set2Δ cells expressing DNMT3b. Differently from Figure 5B, 5meC levels are not normalized. Replicates of the same strain are represented as dotted lines. Data from BY4741-derived strains. BY4741 = Wild type (wt); EV = Empty vector. (B) Metagene plot of CpG methylation in set1Δ, set2Δ, and dot1Δ cells expressing DNMT3b. set1Δ, set2Δ are in a BY4741 background, while dot1Δ is in a W303 background. 5meC levels are normalized by DNMT3b expression measured by RT-qPCR. Two replicates for each strain are shown (solid and dotted line). (C) Metagene plots of CpG methylation ratio between the mutant and its wt counterpart. Two replicates for each mutant strain are shown (solid and dotted line). Wt ratios (=1) are represented by the horizontal dashed line (green or blue). (D) Boxplots showing levels of DNA methylation in the wt (left) and set1Δ strain (right) of 200-bp genome bins sorted into deciles by H3K4me3 level. (E) Boxplots showing levels of DNA methylation in the wt (left) and set2Δ strain (right) of 200-bp genome bins sorted into deciles by H3K36me3 level. The dashed red line represents background levels of DNA methylation due to incomplete bisulfite conversion (>99.7%). DOI: http://dx.doi.org/10.7554/eLife.06205.017CC BY · PubMed Central
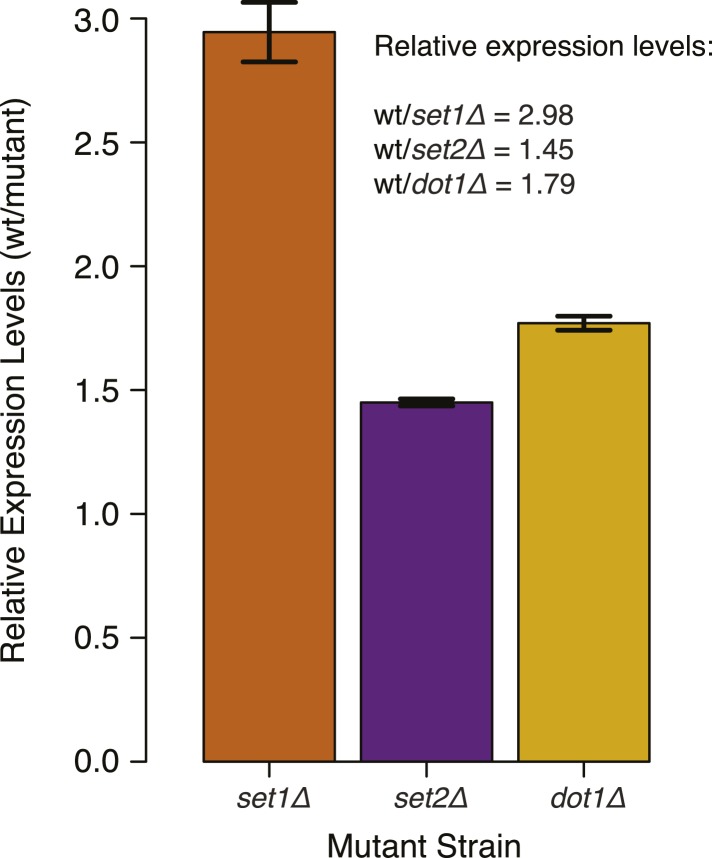
Figure 5—figure supplement 1. DNMT3b transcript levels in different yeast strains. Expression levels of DNMT3b of the wild-type strain compared to yeast mutants (set1Δ, set2Δ, and dot1Δ). The relative levels were calculated using the ΔΔCt method (Schmittgen and Livak, 2008) using TDH1 gene as reference. DNA methylation levels of each mutant used to produce Figure 5B,C were linearly scaled according to the reported averages of RT-qPCR replicates. DOI: http://dx.doi.org/10.7554/eLife.06205.018
Figure 5—figure supplement 1. DNMT3b transcript levels in different yeast strains. Expression levels of DNMT3b of the wild-type strain compared to yeast mutants (set1Δ, set2Δ, and dot1Δ). The relative levels were calculated using the ΔΔCt method (Schmittgen and Livak, 2008) using TDH1 gene as reference. DNA methylation levels of each mutant used to produce Figure 5B,C were linearly scaled according to the reported averages of RT-qPCR replicates. DOI: http://dx.doi.org/10.7554/eLife.06205.018CC BY · PubMed Central
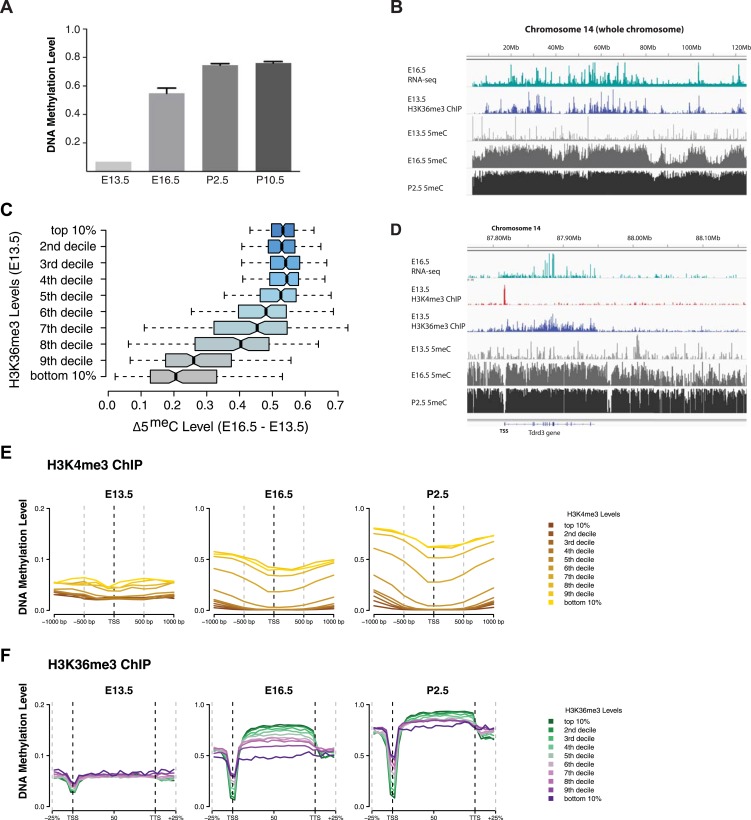
Figure 6. H3K4me3 and H3K36me3 distribution predicts de novo DNA methylation pattern in male germline. (A) Genome-wide CG methylation levels during murine development as measured by bisulfite sequencing. (B) RNA-seq, and ChIP read abundance and relative DNA methylation levels are plotted across chromosome 14. Note the correspondence between RNA-seq and H3K36me3 ChIP levels and rapid DNA methylation between E13.5 and E16.5. (C) Boxplots showing the difference of DNA methylation levels between E13.5 and E16.5 of 1 Mb genome bins sorted into deciles by H3K36me3 level. (D) RNA-seq and ChIP read abundance and DNA methylation levels are plotted relative to transcriptionally active genes. The gene promoters contain high H3K4me3 and are not methylated, while the gene bodies contain high H3K36me3 and are methylated rapidly. (E) Metaplots showing DNA methylation level ±1000 bp relative to the TSS of genes sorted into deciles by H3K4me3 level. (F) Metagene plots showing DNA methylation across gene bodies sorted into deciles by H3K36me3 level. DOI: http://dx.doi.org/10.7554/eLife.06205.019
Figure 6. H3K4me3 and H3K36me3 distribution predicts de novo DNA methylation pattern in male germline. (A) Genome-wide CG methylation levels during murine development as measured by bisulfite sequencing. (B) RNA-seq, and ChIP read abundance and relative DNA methylation levels are plotted across chromosome 14. Note the correspondence between RNA-seq and H3K36me3 ChIP levels and rapid DNA methylation between E13.5 and E16.5. (C) Boxplots showing the difference of DNA methylation levels between E13.5 and E16.5 of 1 Mb genome bins sorted into deciles by H3K36me3 level. (D) RNA-seq and ChIP read abundance and DNA methylation levels are plotted relative to transcriptionally active genes. The gene promoters contain high H3K4me3 and are not methylated, while the gene bodies contain high H3K36me3 and are methylated rapidly. (E) Metaplots showing DNA methylation level ±1000 bp relative to the TSS of genes sorted into deciles by H3K4me3 level. (F) Metagene plots showing DNA methylation across gene bodies sorted into deciles by H3K36me3 level. DOI: http://dx.doi.org/10.7554/eLife.06205.019CC BY · PubMed Central
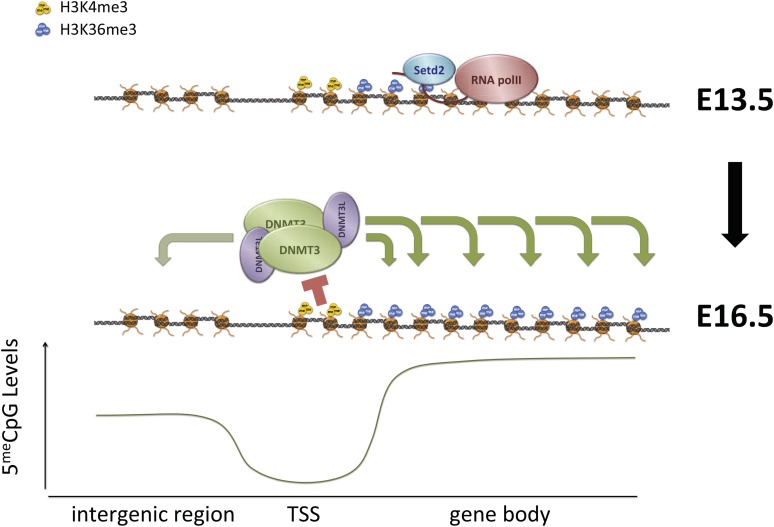
Figure 7. Proposed model for de novo DNA methylation establishment. Model proposed for the targeting of DNMT3 during events of de novo 5meC establishment after genome-wide erasure of DNA methylation. Our model suggests that the presence of transcription-dependent histone modifications, such as H3K4me3 and H3K36me3, determines the activity of DNMT3b in vivo. DOI: http://dx.doi.org/10.7554/eLife.06205.020
Figure 7. Proposed model for de novo DNA methylation establishment. Model proposed for the targeting of DNMT3 during events of de novo 5meC establishment after genome-wide erasure of DNA methylation. Our model suggests that the presence of transcription-dependent histone modifications, such as H3K4me3 and H3K36me3, determines the activity of DNMT3b in vivo. DOI: http://dx.doi.org/10.7554/eLife.06205.020CC BY · PubMed Central
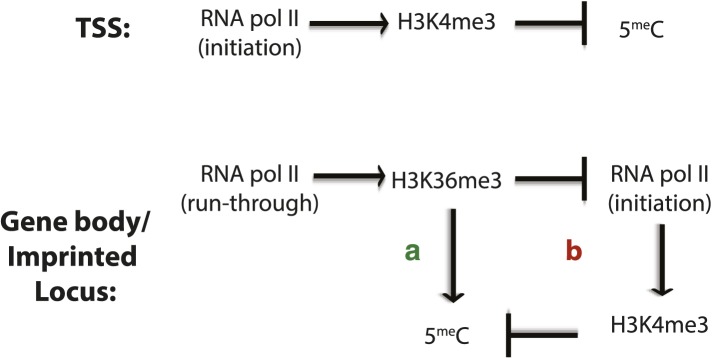
Figure 7—figure supplement 1. Factors affecting DNA methylation deposition. (Top) DNA methylation is negatively affected by H3K4me3 at the TSS. (Bottom) H3K36me3 promotes DNA methylation by (A) direct recruitment of DNMT3b and by (B) preventing the methylation of H3K4, which antagonizes 5meC deposition. DOI: http://dx.doi.org/10.7554/eLife.06205.021
Figure 7—figure supplement 1. Factors affecting DNA methylation deposition. (Top) DNA methylation is negatively affected by H3K4me3 at the TSS. (Bottom) H3K36me3 promotes DNA methylation by (A) direct recruitment of DNMT3b and by (B) preventing the methylation of H3K4, which antagonizes 5meC deposition. DOI: http://dx.doi.org/10.7554/eLife.06205.021CC BY · PubMed Central

Verification

Claims the paper makes

The claims and statistics of this paper haven’t been checked yet.

Run the check — free, no account needed. It reads the open-access text and checks the sources it cites.

A few free checks a day · papers already verified open instantly · results are public

Claims other papers make about this one

Each is checked against this paper’s own text: does it say what the citing paper says it does?

Self-check

Percentages, sums and reported differences re-computed from the paper’s own numbers.

The self-check needs the paper’s full text.

Citations

Cites

Show all 59 references

Cited by

Sorted by citations

See all 167

Metadata

Authors
Morselli, M., Pastor, W. A., Montanini, B., Nee, K., Ferrari, R., Fu, K., Bonora, G., Rubbi, L., Clark, A. T., Ottonello, S., Jacobsen, S. E., & Pellegrini, M.
Affiliations
  • University of California, Los Angeles (US)
  • University of Parma (IT)
  • Howard Hughes Medical Institute (US)
Corresponding author
  • Morselli, Marco
  • Jacobsen, Steven E
  • Pellegrini, Matteo
Venue
eLife
Published
2015-04-07
Volume
4
Pages
e06205-e06205
ISSN
2050-084X (ISSN-L)
OpenAlex
W2087785865
Cited by
167
References
59
Citations by year
2026: 7 · 2025: 9 · 2024: 11 · 2023: 17 · 2022: 10 · 2021: 16 · 2020: 19 · 2019: 22 · 2018: 16 · 2017: 17 · 2016: 13 · 2015: 10
FWCI
8.10
Type
journal article
Language
en
Open access
Locations
  • eLife (publishedVersion, cc-by)
  • Europe PMC (PubMed Central) (publishedVersion, cc-by)
  • PubMed Central (publishedVersion, cc-by)
  • PubMed (publishedVersion)
  • Institutional Research Information System University of Ferrara (University of Ferrara) (submittedVersion, cc-by)
  • DOAJ (DOAJ: Directory of Open Access Journals) (submittedVersion, cc-by-sa)
  • eScholarship (California Digital Library) (submittedVersion)
  • eScholarship (California Digital Library) (submittedVersion, cc-by)
Funders
  • National Institutes of Health (NIH) (R01 GM095656-01A1, GM60398)
  • National Institute of Child Health and Human Development (NICHD) (R01HD058047)
  • Howard Hughes Medical Institute (HHMI)
  • Jane Coffin Childs Memorial Fund for Medical Research
  • Whitcome Fellowship
Topics
  • Life Sciences › Biochemistry, Genetics and Molecular Biology › Molecular Biology › Epigenetics and DNA Methylation
  • Life Sciences › Biochemistry, Genetics and Molecular Biology › Molecular Biology › Genomics and Chromatin Dynamics
  • Life Sciences › Biochemistry, Genetics and Molecular Biology › Genetics › Genetic Syndromes and Imprinting
Keywords
de novo methylation, histone modifications, DNMT3B, H3K4 methylation, H3K36 methylation, Saccharomyces cerevisiae, Set1, Set2, gene body methylation, transcription start sites, male germline, chromatin
MeSH terms
DNA Methyltransferase 3B, Animals, Chromatin, Cytosine, DNA (Cytosine-5-)-Methyltransferases, Embryo, Mammalian, Genetic Vectors, Germ Cells, Histones, Male, Methyltransferases, Histone-Lysine N-Methyltransferase, Saccharomyces cerevisiae, Transformation, Genetic, Signal Transduction, Open Reading Frames, Gene Expression Regulation, Developmental, CpG Islands, DNA Methylation, Protein Isoforms, Transcription Initiation Site, Saccharomyces cerevisiae Proteins, Mice

About these checks

Registry, retraction, Cites and statistics results are computed, not judged, with one exception: a printed reference that no index lists is read once by a model before it counts as a citation error. Claims are extracted by a model and kept only when their quote appears verbatim in the text; each cited source is then checked, with a model’s help, for whether it says what the claim relies on. Those verdicts can be wrong — read the claim’s quote and the cited source before relying on one.

Statistics and arithmetic are recomputed, not judged.

Confidence bands are shown only for fields calibrated on our annotated test set. None is calibrated yet, so no band is shown.

What counts as a claim ›How we measure confidence ›How we check this ›

Are you an author, or do you see a problem with this page? Request a review