Student or educator? Sign up with your school email and get 6 months of Pro free.
Cited by 0Ion channel regulation and functionAdvanced Fluorescence Microscopy TechniquesProtein Structure and Dynamics

The DOI matches its Crossref record; 42 of the 42 references it cites were found in a registry or an index.

Interrogating the structure and function of the human voltage-gated proton channel (hHv1) with a fluorescent noncanonical amino acid

Open access

Published version of a preprint

Abstract

The human voltage-gated proton channel (hH v 1) is a dimer of voltage-sensor domains (VSDs) containing highly selective proton permeation pathways in each monomer. In addition to voltage, hH v 1 is regulated by other stimuli, including pH gradients, mechanical forces, and ligands, such as Zn 2+ . Aside from the VSDs, this membrane protein contains an N-terminal domain and a C-terminal coiled-coil domain (CC) formed between the monomers. To address the need for direct measurements of conformational rearrangements in hH v 1, we developed a Förster resonance energy transfer (FRET) approach to measuring the conformational rearrangements in full-length hH v 1 purified from E. coli . We used genetic code expansion (GCE) to generate a library of 14 full-length hH v 1 constructs, each incorporating the fluorescent noncanonical amino acid acridon-2-ylalanine (Acd) at a different site throughout the various structural domains. Following the expression and purification of these hH v 1-Acd proteins, we found that 12 sites yielded stable and functional proton-permeable channels. The fluorescence properties of Acd at each site showed small site-specific differences. Furthermore, we measured site-specific FRET efficiencies from tryptophan (Trp) and tyrosine (Tyr) to Acd in the hH v 1-Acd proteins and found results consistent with correct folding in detergent micelles. Finally, the addition of Zn 2+ produced reversible changes in FRET, with affected residues clustered on the intracellular side of the channel.

Overview

The claims and statistics of this paper haven’t been checked yet.

Run the check — free, no account needed. It reads the open-access text and checks the sources it cites.

A few free checks a day · papers already verified open instantly · results are public

Integrity signals

Registry

Crossref · 10.7554/elife.110161

Cites

42 of 42 references verified0 citation errors · 0 not checkable

Statistics

Figures

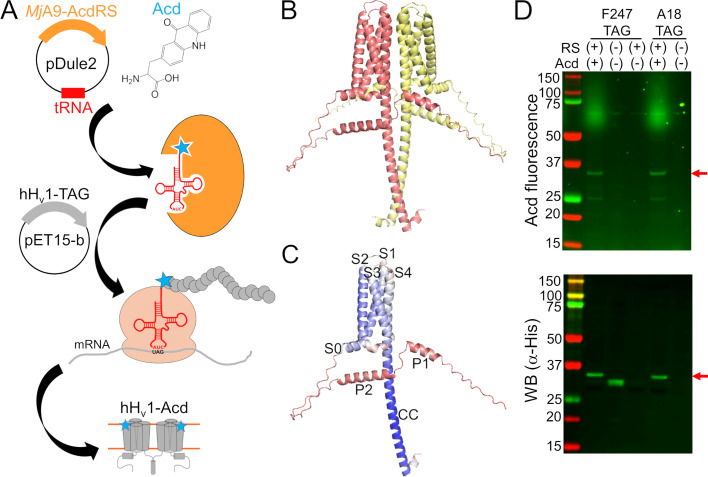
Figure 1. Human voltage-gated proton channel (hHv1) was labeled with the fluorescent noncanonical amino acid acridon-2-ylalanine (Acd) by genetic code expansion. (A) Cartoon showing the components of the genetic code expansion system used to incorporate Acd via amber codon suppression in hHv1. (B) AlphaFold structural model of the dimer hHv1 colored by subunit. (C) AlphaFold structural model of a single hHv1 subunit colored by the predicted Local Distance Difference Test (pLDDT). Model confidence was represented by a gradient from red to blue, indicating low to high pLDDT. (D) In-gel fluorescence and Western blot to evaluate Acd incorporation. An Acd fluorescence band corresponding to the molecular weight of full-length hHv1 (red arrow) was observed in cellular extracts after separation by SDS-PAGE only when cells contained the MjA9-AcdRS/tRNA plasmid (RS) and were grown in the presence of 1 mM Acd (top). The Western blot against the His-tag present at the N-terminus of hHv1 confirmed that the band corresponded to the recombinant protein (bottom). Note the hHv1 truncated product produced when the amber stop codon is replacing F247 in the absence of the aminoacyl-tRNA synthetase/tRNA plasmid and Acd.
Figure 1. Human voltage-gated proton channel (hHv1) was labeled with the fluorescent noncanonical amino acid acridon-2-ylalanine (Acd) by genetic code expansion. (A) Cartoon showing the components of the genetic code expansion system used to incorporate Acd via amber codon suppression in hHv1. (B) AlphaFold structural model of the dimer hHv1 colored by subunit. (C) AlphaFold structural model of a single hHv1 subunit colored by the predicted Local Distance Difference Test (pLDDT). Model confidence was represented by a gradient from red to blue, indicating low to high pLDDT. (D) In-gel fluorescence and Western blot to evaluate Acd incorporation. An Acd fluorescence band corresponding to the molecular weight of full-length hHv1 (red arrow) was observed in cellular extracts after separation by SDS-PAGE only when cells contained the MjA9-AcdRS/tRNA plasmid (RS) and were grown in the presence of 1 mM Acd (top). The Western blot against the His-tag present at the N-terminus of hHv1 confirmed that the band corresponded to the recombinant protein (bottom). Note the hHv1 truncated product produced when the amber stop codon is replacing F247 in the absence of the aminoacyl-tRNA synthetase/tRNA plasmid and Acd.CC BY · PubMed Central
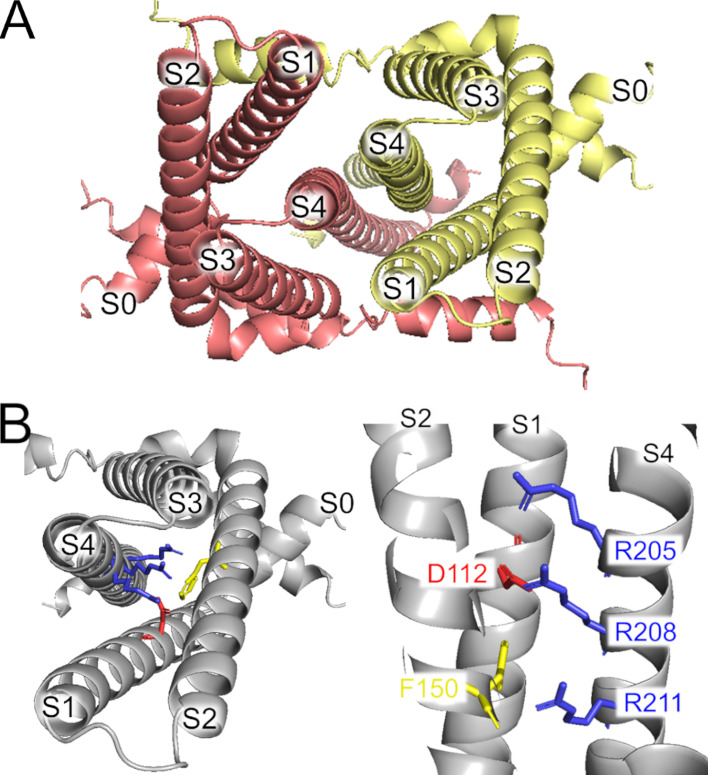
Figure 1—figure supplement 1. AlphaFold dimer human voltage-gated proton channel (hHv1) structural model. (A) Extracellular view of the model, showing each subunit in a different color. (B) One subunit of the dimer showing the position of the arginine gating charges in S4 (blue), the selectivity filter (red), and the charge transfer center (yellow).
Figure 1—figure supplement 1. AlphaFold dimer human voltage-gated proton channel (hHv1) structural model. (A) Extracellular view of the model, showing each subunit in a different color. (B) One subunit of the dimer showing the position of the arginine gating charges in S4 (blue), the selectivity filter (red), and the charge transfer center (yellow).CC BY · PubMed Central
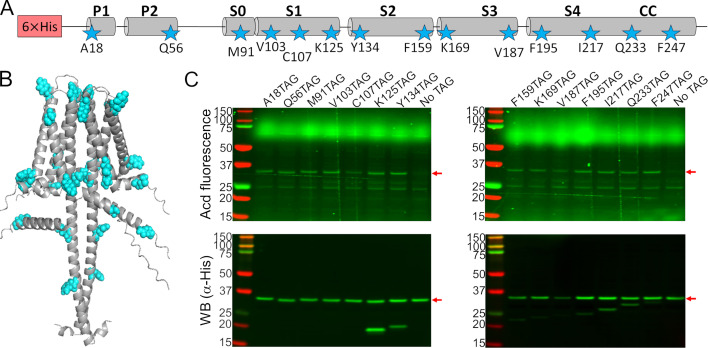
Figure 2. Acridon-2-ylalanine (Acd) was incorporated into 14 positions in the human voltage-gated proton channel (hHv1) sequence. (A) Cartoon showing the amino acids selected to be replaced by an amber stop codon in the hHv1 secondary structure to incorporate Acd (stars). (B) AlphaFold dimer hHv1 structural model with the amino acids selected to be replaced by Acd as cyan spheres. (C) Acd fluorescence gel (top) and Western blot (bottom) of cellular extracts after separation by SDS-PAGE showing the expression of the Acd-labeled hHv1 mutants (red arrows). The shorter detected bands in the WB for some constructs are produced by translation termination. The No TAG lane contains an extract from cells grown under identical conditions (in the presence of Acd and the aminoacyl-tRNA synthetase/tRNA pair) and expressing hHv1 without an amber stop codon.
Figure 2. Acridon-2-ylalanine (Acd) was incorporated into 14 positions in the human voltage-gated proton channel (hHv1) sequence. (A) Cartoon showing the amino acids selected to be replaced by an amber stop codon in the hHv1 secondary structure to incorporate Acd (stars). (B) AlphaFold dimer hHv1 structural model with the amino acids selected to be replaced by Acd as cyan spheres. (C) Acd fluorescence gel (top) and Western blot (bottom) of cellular extracts after separation by SDS-PAGE showing the expression of the Acd-labeled hHv1 mutants (red arrows). The shorter detected bands in the WB for some constructs are produced by translation termination. The No TAG lane contains an extract from cells grown under identical conditions (in the presence of Acd and the aminoacyl-tRNA synthetase/tRNA pair) and expressing hHv1 without an amber stop codon.CC BY · PubMed Central
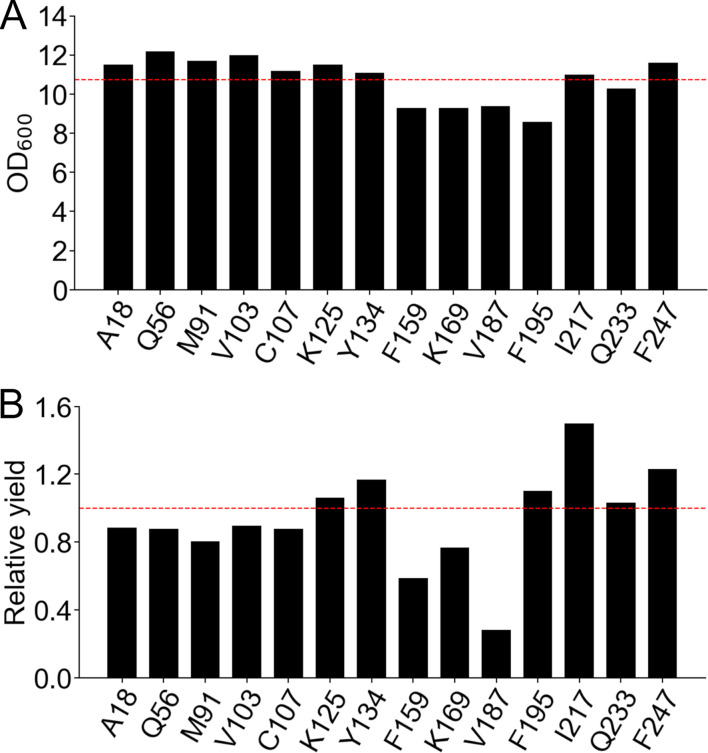
Figure 2—figure supplement 1. The protein yield of human voltage-gated proton channel (hHv1)-acridon-2-ylalanine (Acd) depended on the position of Acd incorporation. (A) Optical density at 600 nm (OD600) of the final cultures expressing the hHv1 with Acd replacing the indicated amino acid. (B) Relative protein yield calculated by multiplying the OD600 and Western blot band intensity of cellular extracts from the final cultures expressing the hHv1 with Acd replacing the indicated amino acid. Values normalized by the No TAG condition, which are cells expressing the hHv1 without any amber stop codon in the presence of Acd and the aminoacyl-tRNA synthetase/tRNA pair (red broken line).
Figure 2—figure supplement 1. The protein yield of human voltage-gated proton channel (hHv1)-acridon-2-ylalanine (Acd) depended on the position of Acd incorporation. (A) Optical density at 600 nm (OD600) of the final cultures expressing the hHv1 with Acd replacing the indicated amino acid. (B) Relative protein yield calculated by multiplying the OD600 and Western blot band intensity of cellular extracts from the final cultures expressing the hHv1 with Acd replacing the indicated amino acid. Values normalized by the No TAG condition, which are cells expressing the hHv1 without any amber stop codon in the presence of Acd and the aminoacyl-tRNA synthetase/tRNA pair (red broken line).CC BY · PubMed Central
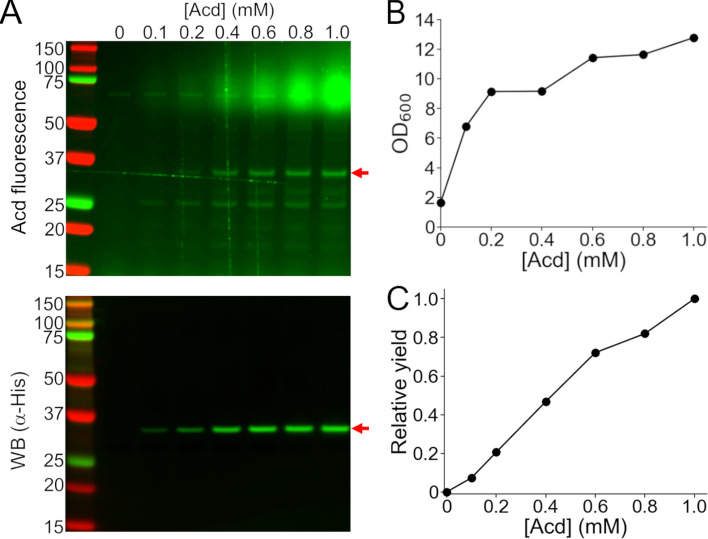
Figure 2—figure supplement 2. The protein yield of human voltage-gated proton channel (hHv1)-A18Acd was proportional to the concentration of acridon-2-ylalanine (Acd) in the culture medium. (A) Cellular extracts of cells co-transformed with the MjA9-AcdRS/tRNA pair plasmid and hHv1-A18TAG and grown with the indicated concentration of Acd in the culture medium were separated by SDS-PAGE to visualize the hHv1 band (red arrow) by Acd fluorescence (top) and Western blot against the N-terminus His-tag (bottom). (B) Optical density at 600 nm (OD600) of the cultures at the end of the expression. (C) Relative yield obtained by multiplying the Western blot band intensity by the OD600, normalized by the value obtained at 1 mM Acd.
Figure 2—figure supplement 2. The protein yield of human voltage-gated proton channel (hHv1)-A18Acd was proportional to the concentration of acridon-2-ylalanine (Acd) in the culture medium. (A) Cellular extracts of cells co-transformed with the MjA9-AcdRS/tRNA pair plasmid and hHv1-A18TAG and grown with the indicated concentration of Acd in the culture medium were separated by SDS-PAGE to visualize the hHv1 band (red arrow) by Acd fluorescence (top) and Western blot against the N-terminus His-tag (bottom). (B) Optical density at 600 nm (OD600) of the cultures at the end of the expression. (C) Relative yield obtained by multiplying the Western blot band intensity by the OD600, normalized by the value obtained at 1 mM Acd.CC BY · PubMed Central
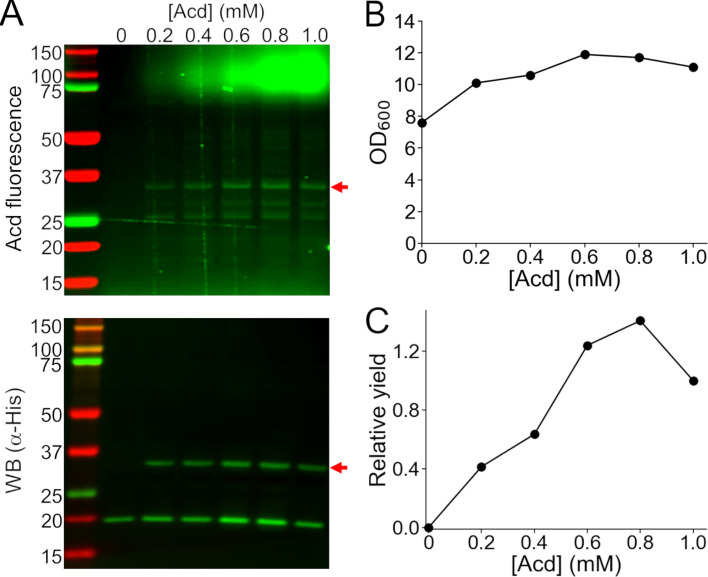
Figure 2—figure supplement 3. The truncation of human voltage-gated proton channel (hHv1)-K125Acd was not decreased at higher concentrations of acridon-2-ylalanine (Acd) in the culture medium. (A) Cellular extracts of cells co-transformed with the MjA9-AcdRS/tRNA pair plasmid and hHv1-K125TAG and grown with the indicated concentration of Acd in the culture medium were separated by SDS-PAGE to visualize the hHv1 band (red arrow) by Acd fluorescence (top) and Western blot against the N-terminus His-tag (bottom). (B) Optical density at 600 nm (OD600) of the cultures at the end of the expression. (C) Relative yield obtained by multiplying the Western blot band intensity by the OD600, normalized by the value obtained at 1 mM Acd.
Figure 2—figure supplement 3. The truncation of human voltage-gated proton channel (hHv1)-K125Acd was not decreased at higher concentrations of acridon-2-ylalanine (Acd) in the culture medium. (A) Cellular extracts of cells co-transformed with the MjA9-AcdRS/tRNA pair plasmid and hHv1-K125TAG and grown with the indicated concentration of Acd in the culture medium were separated by SDS-PAGE to visualize the hHv1 band (red arrow) by Acd fluorescence (top) and Western blot against the N-terminus His-tag (bottom). (B) Optical density at 600 nm (OD600) of the cultures at the end of the expression. (C) Relative yield obtained by multiplying the Western blot band intensity by the OD600, normalized by the value obtained at 1 mM Acd.CC BY · PubMed Central
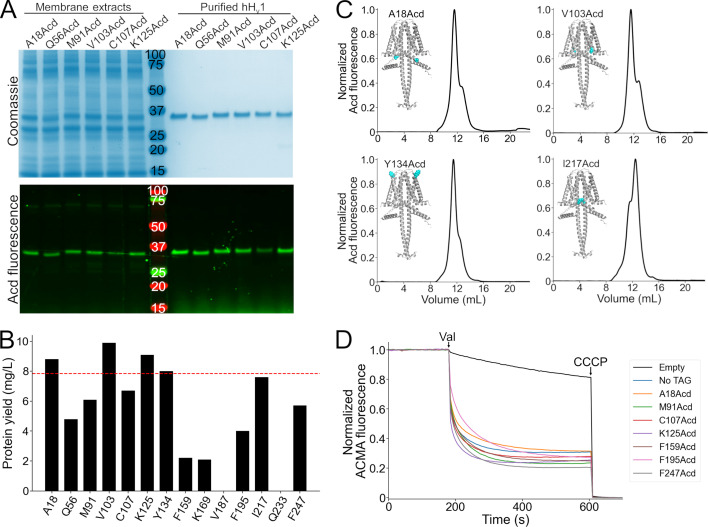
Figure 3. Purification and functional measurements of human voltage-gated proton channel (hHv1)-acridon-2-ylalanine (Acd) proteins. (A) Coomassie-stained (top) and Acd fluorescence (bottom) gels after separation by SDS-PAGE showing representative samples of the membrane extracts after solubilization (left) and the final purified protein after immobilized metal affinity chromatography (right). (B) Protein yield of the hHv1 protein with Acd replacing the amino acid at the indicated position. Note that V187Acd and Q233Acd contained no detectable protein after purification. The red line indicates the protein yield obtained from hHv1 without an amber stop codon in the presence of Acd and the aminoacyl-tRNA synthetase/tRNA pair (No TAG). (C) Representative fluorescence-detection size-exclusion chromatograms of the purified hHv1 proteins with Acd incorporated at the indicated amino acid position. Insets: AlphaFold dimer models, with the amino acid replaced by Acd shown as cyan spheres. (D) Representative liposome proton flux assay of asolectin proteoliposomes containing the indicated hHv1 protein. All purified proteins produced 9-Amino-6-chloro-2-methoxyacridine (ACMA) fluorescence quenching after the addition of valinomycin (Val). The protonophore carbonyl cyanide m-chlorophenyl hydrazone (CCCP) was added at the end of the experiment as a control. The No TAG sample corresponds to proteoliposomes containing hHv1 without an amber stop codon expressed in the presence of Acd and the aminoacyl-tRNA synthetase/tRNA pair.
Figure 3. Purification and functional measurements of human voltage-gated proton channel (hHv1)-acridon-2-ylalanine (Acd) proteins. (A) Coomassie-stained (top) and Acd fluorescence (bottom) gels after separation by SDS-PAGE showing representative samples of the membrane extracts after solubilization (left) and the final purified protein after immobilized metal affinity chromatography (right). (B) Protein yield of the hHv1 protein with Acd replacing the amino acid at the indicated position. Note that V187Acd and Q233Acd contained no detectable protein after purification. The red line indicates the protein yield obtained from hHv1 without an amber stop codon in the presence of Acd and the aminoacyl-tRNA synthetase/tRNA pair (No TAG). (C) Representative fluorescence-detection size-exclusion chromatograms of the purified hHv1 proteins with Acd incorporated at the indicated amino acid position. Insets: AlphaFold dimer models, with the amino acid replaced by Acd shown as cyan spheres. (D) Representative liposome proton flux assay of asolectin proteoliposomes containing the indicated hHv1 protein. All purified proteins produced 9-Amino-6-chloro-2-methoxyacridine (ACMA) fluorescence quenching after the addition of valinomycin (Val). The protonophore carbonyl cyanide m-chlorophenyl hydrazone (CCCP) was added at the end of the experiment as a control. The No TAG sample corresponds to proteoliposomes containing hHv1 without an amber stop codon expressed in the presence of Acd and the aminoacyl-tRNA synthetase/tRNA pair.CC BY · PubMed Central
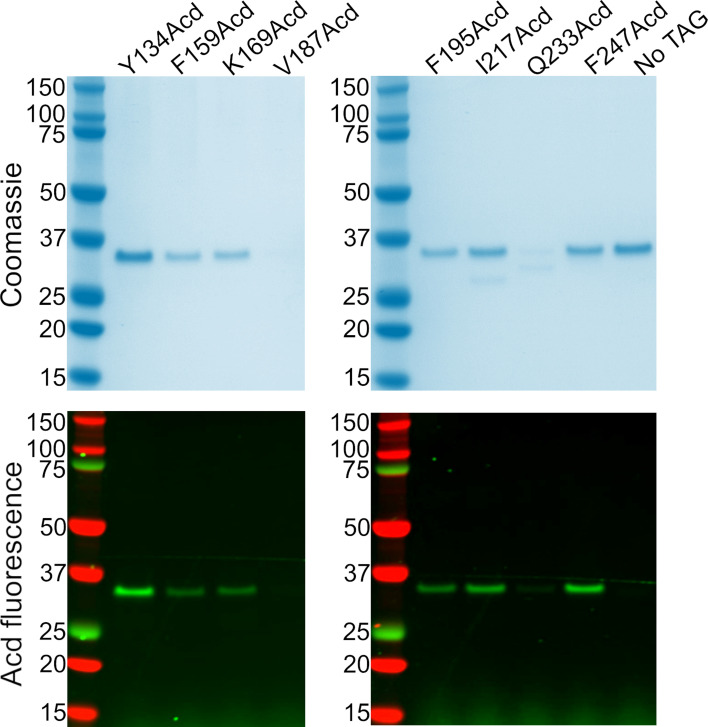
Figure 3—figure supplement 1. SDS-PAGE of the human voltage-gated proton channel (hHv1) protein samples after purification. Coomassie-stained (top) and acridon-2-ylalanine (Acd) fluorescence (bottom) gels of the samples from the elution of the nickel resin column, separated by SDS-PAGE. Note that V187Acd and Q233Acd did not contain appreciable amounts of protein. The No TAG condition consisted of samples purified from cells expressing the hHv1 without any amber stop codon in the presence of Acd and the aminoacyl-tRNA synthetase/tRNA pair.
Figure 3—figure supplement 1. SDS-PAGE of the human voltage-gated proton channel (hHv1) protein samples after purification. Coomassie-stained (top) and acridon-2-ylalanine (Acd) fluorescence (bottom) gels of the samples from the elution of the nickel resin column, separated by SDS-PAGE. Note that V187Acd and Q233Acd did not contain appreciable amounts of protein. The No TAG condition consisted of samples purified from cells expressing the hHv1 without any amber stop codon in the presence of Acd and the aminoacyl-tRNA synthetase/tRNA pair.CC BY · PubMed Central
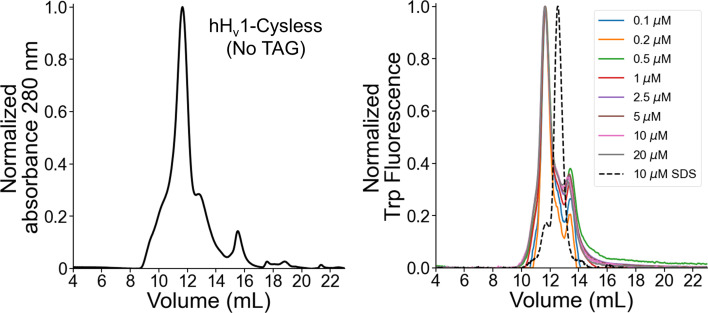
Figure 3—figure supplement 2. The main human voltage-gated proton channel (hHv1) peak in the size exclusion chromatogram corresponds to the dimer. (Left) The No TAG sample was purified from cells expressing the hHv1 without any amber stop codon in the presence of acridon-2-ylalanine (Acd) and the aminoacyl-tRNA synthetase/tRNA pair. The sample eluted from the immobilized affinity chromatography column was concentrated and injected into the size exclusion chromatography column. (Right) SEC-cleaned samples were injected at the indicated concentration. The elution volumes of the samples were similar, with a mean ± standard deviation of 11.64 ± 0.01 mL. Additionally, a sample was run in a denaturing buffer containing 50 mM Tris, pH 8.0, 150 mM NaCl, and 0.2% SDS (dashed lines; elution volume of 12.5 mL). The invariant elution volume at low concentrations and higher elution volume in denaturing buffer strongly suggests that the main peak on the hHv1 chromatograms corresponds to the dimer. The delay between the fluorescence and absorbance peaks is due to the physical separation of the detectors. Ex/Em = 280/350 nm.
Figure 3—figure supplement 2. The main human voltage-gated proton channel (hHv1) peak in the size exclusion chromatogram corresponds to the dimer. (Left) The No TAG sample was purified from cells expressing the hHv1 without any amber stop codon in the presence of acridon-2-ylalanine (Acd) and the aminoacyl-tRNA synthetase/tRNA pair. The sample eluted from the immobilized affinity chromatography column was concentrated and injected into the size exclusion chromatography column. (Right) SEC-cleaned samples were injected at the indicated concentration. The elution volumes of the samples were similar, with a mean ± standard deviation of 11.64 ± 0.01 mL. Additionally, a sample was run in a denaturing buffer containing 50 mM Tris, pH 8.0, 150 mM NaCl, and 0.2% SDS (dashed lines; elution volume of 12.5 mL). The invariant elution volume at low concentrations and higher elution volume in denaturing buffer strongly suggests that the main peak on the hHv1 chromatograms corresponds to the dimer. The delay between the fluorescence and absorbance peaks is due to the physical separation of the detectors. Ex/Em = 280/350 nm.CC BY · PubMed Central
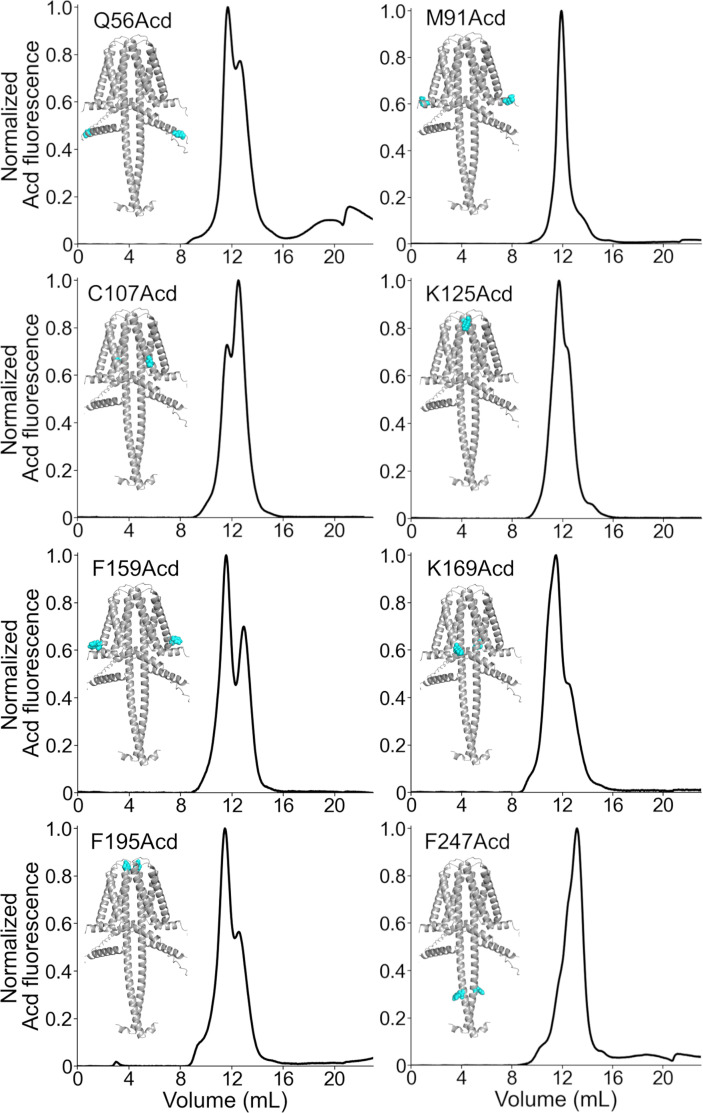
Figure 3—figure supplement 3. Fluorescence-detection size exclusion chromatography of human voltage-gated proton channel (hHv1)-acridon-2-ylalanine (Acd) proteins. Chromatograms of the purified hHv1 proteins with Acd incorporated at the indicated amino acid position. The AlphaFold dimer model with the amino acid replaced by Acd as cyan spheres is included.
Figure 3—figure supplement 3. Fluorescence-detection size exclusion chromatography of human voltage-gated proton channel (hHv1)-acridon-2-ylalanine (Acd) proteins. Chromatograms of the purified hHv1 proteins with Acd incorporated at the indicated amino acid position. The AlphaFold dimer model with the amino acid replaced by Acd as cyan spheres is included.CC BY · PubMed Central
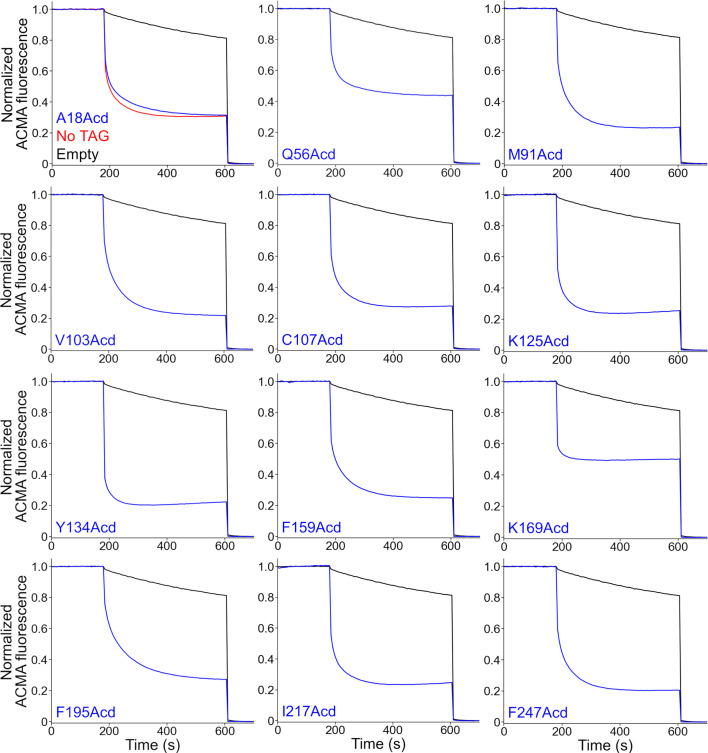
Figure 3—figure supplement 4. The purified human voltage-gated proton channel (hHv1)-acridon-2-ylalanine (Acd) proteins were functional proton channels. Liposome proton flux assays of asolectin proteoliposomes containing the indicated hHv1-Acd protein. The proteoliposome samples produced 9-Amino-6-chloro-2-methoxyacridine (ACMA) fluorescence quenching after the addition of valinomycin (180 s) in the presence of a potassium gradient. The protonophore carbonyl cyanide m-chlorophenyl hydrazone (CCCP) was added at the end of the experiment (600 s). The No TAG sample (red trace) contains proteoliposomes containing hHv1 without any amber stop codon expressed in the presence of Acd and the aminoacyl-tRNA synthetase/tRNA pair. Empty asolectin liposomes (black traces) showed slow ACMA fluorescence quenching.
Figure 3—figure supplement 4. The purified human voltage-gated proton channel (hHv1)-acridon-2-ylalanine (Acd) proteins were functional proton channels. Liposome proton flux assays of asolectin proteoliposomes containing the indicated hHv1-Acd protein. The proteoliposome samples produced 9-Amino-6-chloro-2-methoxyacridine (ACMA) fluorescence quenching after the addition of valinomycin (180 s) in the presence of a potassium gradient. The protonophore carbonyl cyanide m-chlorophenyl hydrazone (CCCP) was added at the end of the experiment (600 s). The No TAG sample (red trace) contains proteoliposomes containing hHv1 without any amber stop codon expressed in the presence of Acd and the aminoacyl-tRNA synthetase/tRNA pair. Empty asolectin liposomes (black traces) showed slow ACMA fluorescence quenching.CC BY · PubMed Central
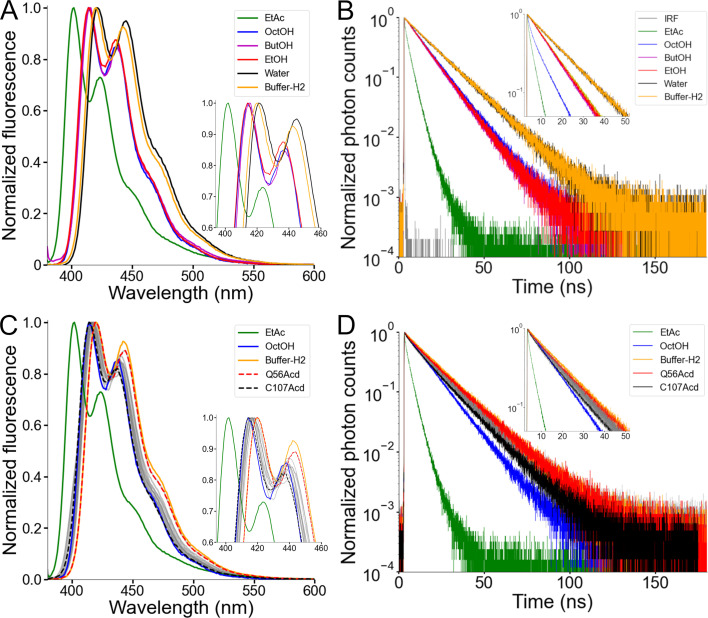
Figure 4. Acridon-2-ylalanine (Acd) showed a low environmental sensitivity in human voltage-gated proton channel (hHv1). (A) Normalized fluorescence emission spectra of the Acd amino acid dissolved in the indicated solvent (Excitation = 370 nm). EtAc: ethyl acetate, OctOH: 1-octanol, ButOH: 1-butanol, EtOH: ethanol. (B) Normalized fluorescence decay of the Acd amino acid dissolved in the indicated solvent. IRF: Instrument Response Function. (C) Normalized fluorescence emission spectra of the hHv1-Acd proteins in Buffer-H2 (gray). The Acd amino acid spectra in selected solvents are also shown for reference. Q56Acd and C107Acd spectra are shown with broken lines. The emission maxima are listed in Table 3. (D) Normalized fluorescence decay of the hHv1-Acd proteins in Buffer-H2 (gray). The Acd amino acid decays in selected solvents are also shown for reference. Q56Acd and C107Acd decays are shown in red and black, respectively.
Figure 4. Acridon-2-ylalanine (Acd) showed a low environmental sensitivity in human voltage-gated proton channel (hHv1). (A) Normalized fluorescence emission spectra of the Acd amino acid dissolved in the indicated solvent (Excitation = 370 nm). EtAc: ethyl acetate, OctOH: 1-octanol, ButOH: 1-butanol, EtOH: ethanol. (B) Normalized fluorescence decay of the Acd amino acid dissolved in the indicated solvent. IRF: Instrument Response Function. (C) Normalized fluorescence emission spectra of the hHv1-Acd proteins in Buffer-H2 (gray). The Acd amino acid spectra in selected solvents are also shown for reference. Q56Acd and C107Acd spectra are shown with broken lines. The emission maxima are listed in Table 3. (D) Normalized fluorescence decay of the hHv1-Acd proteins in Buffer-H2 (gray). The Acd amino acid decays in selected solvents are also shown for reference. Q56Acd and C107Acd decays are shown in red and black, respectively.CC BY · PubMed Central
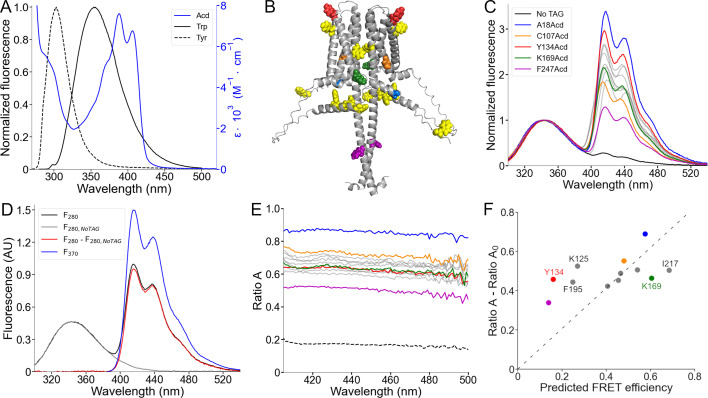
Figure 5. Spectral Förster resonance energy transfer (FRET) analysis using Trp and Tyr donors and acridon-2-ylalanine (Acd) as acceptor. (A) Fluorescence emission spectra of the intrinsic fluorescent amino acids Trp (black) and Tyr (black, broken lines), along with the Acd absorption spectrum in Buffer-H2 (blue). (B) AlphaFold dimer hHv1 structural model with the amino acids colored according to (C) and the native tryptophan and tyrosine residues shown as yellow spheres. (C) Normalized fluorescence spectra of the purified hHv1-Acd proteins (Excitation = 280 nm). The spectra were normalized by the Trp/Tyr fluorescence. The colors correspond to the indicated hHv1-Acd protein, and the remaining spectra are shown as gray traces in the figure. The No TAG sample (black) contains purified hHv1 protein without any amber stop codon expressed in the presence of Acd and the aminoacyl-tRNA synthetase/tRNA pair. (D) Example of the spectral FRET analysis procedure. The fluorescence spectrum of hHv1-Y134Acd obtained when exciting at 280 nm (black, F280) minus the normalized spectrum at the same excitation wavelength of the No TAG sample (gray, F280,NoTAG) produced the Acd emission spectrum shown in red (F280 – F280,NoTAG). Ratio A values were calculated by dividing this spectrum by the hHv1-Y134Acd fluorescence spectrum obtained by direct excitation at 370 nm (F370). (E) Ratio A traces of the hHv1-Acd proteins colored according to (C). The ratio between the spectra of free Acd amino acid excited at 280 and 370 nm (Ratio A0) is shown as broken lines. (F) Mean Ratio A – Ratio A0 values (410–480 nm; N=4) as a function of the predicted FRET efficiencies from the AlphaFold hHv1 structural model, colored according to (C). The broken line is the best fit to the equation (Ratio A – Ratio A0)=m(Predicted FRET efficiency).
Figure 5. Spectral Förster resonance energy transfer (FRET) analysis using Trp and Tyr donors and acridon-2-ylalanine (Acd) as acceptor. (A) Fluorescence emission spectra of the intrinsic fluorescent amino acids Trp (black) and Tyr (black, broken lines), along with the Acd absorption spectrum in Buffer-H2 (blue). (B) AlphaFold dimer hHv1 structural model with the amino acids colored according to (C) and the native tryptophan and tyrosine residues shown as yellow spheres. (C) Normalized fluorescence spectra of the purified hHv1-Acd proteins (Excitation = 280 nm). The spectra were normalized by the Trp/Tyr fluorescence. The colors correspond to the indicated hHv1-Acd protein, and the remaining spectra are shown as gray traces in the figure. The No TAG sample (black) contains purified hHv1 protein without any amber stop codon expressed in the presence of Acd and the aminoacyl-tRNA synthetase/tRNA pair. (D) Example of the spectral FRET analysis procedure. The fluorescence spectrum of hHv1-Y134Acd obtained when exciting at 280 nm (black, F280) minus the normalized spectrum at the same excitation wavelength of the No TAG sample (gray, F280,NoTAG) produced the Acd emission spectrum shown in red (F280 – F280,NoTAG). Ratio A values were calculated by dividing this spectrum by the hHv1-Y134Acd fluorescence spectrum obtained by direct excitation at 370 nm (F370). (E) Ratio A traces of the hHv1-Acd proteins colored according to (C). The ratio between the spectra of free Acd amino acid excited at 280 and 370 nm (Ratio A0) is shown as broken lines. (F) Mean Ratio A – Ratio A0 values (410–480 nm; N=4) as a function of the predicted FRET efficiencies from the AlphaFold hHv1 structural model, colored according to (C). The broken line is the best fit to the equation (Ratio A – Ratio A0)=m(Predicted FRET efficiency).CC BY · PubMed Central
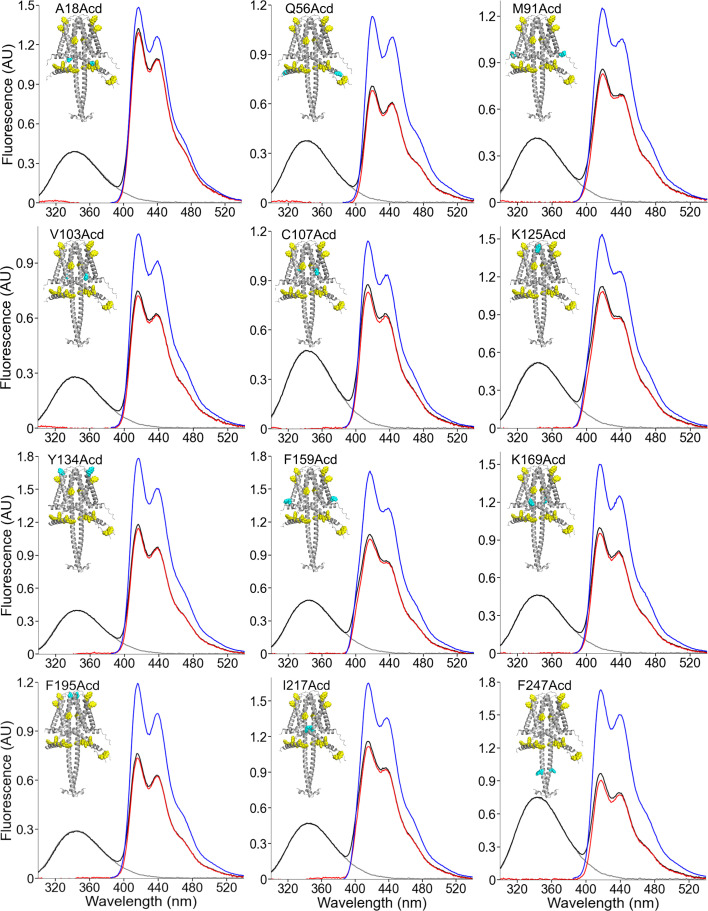
Figure 5—figure supplement 1. Fluorescence emission spectra of human voltage-gated proton channel (hHv1)-acridon-2-ylalanine (Acd). Spectra of the indicated hHv1-Acd protein sample obtained when exciting at 280 nm (black) and 370 nm (blue). The isolated spectrum of Acd (red) was obtained by subtracting the black trace from the normalized spectrum of the No TAG sample excited at 280 nm (gray).
Figure 5—figure supplement 1. Fluorescence emission spectra of human voltage-gated proton channel (hHv1)-acridon-2-ylalanine (Acd). Spectra of the indicated hHv1-Acd protein sample obtained when exciting at 280 nm (black) and 370 nm (blue). The isolated spectrum of Acd (red) was obtained by subtracting the black trace from the normalized spectrum of the No TAG sample excited at 280 nm (gray).CC BY · PubMed Central
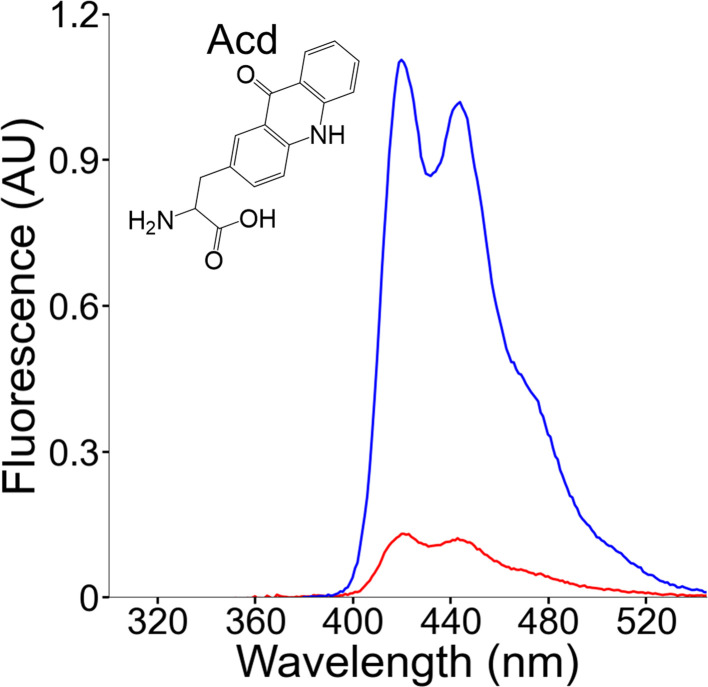
Figure 5—figure supplement 2. Fluorescence emission spectra of the acridon-2-ylalanine (Acd) amino acid in solution. Spectra of Acd in Buffer-H2 using an excitation wavelength of 370 nm (blue) or 280 nm (red).
Figure 5—figure supplement 2. Fluorescence emission spectra of the acridon-2-ylalanine (Acd) amino acid in solution. Spectra of Acd in Buffer-H2 using an excitation wavelength of 370 nm (blue) or 280 nm (red).CC BY · PubMed Central
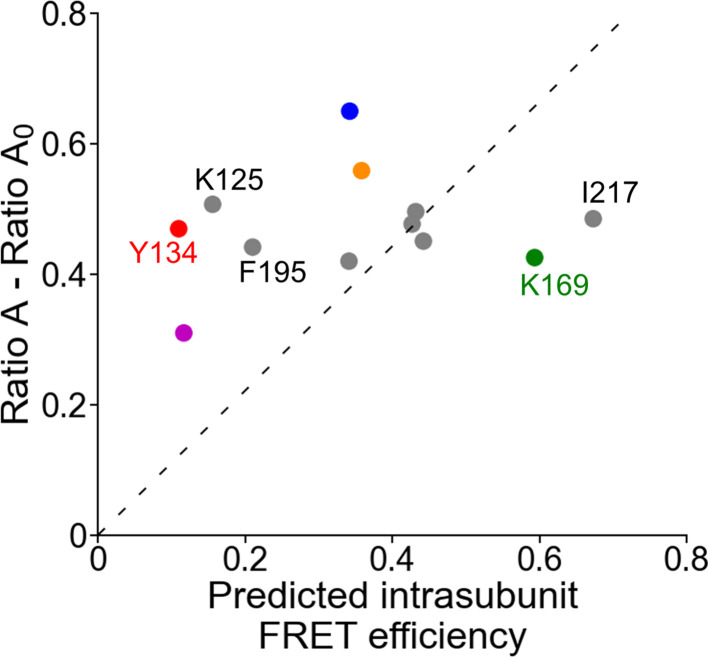
Figure 5—figure supplement 3. Measured FRET efficiency as a function of the predicted intrasubunit FRET efficiency. Mean Ratio A – Ratio A0 values (410–480 nm; N=4) as a function of the predicted intrasubunit Förster resonance energy transfer (FRET) efficiencies from one subunit of the AlphaFold human voltage-gated proton channel (hHv1) structural model, colored according to Figure 5F. The broken line is the best fit to the equation (Ratio A – Ratio A0)=m(Predicted intrasubunit FRET efficiency).
Figure 5—figure supplement 3. Measured FRET efficiency as a function of the predicted intrasubunit FRET efficiency. Mean Ratio A – Ratio A0 values (410–480 nm; N=4) as a function of the predicted intrasubunit Förster resonance energy transfer (FRET) efficiencies from one subunit of the AlphaFold human voltage-gated proton channel (hHv1) structural model, colored according to Figure 5F. The broken line is the best fit to the equation (Ratio A – Ratio A0)=m(Predicted intrasubunit FRET efficiency).CC BY · PubMed Central
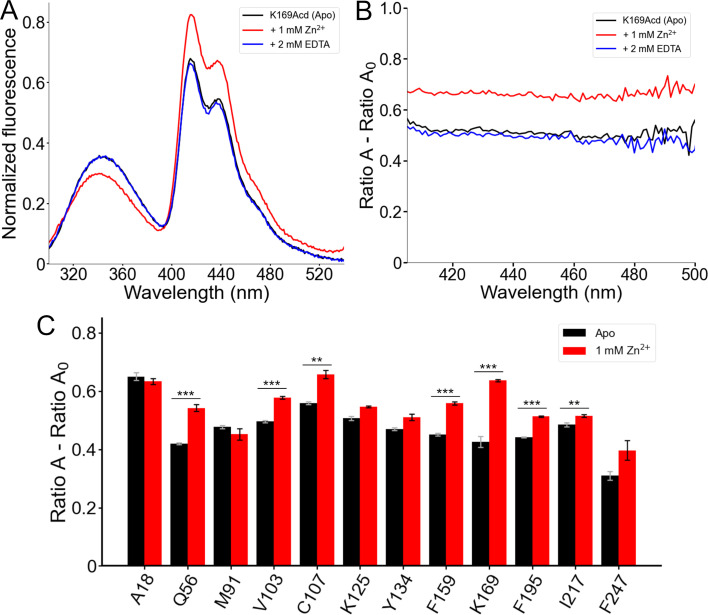
Figure 6. Förster resonance energy transfer (FRET) between Trp/Tyr and acridon-2-ylalanine (Acd) reports a conformational rearrangement in response to Zn2+. (A) Normalized fluorescence emission spectra of human voltage-gated proton channel (hHv1)-K169Acd (Excitation = 280 nm) in Buffer-H2 in the absence of Zn2+ (black, Apo), in the presence of 1 mM Zn2+ (red), or in the presence of 1 mM Zn2+ and 2 mM EDTA (blue). Spectra were normalized by the maximum intensity of the Acd emission spectrum of the same sample excited at 370 nm. (B) Spectral FRET analysis of hHv1-K169Acd in Buffer-H2 in the absence of Zn2+ (black, Apo), in the presence of 1 mM Zn2+ (red), or in the presence of 1 mM Zn2+ and 2 mM EDTA (blue). (C) Spectral FRET analysis of the hHv1-Acd proteins in Buffer-H2 in the absence (black, Apo) or presence of 1 mM Zn2+ (red). N=4, ***p<0.005, **p<0.01.
Figure 6. Förster resonance energy transfer (FRET) between Trp/Tyr and acridon-2-ylalanine (Acd) reports a conformational rearrangement in response to Zn2+. (A) Normalized fluorescence emission spectra of human voltage-gated proton channel (hHv1)-K169Acd (Excitation = 280 nm) in Buffer-H2 in the absence of Zn2+ (black, Apo), in the presence of 1 mM Zn2+ (red), or in the presence of 1 mM Zn2+ and 2 mM EDTA (blue). Spectra were normalized by the maximum intensity of the Acd emission spectrum of the same sample excited at 370 nm. (B) Spectral FRET analysis of hHv1-K169Acd in Buffer-H2 in the absence of Zn2+ (black, Apo), in the presence of 1 mM Zn2+ (red), or in the presence of 1 mM Zn2+ and 2 mM EDTA (blue). (C) Spectral FRET analysis of the hHv1-Acd proteins in Buffer-H2 in the absence (black, Apo) or presence of 1 mM Zn2+ (red). N=4, ***p<0.005, **p<0.01.CC BY · PubMed Central
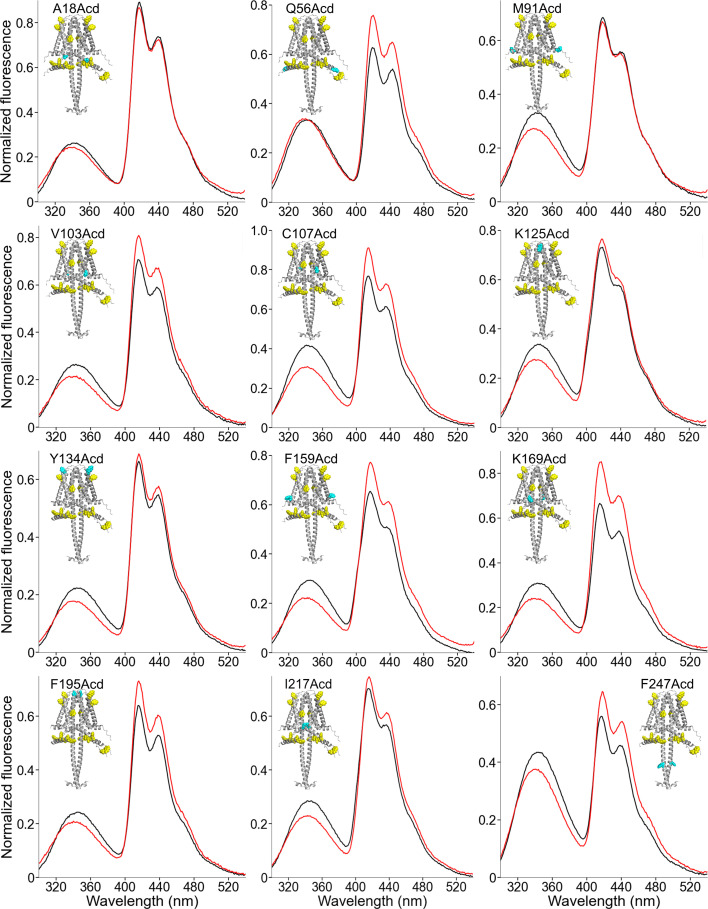
Figure 6—figure supplement 1. Changes in the fluorescence emission spectra of human voltage-gated proton channel (hHv1)-acridon-2-ylalanine (Acd) in the presence of zinc. Spectra of the indicated hHv1-Acd protein sample obtained when exciting at 280 nm in the Apo state (black) and in the presence of 1 mM Zn2+ (red). Spectra were normalized by the maximum intensity of the Acd emission spectrum of the same sample excited at 370 nm.
Figure 6—figure supplement 1. Changes in the fluorescence emission spectra of human voltage-gated proton channel (hHv1)-acridon-2-ylalanine (Acd) in the presence of zinc. Spectra of the indicated hHv1-Acd protein sample obtained when exciting at 280 nm in the Apo state (black) and in the presence of 1 mM Zn2+ (red). Spectra were normalized by the maximum intensity of the Acd emission spectrum of the same sample excited at 370 nm.CC BY · PubMed Central

Verification

Claims the paper makes

The claims and statistics of this paper haven’t been checked yet.

Run the check — free, no account needed. It reads the open-access text and checks the sources it cites.

A few free checks a day · papers already verified open instantly · results are public

Self-check

Percentages, sums and reported differences re-computed from the paper’s own numbers.

The self-check needs the paper’s full text.

Citations

Cites

Research works printed but not linked: 6

  1. De La Rosa, 2018, Coupling between an electrostatic network and the Zn2+ binding site modulates Hv1 activation, The Journal of General Physiology, 150, 863, 10.1085/jgp.201711822 · DOI
  2. Eggan, 2025, Domain coupling in allosteric regulation of SthK measured using time-resolved transition metal ion FRET, 10.1101/2025.03.31.646362 · DOI
  3. Jardin, 2020, Assessing Structural Determinants of Zn²⁺ Binding to Human Hv1 via Multiple MD Simulations, Biophysical Journal, 118, 1221, 10.1016/j.bpj.2019.12.035 · DOI
  4. Musset, 2010, Zinc inhibition of monomeric and dimeric proton channels suggests cooperative gating, The Journal of Physiology, 588, 1435, 10.1113/jphysiol.2010.188318 · DOI
  5. Schulman, 1977, Variations of fluorescence efficiencies of 9-(10H)-acridone and its 4-methoxy derivative with ph. excited-state proton transfer in very weak acids and, Analytica Chimica Acta, 93, 239, 10.1016/0003-2670(77)80027-5 · DOI
  6. Tang, 2020, Scorpion toxin inhibits the voltage-gated proton channel using a Zn2+ -like long-range conformational coupling mechanism, British Journal of Pharmacology, 177, 2351, 10.1111/bph.14984 · DOI

Metadata

Authors
Carmona, E. M., Zagotta, W. N., & Gordon, S. E.
Affiliations
University of Washington (US)
Corresponding author
  • Zagotta, William N
  • Gordon, Sharona E
Venue
eLife
Published
2026-04-28
Volume
15
ISSN
2050-084X (ISSN-L)
OpenAlex
W7131111897
Cited by
0
References
42
Type
posted content
Language
en
Open access
Locations
  • eLife (publishedVersion, cc-by)
  • PubMed (publishedVersion)
  • PubMed Central (publishedVersion, cc-by)
  • DOAJ (DOAJ: Directory of Open Access Journals) (submittedVersion, cc-by-sa)
Funders
  • National Institutes of Health (R01EY037223, R35GM145225, R01EY010329, R35GM148137)
  • Pew Charitable Trusts
Topics
  • Life Sciences › Biochemistry, Genetics and Molecular Biology › Molecular Biology › Ion channel regulation and function
  • Life Sciences › Biochemistry, Genetics and Molecular Biology › Biophysics › Advanced Fluorescence Microscopy Techniques
  • Life Sciences › Biochemistry, Genetics and Molecular Biology › Molecular Biology › Protein Structure and Dynamics
Keywords
genetic code expansion, fluorescence resonance energy transfer, conformational change, voltage-sensing domain, coiled-coil domain, zinc regulation, proton permeation, detergent micelles, protein folding
MeSH terms
Amino Acids, Escherichia coli, Humans, Ion Channels, Protein Conformation, Protons, Fluorescence Resonance Energy Transfer

About these checks

Registry, retraction, Cites and statistics results are computed, not judged, with one exception: a printed reference that no index lists is read once by a model before it counts as a citation error. Claims are extracted by a model and kept only when their quote appears verbatim in the text; each cited source is then checked, with a model’s help, for whether it says what the claim relies on. Those verdicts can be wrong — read the claim’s quote and the cited source before relying on one.

Statistics and arithmetic are recomputed, not judged.

Confidence bands are shown only for fields calibrated on our annotated test set. None is calibrated yet, so no band is shown.

What counts as a claim ›How we measure confidence ›How we check this ›

Are you an author, or do you see a problem with this page? Request a review

Data sources

Bibliographic data: Semantic Scholar, OpenAlex, Crossref.

Contains information from the Semantic Scholar Academic Graph Datasets, made available under the ODC Attribution License (ODC-BY 1.0).

Semantic Scholar’s data is described in: Kinney, R., et al. (2023). The Semantic Scholar Open Data Platform. arXiv:2301.10140.