Cited by 108

The DOI matches its Crossref record; 2 of the 2 references it cites were found in a registry or an index.

Initial elevations in glutamate and dopamine neurotransmission decline with age, as does exploratory behavior, in LRRK2 G2019S knock-in mice

Volta, Mattia, Beccano-Kelly, Dayne A, Paschall, Sarah A, Cataldi, Stefano, MacIsaac, Sarah E, Kuhlmann, Naila, Kadgien, Chelsie A, Tatarnikov, Igor, Fox, Jesse, Khinda, Jaskaran, Mitchell, Emma, Bergeron, Sabrina, Melrose, Heather, Farrer, Matthew J, Milnerwood, Austen J·2017·eLife

Abstract

LRRK2 mutations produce end-stage Parkinson’s disease (PD) with reduced nigrostriatal dopamine, whereas, asymptomatic carriers have increased dopamine turnover and altered brain connectivity. LRRK2 pathophysiology remains unclear, but reduced dopamine and mitochondrial abnormalities occur in aged G2019S mutant knock-in (GKI) mice. Conversely, cultured GKI neurons exhibit increased synaptic transmission. We assessed behavior and synaptic glutamate and dopamine function across a range of ages. Young GKI mice exhibit more vertical exploration, elevated glutamate and dopamine transmission, and aberrant D2-receptor responses. These phenomena decline with age, but are stable in littermates. In young GKI mice, dopamine transients are slower, independent of dopamine transporter (DAT), increasing the lifetime of extracellular dopamine. Slowing of dopamine transients is observed with age in littermates, suggesting premature ageing of dopamine synapses in GKI mice. Thus, GKI mice exhibit early, but declining, synaptic and behavioral phenotypes, making them amenable to investigation of early pathophysiological, and later parkinsonian-like, alterations. This model will prove valuable in efforts to develop neuroprotection for PD.

Overview

The claims and statistics of this paper haven’t been checked yet.

Run the check — free, no account needed. It reads the open-access text and checks the sources it cites.

A few free checks a day · papers already verified open instantly · results are public

Integrity signals

Registry

Crossref · 10.7554/elife.28377

Cites

2 of 2 references verified0 citation errors · 0 not checkable

Statistics

Figures

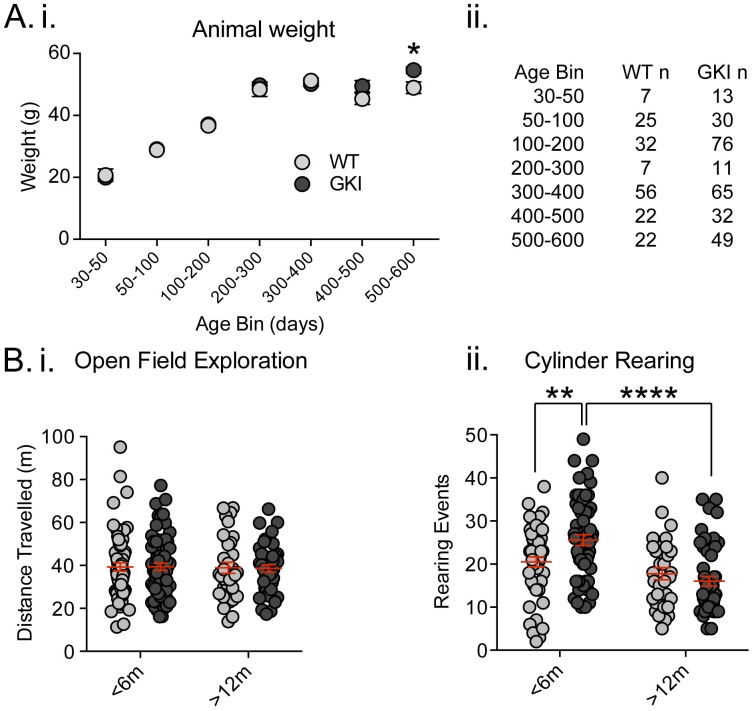
Figure 1. Increased exploratory behavior in young GKI mice declines with age. (A) Animal body weight over time. There was no main effect of genotype upon mouse weight, but there was a significant interaction between weight and age (see text and Figure 1—figure supplement 1). Weights were not significantly different at any age up to 500 days (i; animal n shown in ii); however, in the oldest age group there was a statistically significant increase in GKI mean weight (post-test *p=0.018). (B) Spontaneous exploratory behavior in young and old mice. Analysis of open field exploration showed no genotype (p=0.9) or interaction (p=0.9) effects on total distance travelled (i). In the cylinder test for vertical exploration (ii) there was a significant interaction between genotype and age upon rearing events (p=0.008). At < 6 months, GKI mice exhibited a significant 24.8% increase in vertical exploration (post-test **p=0.009), which declined significantly with age (post-test ****p=0.0001). No significant age-related decline was observed in WT littermates (post-test p=0.3).
Figure 1. Increased exploratory behavior in young GKI mice declines with age. (A) Animal body weight over time. There was no main effect of genotype upon mouse weight, but there was a significant interaction between weight and age (see text and Figure 1—figure supplement 1). Weights were not significantly different at any age up to 500 days (i; animal n shown in ii); however, in the oldest age group there was a statistically significant increase in GKI mean weight (post-test *p=0.018). (B) Spontaneous exploratory behavior in young and old mice. Analysis of open field exploration showed no genotype (p=0.9) or interaction (p=0.9) effects on total distance travelled (i). In the cylinder test for vertical exploration (ii) there was a significant interaction between genotype and age upon rearing events (p=0.008). At < 6 months, GKI mice exhibited a significant 24.8% increase in vertical exploration (post-test **p=0.009), which declined significantly with age (post-test ****p=0.0001). No significant age-related decline was observed in WT littermates (post-test p=0.3).CC BY · PubMed Central
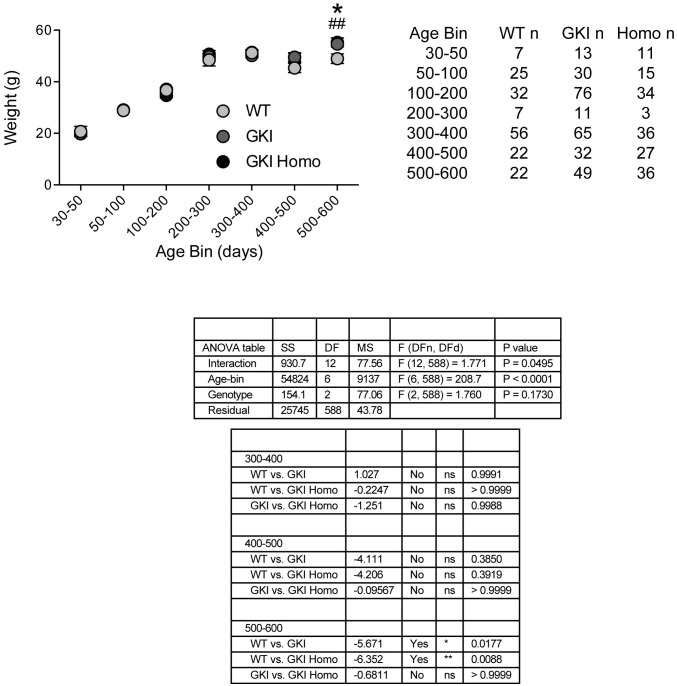
Figure 1—figure supplement 1. Weights of WT, GKI and GKI homozygous animals are similar until advanced ages. Animal body weight over time. There was no main effect of genotype upon mouse weight, but there was a significant interaction between weight and age (2-way ANOVA, genotype p=0.17, interaction p=0.049). Weights were not significantly different at any age up to 500 days; however, in the oldest age group there was a statistically significant increase in GKI (Holm-Sidak post-test *p=0.018) and GKI Homo (post-test ##p=0.009) mean weight, relative to WT animals.
Figure 1—figure supplement 1. Weights of WT, GKI and GKI homozygous animals are similar until advanced ages. Animal body weight over time. There was no main effect of genotype upon mouse weight, but there was a significant interaction between weight and age (2-way ANOVA, genotype p=0.17, interaction p=0.049). Weights were not significantly different at any age up to 500 days; however, in the oldest age group there was a statistically significant increase in GKI (Holm-Sidak post-test *p=0.018) and GKI Homo (post-test ##p=0.009) mean weight, relative to WT animals.CC BY · PubMed Central
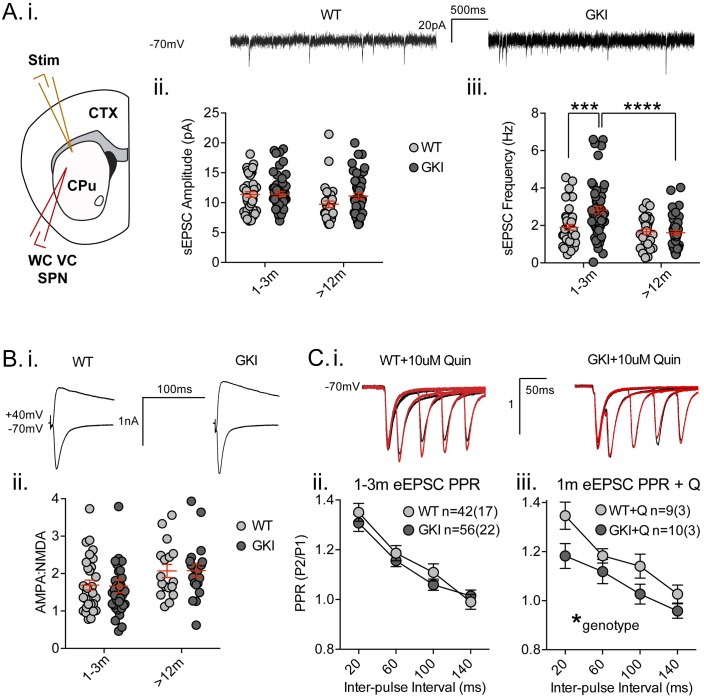
Figure 2. Increased glutamate transmission onto young GKI striatal projection neurons declines with age. (A) Whole-cell voltage-clamp (WC VC) recording in striatal medium-sized spiny projection neurons (SPNs) of the dorsolateral striatum of acutely prepared brain slices. Recording electrodes targeted visually identified SPNs in the dorsolateral caudate putamen (CPu) of the striatum and stimulating electrodes were placed intrastriatally ~200 um dorsal of the recording site toward M1/S1 cortex (CTX) (i). Example traces of spontaneous activity (spontaneous excitatory post-synaptic currents: sEPSCs) in slices from 1m-old WT (left) and GKI (right) mice. There was a significant main effect of age upon mean sEPSC amplitude (ii, p=0.049), but no main genotype (p=0.15) or age-genotype interaction (p=0.18). In contrast, there were significant main age (0.0001) and genotype (p=0.013) effects and an age-genotype interaction effect (p=0.006) upon the frequency of sEPSCs. At 1–3 months, GKI SPNs exhibited a significant 48.4% increase in mean event frequency (post-test **p=0.0004), which significantly declined (by 57%) with age (post-test ****p=0.0001). In contrast, the 13% decline with age in WT SPNs was not significant (post-test p=0.29). (B) Representative traces of intrastriatally-evoked AMPA- and NMDA-receptor mediated EPSCs (eEPSCs) recorded at Vh −70 mV and + 40 mV, respectively (i). There was a significant main effect of age (ii; p=0.041) upon the ratio of AMPA to NMDA eEPSC amplitudes, but no main genotype (p=0.96) or age-genotype interaction effect (p=0.92). (C) Representative peak-normalized traces of evoked EPSCs (eEPSCs) in SPNs, resulting from intrastriatal paired-pulse stimuli (20–140 ms inter-pulse intervals; IPIs) prior to (i. black trace) and in the presence of 10 uM quinpirole (red trace; slices from 1 month WT and GKI slices). There were no significant genotype or genotype-IPI interaction effects upon paired-pulse ratios in pooled experiments from animals aged 1–3 months in standard conditions (ii). In the presence of the D2 agonist quinpirole (i) there was a significant main genotype effect (*p=0.042) in slices from 1 m old mice (iii).
Figure 2. Increased glutamate transmission onto young GKI striatal projection neurons declines with age. (A) Whole-cell voltage-clamp (WC VC) recording in striatal medium-sized spiny projection neurons (SPNs) of the dorsolateral striatum of acutely prepared brain slices. Recording electrodes targeted visually identified SPNs in the dorsolateral caudate putamen (CPu) of the striatum and stimulating electrodes were placed intrastriatally ~200 um dorsal of the recording site toward M1/S1 cortex (CTX) (i). Example traces of spontaneous activity (spontaneous excitatory post-synaptic currents: sEPSCs) in slices from 1m-old WT (left) and GKI (right) mice. There was a significant main effect of age upon mean sEPSC amplitude (ii, p=0.049), but no main genotype (p=0.15) or age-genotype interaction (p=0.18). In contrast, there were significant main age (0.0001) and genotype (p=0.013) effects and an age-genotype interaction effect (p=0.006) upon the frequency of sEPSCs. At 1–3 months, GKI SPNs exhibited a significant 48.4% increase in mean event frequency (post-test **p=0.0004), which significantly declined (by 57%) with age (post-test ****p=0.0001). In contrast, the 13% decline with age in WT SPNs was not significant (post-test p=0.29). (B) Representative traces of intrastriatally-evoked AMPA- and NMDA-receptor mediated EPSCs (eEPSCs) recorded at Vh −70 mV and + 40 mV, respectively (i). There was a significant main effect of age (ii; p=0.041) upon the ratio of AMPA to NMDA eEPSC amplitudes, but no main genotype (p=0.96) or age-genotype interaction effect (p=0.92). (C) Representative peak-normalized traces of evoked EPSCs (eEPSCs) in SPNs, resulting from intrastriatal paired-pulse stimuli (20–140 ms inter-pulse intervals; IPIs) prior to (i. black trace) and in the presence of 10 uM quinpirole (red trace; slices from 1 month WT and GKI slices). There were no significant genotype or genotype-IPI interaction effects upon paired-pulse ratios in pooled experiments from animals aged 1–3 months in standard conditions (ii). In the presence of the D2 agonist quinpirole (i) there was a significant main genotype effect (*p=0.042) in slices from 1 m old mice (iii).CC BY · PubMed Central
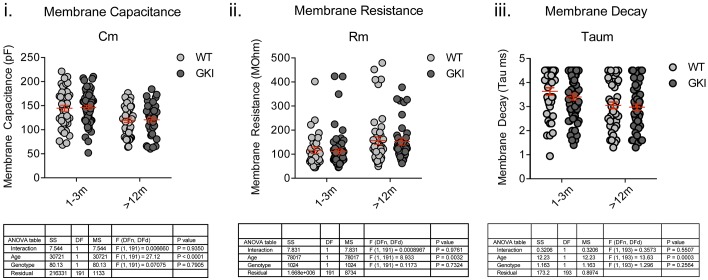
Figure 2—figure supplement 1. There are no genotype-dependent alterations to SPN intrinsic membrane properties. Whole-cell recording of medium-sized spiny striatal projection neurons (SPNs) in membrane test mode and analysis of intrinsic membrane properties. While significant age-dependent changes in membrane capacitance (Cm), resistance (Rm) and decay time (Taum) were observed, there were no genotype or interaction effects. 2-way ANOVA detailed below.
Figure 2—figure supplement 1. There are no genotype-dependent alterations to SPN intrinsic membrane properties. Whole-cell recording of medium-sized spiny striatal projection neurons (SPNs) in membrane test mode and analysis of intrinsic membrane properties. While significant age-dependent changes in membrane capacitance (Cm), resistance (Rm) and decay time (Taum) were observed, there were no genotype or interaction effects. 2-way ANOVA detailed below.CC BY · PubMed Central
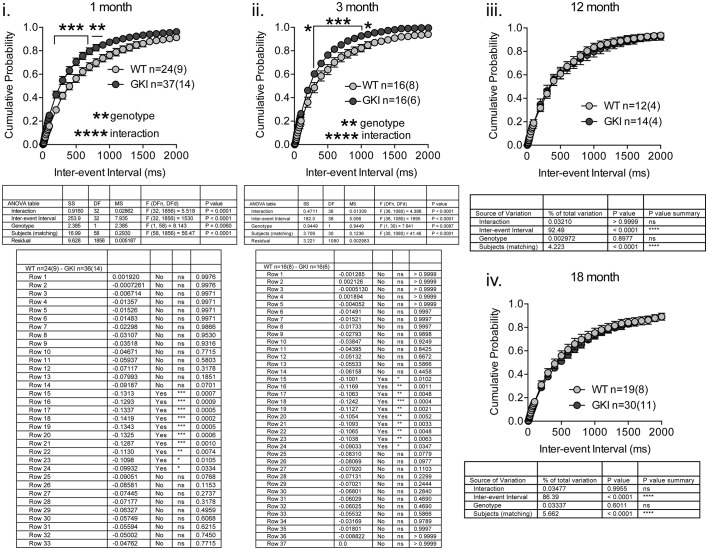
Figure 2—figure supplement 2. GKI SPN sEPSC frequency is similarly increased in 1 and 3 month slices, and similar to WT in 12 and 18 month slices. Whole-cell recording in dorsolateral striatal SPNs and analysis of sEPSCs recorded at −70 mV. Higher sEPSC frequencies (as reflected by decreased inter-event intervals) underlie significant main genotype effects, to similar extents, in slices from 1 and 3 month animals, but there were no significant effects of genotype in 12 or 18 month slices. Details of 2-way RM-ANOVA and Holm-Sidak post-tests are shown below.
Figure 2—figure supplement 2. GKI SPN sEPSC frequency is similarly increased in 1 and 3 month slices, and similar to WT in 12 and 18 month slices. Whole-cell recording in dorsolateral striatal SPNs and analysis of sEPSCs recorded at −70 mV. Higher sEPSC frequencies (as reflected by decreased inter-event intervals) underlie significant main genotype effects, to similar extents, in slices from 1 and 3 month animals, but there were no significant effects of genotype in 12 or 18 month slices. Details of 2-way RM-ANOVA and Holm-Sidak post-tests are shown below.CC BY · PubMed Central
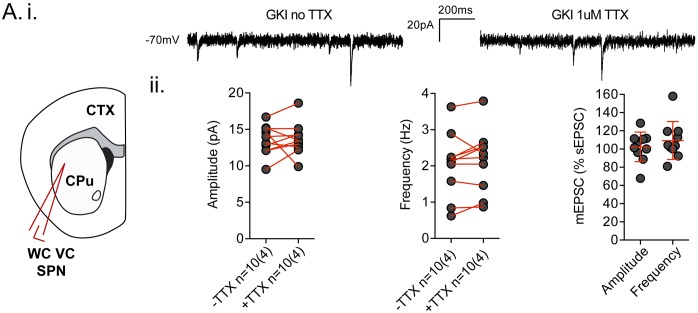
Figure 2—figure supplement 3. Spontaneous EPSCs recorded in dorsolateral striatum in the coronal slice preparation are TTX insensitive. (A.i) Example traces of spontaneous EPSCs (sEPSCs) in whole-cell voltage-clamp (WCVC) recordings in striatal projection neurons (SPN) of the dorsolateral striatum, prior to, and in the presence of, tetrodotoxin (TTX; 1 uM) rendering any remaining responses miniature EPSCs (mEPSCs). (ii) There was no significant effect of TTX upon mean sEPSC amplitude (paired t-test p=0.82) or frequency (paired t-test p=0.29) within each cell. Expressed as a percentage of the initial sEPSC mean value, neither mEPSC amplitudes nor frequencies were significantly altered by TTX application (one-sample t-test against 100, p=0.7 and 0.2 respectively). The weak trend in frequency was towards increases in GKI, rather than the decreases predicted if action potential-dependent events were contributing to mean sEPSC frequency.
Figure 2—figure supplement 3. Spontaneous EPSCs recorded in dorsolateral striatum in the coronal slice preparation are TTX insensitive. (A.i) Example traces of spontaneous EPSCs (sEPSCs) in whole-cell voltage-clamp (WCVC) recordings in striatal projection neurons (SPN) of the dorsolateral striatum, prior to, and in the presence of, tetrodotoxin (TTX; 1 uM) rendering any remaining responses miniature EPSCs (mEPSCs). (ii) There was no significant effect of TTX upon mean sEPSC amplitude (paired t-test p=0.82) or frequency (paired t-test p=0.29) within each cell. Expressed as a percentage of the initial sEPSC mean value, neither mEPSC amplitudes nor frequencies were significantly altered by TTX application (one-sample t-test against 100, p=0.7 and 0.2 respectively). The weak trend in frequency was towards increases in GKI, rather than the decreases predicted if action potential-dependent events were contributing to mean sEPSC frequency.CC BY · PubMed Central
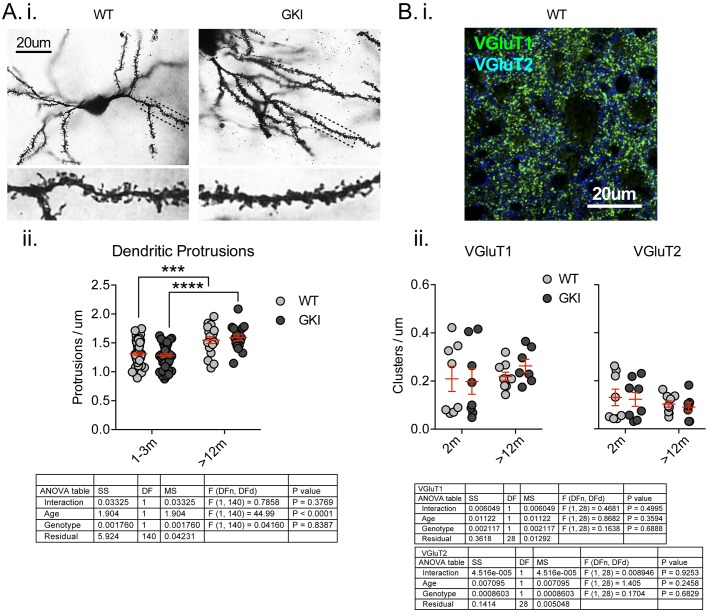
Figure 2—figure supplement 4. There are no differences in the number of postsynaptic specializations, or presynaptic excitatory nerve terminal markers in the striatum of young or aged GKI mice. (A) Representative bright-field images of Golgi-impregnated medium-sized spiny projection neurons (SPNs) of the dorsolateral striatum from WT and GKI mice aged 1–3 months (i), with inserts showing a zoom of areas marked in main image by dashed lines. There were significant increases in the density of postsynaptic protrusions as animals aged between 1–3 and > 12 months, but there were no significant differences between WT and GKI dendritic protrusions at either age (WT n = 57(9) and 18(3), GKI n = 56(9) and 16(3), for 1–3 and >12, respectively). (B) Representative confocal micrograph of VGluT1 and VGluT2 immunofluorescence staining in 2 month-old WT dorsolateral striatum, demonstrating the expected pattern of a higher density of VGluT1 than VGluT2 glutamatergic terminals and very little overlap between VGluT1 and VGluT2 (i). There were no significant effects of age or genotype upon VGluT1 or VGluT2 cluster densities (ii; WT n = 8 (4) and 9 (4), GKI n = 8 (4) and 7 (4), for 2 m and >12 m, respectively). Details of 2-way ANOVA and Holm-Sidak post-tests are shown below.
Figure 2—figure supplement 4. There are no differences in the number of postsynaptic specializations, or presynaptic excitatory nerve terminal markers in the striatum of young or aged GKI mice. (A) Representative bright-field images of Golgi-impregnated medium-sized spiny projection neurons (SPNs) of the dorsolateral striatum from WT and GKI mice aged 1–3 months (i), with inserts showing a zoom of areas marked in main image by dashed lines. There were significant increases in the density of postsynaptic protrusions as animals aged between 1–3 and > 12 months, but there were no significant differences between WT and GKI dendritic protrusions at either age (WT n = 57(9) and 18(3), GKI n = 56(9) and 16(3), for 1–3 and >12, respectively). (B) Representative confocal micrograph of VGluT1 and VGluT2 immunofluorescence staining in 2 month-old WT dorsolateral striatum, demonstrating the expected pattern of a higher density of VGluT1 than VGluT2 glutamatergic terminals and very little overlap between VGluT1 and VGluT2 (i). There were no significant effects of age or genotype upon VGluT1 or VGluT2 cluster densities (ii; WT n = 8 (4) and 9 (4), GKI n = 8 (4) and 7 (4), for 2 m and >12 m, respectively). Details of 2-way ANOVA and Holm-Sidak post-tests are shown below.CC BY · PubMed Central
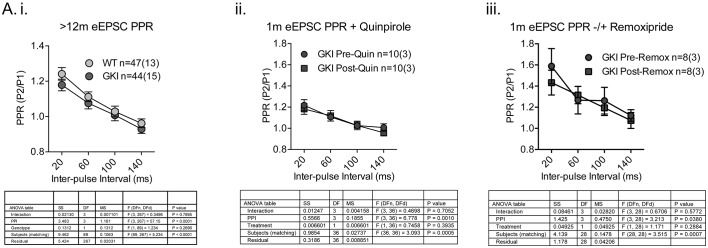
Figure 2—figure supplement 5. Paired-pulse facilitation profiles in the striatum of aged GKI mice are similar and GKI mutant PPRs are insensitive to dopamine agonism and antagonism. Whole-cell patch clamp recording and eEPSC paired-pulse experiments. (i) There were no significant differences in glutamatergic paired-pulse ratio at > 12 months, similarly to the 1–3 month age point in the absence of quinpirole (Figure 2.C). At 1 month of age, when WT and GKI PPRs differ significantly in the presence of quinpirole (Figure 2.C), GKI PPRs were insensitive to both dopamine agonism (ii. 10 uM quinpirole) and antagonism (iii. 10 uM remoxipride). Details of 2-way ANOVA and Holm-Sidak post-tests are shown below.
Figure 2—figure supplement 5. Paired-pulse facilitation profiles in the striatum of aged GKI mice are similar and GKI mutant PPRs are insensitive to dopamine agonism and antagonism. Whole-cell patch clamp recording and eEPSC paired-pulse experiments. (i) There were no significant differences in glutamatergic paired-pulse ratio at > 12 months, similarly to the 1–3 month age point in the absence of quinpirole (Figure 2.C). At 1 month of age, when WT and GKI PPRs differ significantly in the presence of quinpirole (Figure 2.C), GKI PPRs were insensitive to both dopamine agonism (ii. 10 uM quinpirole) and antagonism (iii. 10 uM remoxipride). Details of 2-way ANOVA and Holm-Sidak post-tests are shown below.CC BY · PubMed Central
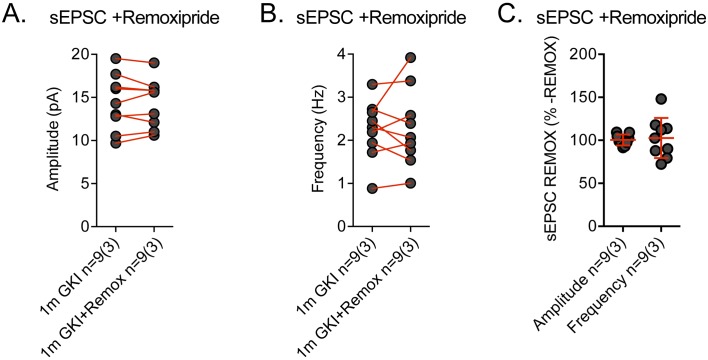
Figure 2—figure supplement 6. Spontaneous EPSCs recorded in GKI dorsolateral striatum SNPs are remoxipride insensitive. Spontaneous EPSCs (sEPSCs) were recorded prior to, and in the presence of, remoxipride (Remox; 10 uM). (A) There was no significant effect of remoxipride upon mean sEPSC amplitude (paired t-test p=0.86) or frequency (paired t-test p=0.80) within each cell. Expressed as a percentage of the initial sEPSC mean value, neither amplitude nor frequency was significantly altered by remoxipride application (one-sample t-test against 100, p=0.84 and 0.74, respectively).
Figure 2—figure supplement 6. Spontaneous EPSCs recorded in GKI dorsolateral striatum SNPs are remoxipride insensitive. Spontaneous EPSCs (sEPSCs) were recorded prior to, and in the presence of, remoxipride (Remox; 10 uM). (A) There was no significant effect of remoxipride upon mean sEPSC amplitude (paired t-test p=0.86) or frequency (paired t-test p=0.80) within each cell. Expressed as a percentage of the initial sEPSC mean value, neither amplitude nor frequency was significantly altered by remoxipride application (one-sample t-test against 100, p=0.84 and 0.74, respectively).CC BY · PubMed Central
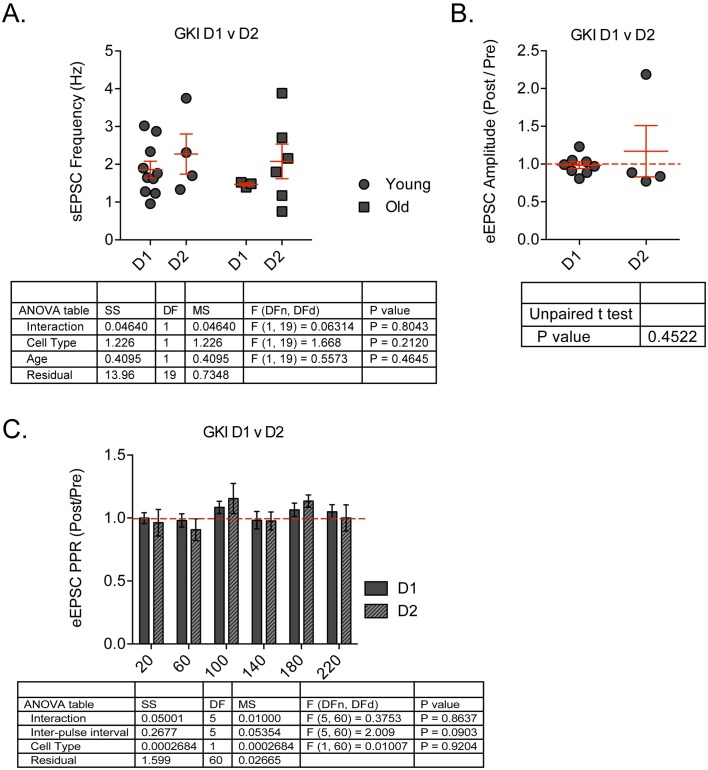
Figure 2—figure supplement 7. There were no differences in GKI sEPSC frequency between D1- and D2-dopamine receptor expressing SPNs, and no consistent effect of quinpirole upon eEPSC peak or PPR in either cell type. Whole-cell patch clamp recording in D1 vs. D2-type SPNs in GKI slices. (A) There were no differences in sEPSC mean event frequency in either cell type at young (1–3 m) or old (>12 m) age points. (B) The D2 agonist quinpirole had no consistent modulatory effect upon D1 or D2 eEPSC peak amplitudes, or Paired-pulse ratios expressed as post-application values over pre-application (C). 2-way ANOVA and unpaired Student’s t-test values are shown.
Figure 2—figure supplement 7. There were no differences in GKI sEPSC frequency between D1- and D2-dopamine receptor expressing SPNs, and no consistent effect of quinpirole upon eEPSC peak or PPR in either cell type. Whole-cell patch clamp recording in D1 vs. D2-type SPNs in GKI slices. (A) There were no differences in sEPSC mean event frequency in either cell type at young (1–3 m) or old (>12 m) age points. (B) The D2 agonist quinpirole had no consistent modulatory effect upon D1 or D2 eEPSC peak amplitudes, or Paired-pulse ratios expressed as post-application values over pre-application (C). 2-way ANOVA and unpaired Student’s t-test values are shown.CC BY · PubMed Central
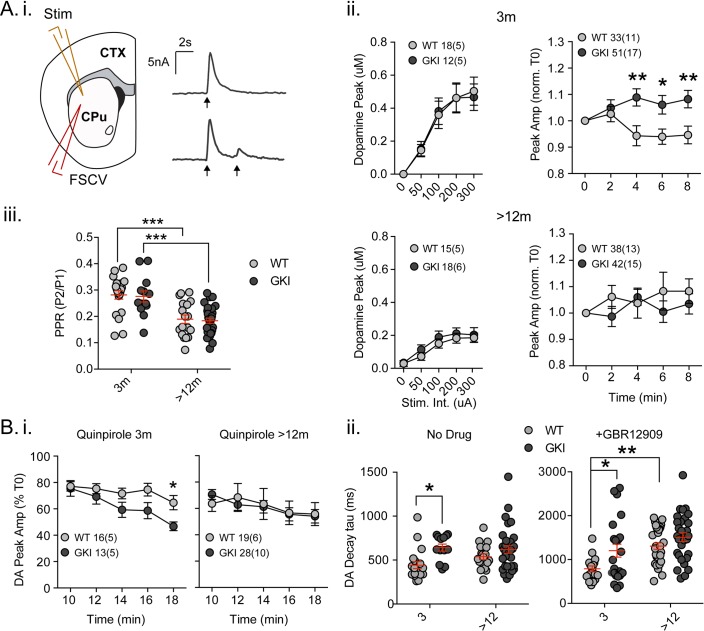
Figure 3. Increased nigrostriatal dopamine transmission in young GKI slices is lost with age, whereas early increases in dopamine extracellular lifetime are maintained in old GKI slices, and matched by age-related increases in WT slices. Fast-scan cyclic voltammetry (FSCV) was conducted in the dorsolateral striatum of acute slices prepared from WT and GKI mice. (A) Dopamine release and reuptake transients were evoked by single or paired (4 s IPI) local stimuli (i). There was no significant genotype effect (see text) on peak dopamine release over a range of stimulus intensities in slices from 3 month or > 12 month old mice (ii). Upon repeated stimulation, there were significant (post-test *p=0.05, **p=0.01), elevations in dopamine peak release in GKI mice, relative to WT controls at 3 months (ii). In WT and GKI slices from > 12 month mice, peak dopamine release was more variable, there was no modulation induced by repeated stimulation, as in younger slices, nor were there genotype differences. There was a significant age-dependent increase in D2 autoreceptor mediated paired-pulse depression (iii; 3 month n = 20(5) and 13(5),>12 month n = 18(6) and 30(11) for WT and GKI, respectively, post-test ***p=0.001), reflected by reduced paired-pule ratios (PPR), but there was no main effect of genotype (p=0.7) or genotype-age interaction (p=0.99). (B) The D2 agonist quinpirole (10 uM) equally suppressed peak evoked dopamine release in WT and GKI slices from 3 month mice after a 10 min wash-in; however, continued exposure revealed a trend toward a main effect of genotype (p=0.07) on repeated release, and a significant genotype-time interaction (p=0.039, post-test *p=0.049 at 18 min post application). This effect was not observed in > 12 month slices (i). Evoked dopamine transient decay time revealed a significant main genotype effect (ii. No drug, 3 month n = 20(5) and 13(5),>12 month n = 19(6) and 33(11) for WT and GKI, respectively p=0.0025) due to significantly longer decay times (slower transients) in 3 month GKI slices (post-test *p=0.027). In > 12 month slices, WT decay times had increased to a value similar to 3 month GKI (ii. No drug). The presence of the presynaptic dopamine transporter (DAT) blocker GBR (10 uM, ii. + GBR12909) increased all transient decay times, as expected. There were significant main effects of age and genotype (3 month n = 17(6) and 23(8),>12 month n = 31(9) and 30(11), p=0.0002 and 0.0043 for WT and GKI, respectively) upon transient lifetime; in the absence of dopamine re-uptake, 3 GKI transients were still significantly slower than WT controls (post-test *p=0.014), and significant age-dependent increases in dopamine decay times were observed in WT slices (post-test *p=0.0024).
Figure 3. Increased nigrostriatal dopamine transmission in young GKI slices is lost with age, whereas early increases in dopamine extracellular lifetime are maintained in old GKI slices, and matched by age-related increases in WT slices. Fast-scan cyclic voltammetry (FSCV) was conducted in the dorsolateral striatum of acute slices prepared from WT and GKI mice. (A) Dopamine release and reuptake transients were evoked by single or paired (4 s IPI) local stimuli (i). There was no significant genotype effect (see text) on peak dopamine release over a range of stimulus intensities in slices from 3 month or > 12 month old mice (ii). Upon repeated stimulation, there were significant (post-test *p=0.05, **p=0.01), elevations in dopamine peak release in GKI mice, relative to WT controls at 3 months (ii). In WT and GKI slices from > 12 month mice, peak dopamine release was more variable, there was no modulation induced by repeated stimulation, as in younger slices, nor were there genotype differences. There was a significant age-dependent increase in D2 autoreceptor mediated paired-pulse depression (iii; 3 month n = 20(5) and 13(5),>12 month n = 18(6) and 30(11) for WT and GKI, respectively, post-test ***p=0.001), reflected by reduced paired-pule ratios (PPR), but there was no main effect of genotype (p=0.7) or genotype-age interaction (p=0.99). (B) The D2 agonist quinpirole (10 uM) equally suppressed peak evoked dopamine release in WT and GKI slices from 3 month mice after a 10 min wash-in; however, continued exposure revealed a trend toward a main effect of genotype (p=0.07) on repeated release, and a significant genotype-time interaction (p=0.039, post-test *p=0.049 at 18 min post application). This effect was not observed in > 12 month slices (i). Evoked dopamine transient decay time revealed a significant main genotype effect (ii. No drug, 3 month n = 20(5) and 13(5),>12 month n = 19(6) and 33(11) for WT and GKI, respectively p=0.0025) due to significantly longer decay times (slower transients) in 3 month GKI slices (post-test *p=0.027). In > 12 month slices, WT decay times had increased to a value similar to 3 month GKI (ii. No drug). The presence of the presynaptic dopamine transporter (DAT) blocker GBR (10 uM, ii. + GBR12909) increased all transient decay times, as expected. There were significant main effects of age and genotype (3 month n = 17(6) and 23(8),>12 month n = 31(9) and 30(11), p=0.0002 and 0.0043 for WT and GKI, respectively) upon transient lifetime; in the absence of dopamine re-uptake, 3 GKI transients were still significantly slower than WT controls (post-test *p=0.014), and significant age-dependent increases in dopamine decay times were observed in WT slices (post-test *p=0.0024).CC BY · PubMed Central
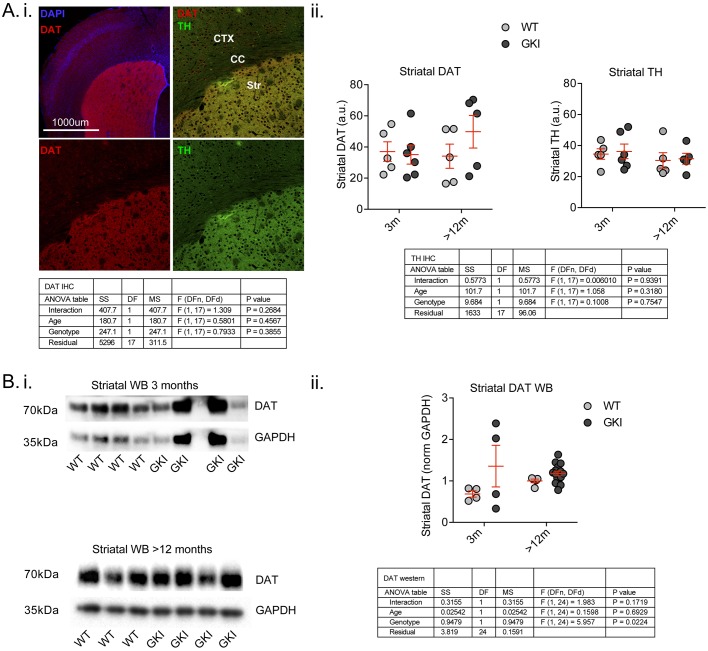
Figure 3—figure supplement 1. Early alterations in GKI dopamine release are not associated with reductions in nigrostriatal dopamine markers and persist despite genotype-dependent increases in DAT protein levels by western blot. (A). Staining for presynaptic dopamine markers DAT and tyrosine hydroxylase (TH; i) showed highly specific enrichment in the striatum; however, there were no age or genotype differences (ii). Although variable, the data suggest there is no loss of either terminal marker in GKI striatum. (B) Striatal DAT levels were also assessed by western blot (i); although variable results in young GKI mice suggest no loss of DAT. ii) A significant main genotype effect (due to increased DAT levels in aged GKI mice) revealed increases in striatal DAT levels in the presence of endogenous G2019S. 2-way values are shown.
Figure 3—figure supplement 1. Early alterations in GKI dopamine release are not associated with reductions in nigrostriatal dopamine markers and persist despite genotype-dependent increases in DAT protein levels by western blot. (A). Staining for presynaptic dopamine markers DAT and tyrosine hydroxylase (TH; i) showed highly specific enrichment in the striatum; however, there were no age or genotype differences (ii). Although variable, the data suggest there is no loss of either terminal marker in GKI striatum. (B) Striatal DAT levels were also assessed by western blot (i); although variable results in young GKI mice suggest no loss of DAT. ii) A significant main genotype effect (due to increased DAT levels in aged GKI mice) revealed increases in striatal DAT levels in the presence of endogenous G2019S. 2-way values are shown.CC BY · PubMed Central

Verification

Claims the paper makes

The claims and statistics of this paper haven’t been checked yet.

Run the check — free, no account needed. It reads the open-access text and checks the sources it cites.

A few free checks a day · papers already verified open instantly · results are public

Claims other papers make about this one

Each is checked against this paper’s own text: does it say what the citing paper says it does?

Self-check

Percentages, sums and reported differences re-computed from the paper’s own numbers.

The self-check needs the paper’s full text.

Citations

Cites

Research works printed but not linked: 54

  1. Adams, 2005, PET in LRRK2 mutations: comparison to sporadic Parkinson's disease and evidence for presymptomatic compensation, Brain, 128, 2777, 10.1093/brain/awh607 · DOI
  2. Ade, 2011, An Improved BAC transgenic fluorescent reporter line for sensitive and specific identification of striatonigral medium spiny neurons, Frontiers in Systems Neuroscience, 5, 32, 10.3389/fnsys.2011.00032 · DOI
  3. Akopian, 2007, Reliable long-lasting depression interacts with variable short-term facilitation to determine corticostriatal paired-pulse plasticity in young rats, The Journal of Physiology, 580, 225, 10.1113/jphysiol.2006.115790 · DOI
  4. Bamford, 2004, Heterosynaptic dopamine neurotransmission selects sets of corticostriatal terminals, Neuron, 42, 653, 10.1016/S0896-6273(04)00265-X · DOI
  5. Beccano-Kelly, 2014, Synaptic function is modulated by LRRK2 and glutamate release is increased in cortical neurons of G2019S LRRK2 knock-in mice, Frontiers in Cellular Neuroscience, 8, 10.3389/fncel.2014.00301 · DOI · Paper page
  6. Beccano-Kelly, 2015, LRRK2 overexpression alters glutamatergic presynaptic plasticity, striatal dopamine tone, postsynaptic signal transduction, motor activity and memory, Human Molecular Genetics, 24, 1336, 10.1093/hmg/ddu543 · DOI · Paper page
  7. Broeders, 2013, Cognitive change in newly-diagnosed patients with Parkinson's disease: a 5-year follow-up study, Journal of the International Neuropsychological Society, 19, 695, 10.1017/S1355617713000295 · DOI
  8. Calabresi, 2014, Direct and indirect pathways of basal ganglia: a critical reappraisal, Nature Neuroscience, 17, 1022, 10.1038/nn.3743 · DOI
  9. Cepeda, 2008, Differential electrophysiological properties of dopamine D1 and D2 receptor-containing striatal medium-sized spiny neurons, European Journal of Neuroscience, 27, 671, 10.1111/j.1460-9568.2008.06038.x · DOI
  10. Chaudhuri, 2009, Non-motor symptoms of Parkinson's disease: dopaminergic pathophysiology and treatment, The Lancet Neurology, 8, 464, 10.1016/S1474-4422(09)70068-7 · DOI
  11. Crawford, 2015, Molecular underpinnings of synaptic vesicle pool heterogeneity, Traffic, 16, 338, 10.1111/tra.12262 · DOI
  12. Ding, 2008, Corticostriatal and thalamostriatal synapses have distinctive properties, Journal of Neuroscience, 28, 6483, 10.1523/JNEUROSCI.0435-08.2008 · DOI
  13. Gaig, 2014, Nonmotor symptoms in LRRK2 G2019S associated Parkinson's disease, PLoS One, 9, e108982, 10.1371/journal.pone.0108982 · DOI
  14. Gainetdinov, 2008, Dopamine transporter mutant mice in experimental neuropharmacology, Naunyn-Schmiedeberg's Archives of Pharmacology, 377, 301, 10.1007/s00210-007-0216-0 · DOI
  15. Gerfen, 2011, Modulation of striatal projection systems by dopamine, Annual Review of Neuroscience, 34, 441, 10.1146/annurev-neuro-061010-113641 · DOI
  16. Goldman, 2014, Premotor and nonmotor features of Parkinson's disease, Current Opinion in Neurology, 27, 434, 10.1097/WCO.0000000000000112 · DOI
  17. Goldman, 2015, Mild cognitive impairment: an update in Parkinson's disease and lessons learned from Alzheimer's disease, Neurodegenerative Disease Management, 5, 425, 10.2217/nmt.15.34 · DOI
  18. Haugland, 2002, Handbook of Fluorescent Probes and Research Products, 554
  19. Helmich, 2015, Reorganization of corticostriatal circuits in healthy G2019S LRRK2 carriers, Neurology, 84, 399, 10.1212/WNL.0000000000001189 · DOI
  20. Hulihan, 2008, LRRK2 Gly2019Ser penetrance in Arab-Berber patients from Tunisia: a case-control genetic study, The Lancet Neurology, 7, 591, 10.1016/S1474-4422(08)70116-9 · DOI
  21. Jenner, 2013, Parkinson's disease--the debate on the clinical phenomenology, aetiology, pathology and pathogenesis, Journal of Parkinson's disease, 3, 1, 10.3233/JPD-130175 · DOI
  22. Jones, 1998, Profound neuronal plasticity in response to inactivation of the dopamine transporter, PNAS, 95, 4029, 10.1073/pnas.95.7.4029 · DOI
  23. Kachergus, 2005, Identification of a novel LRRK2 mutation linked to autosomal dominant parkinsonism: evidence of a common founder across European populations, The American Journal of Human Genetics, 76, 672, 10.1086/429256 · DOI
  24. Kalia, 2015, Parkinson's disease, The Lancet, 386, 896, 10.1016/S0140-6736(14)61393-3 · DOI · Paper page
  25. Kordower, 2013, Disease duration and the integrity of the nigrostriatal system in Parkinson's disease, Brain, 136, 2419, 10.1093/brain/awt192 · DOI
  26. Litvan, 2011, MDS Task Force on mild cognitive impairment in Parkinson's disease: critical review of PD-MCI, Movement Disorders, 26, 1814, 10.1002/mds.23823 · DOI
  27. Longo, 2014, Genetic and pharmacological evidence that G2019S LRRK2 confers a hyperkinetic phenotype, resistant to motor decline associated with aging, Neurobiology of Disease, 71, 62, 10.1016/j.nbd.2014.07.013 · DOI
  28. Longo, 2017, Age-dependent dopamine transporter dysfunction and Serine129 phospho-α-synuclein overload in G2019S LRRK2 mice, Acta Neuropathologica Communications, 5, 22, 10.1186/s40478-017-0426-8 · DOI
  29. Matikainen-Ankney, 2016, Altered development of synapse structure and function in striatum caused by parkinson's disease-linked lrrk2-g2019s mutation, Journal of Neuroscience, 36, 7128, 10.1523/JNEUROSCI.3314-15.2016 · DOI · Paper page
  30. Mei, 2016, Adult restoration of Shank3 expression rescues selective autistic-like phenotypes, Nature, 530, 481, 10.1038/nature16971 · DOI · Paper page
  31. Milnerwood, 2010, Early increase in extrasynaptic nmda receptor signaling and expression contributes to phenotype onset in huntington's disease mice, Neuron, 65, 178, 10.1016/j.neuron.2010.01.008 · DOI
  32. Milnerwood, 2013, Memory and synaptic deficits in Hip14/DHHC17 knockout mice, PNAS, 110, 20296, 10.1073/pnas.1222384110 · DOI
  33. Nandhagopal, 2008, Progression of dopaminergic dysfunction in a LRRK2 kindred: a multitracer PET study, Neurology, 71, 1790, 10.1212/01.wnl.0000335973.66333.58 · DOI
  34. Ozelius, 2006, LRRK2 G2019S as a cause of Parkinson's disease in Ashkenazi Jews, New England Journal of Medicine, 354, 424, 10.1056/NEJMc055509 · DOI
  35. Parisiadou, 2014, LRRK2 regulates synaptogenesis and dopamine receptor activation through modulation of PKA activity, Nature Neuroscience, 17, 367, 10.1038/nn.3636 · DOI
  36. Pedersen, 2013, Prognosis of mild cognitive impairment in early Parkinson disease: the Norwegian ParkWest study, JAMA neurology, 70, 580, 10.1001/jamaneurol.2013.2110 · DOI · Paper page
  37. Petkau, 2012, Synaptic dysfunction in progranulin-deficient mice, Neurobiology of Disease, 45, 711, 10.1016/j.nbd.2011.10.016 · DOI
  38. Phillips, 2002, Time window of autoreceptor-mediated inhibition of limbic and striatal dopamine release, Synapse, 44, 15, 10.1002/syn.10049 · DOI
  39. Ramirez, 2012, Vti1a identifies a vesicle pool that preferentially recycles at rest and maintains spontaneous neurotransmission, Neuron, 73, 121, 10.1016/j.neuron.2011.10.034 · DOI
  40. Rice, 2011, Dopamine release in the basal ganglia, Neuroscience, 198, 112, 10.1016/j.neuroscience.2011.08.066 · DOI
  41. Sara, 2005, An isolated pool of vesicles recycles at rest and drives spontaneous neurotransmission, Neuron, 45, 563, 10.1016/j.neuron.2004.12.056 · DOI
  42. Sciamanna, 2015, Optogenetic stimulation reveals distinct modulatory properties of thalamostriatal vs corticostriatal glutamatergic inputs to fast-spiking interneurons, Scientific Reports, 5, 16742, 10.1038/srep16742 · DOI
  43. Sossi, 2010, Dopamine turnover increases in asymptomatic LRRK2 mutations carriers, Movement Disorders, 25, 2717, 10.1002/mds.23356 · DOI
  44. Thaler, 2013, Neural correlates of executive functions in healthy G2019S LRRK2 mutation carriers, Cortex, 49, 2501, 10.1016/j.cortex.2012.12.017 · DOI
  45. Tolosa, 2007, The premotor phase of Parkinson's disease, Parkinsonism & Related Disorders, 13, S2, 10.1016/j.parkreldis.2007.06.007 · DOI
  46. Trinh, 2014, Comparative study of Parkinson's disease and leucine-rich repeat kinase 2 p.G2019S parkinsonism, Neurobiology of Aging, 35, 1125, 10.1016/j.neurobiolaging.2013.11.015 · DOI
  47. Vilas, 2015, Clinical and imaging markers in premotor LRRK2 G2019S mutation carriers, Parkinsonism & Related Disorders, 21, 1170, 10.1016/j.parkreldis.2015.08.007 · DOI
  48. Volta, 2015, Insights from late-onset familial parkinsonism on the pathogenesis of idiopathic Parkinson's disease, The Lancet Neurology, 14, 1054, 10.1016/S1474-4422(15)00186-6 · DOI
  49. Volta, 2015, Chronic and acute LRRK2 silencing has no long-term behavioral effects, whereas wild-type and mutant LRRK2 overexpression induce motor and cognitive deficits and altered regulation of dopamine release, Parkinsonism & Related Disorders, 21, 1156, 10.1016/j.parkreldis.2015.07.025 · DOI
  50. Weintraub, 2008, Parkinson's disease--Part 2: Treatment of motor symptoms, The American Journal of Managed Care, 14, S49
  51. Weintraub, 2008, Parkinson's disease--Part 3: neuropsychiatric symptoms, The American Journal of Managed Care, 14, S59
  52. Weintraub, 2008, Parkinson's disease--Part 1: Pathophysiology, symptoms, burden, diagnosis, and assessment, The American Journal of Managed Care, 14, S40
  53. Wile, 2017, Serotonin and dopamine transporter PET changes in the premotor phase of LRRK2 parkinsonism: cross-sectional studies, The Lancet Neurology, 16, 351, 10.1016/S1474-4422(17)30056-X · DOI
  54. Yue, 2015, Progressive dopaminergic alterations and mitochondrial abnormalities in LRRK2 G2019S knock-in mice, Neurobiology of Disease, 78, 172, 10.1016/j.nbd.2015.02.031 · DOI · Paper page

Cited by

Sorted by citations

See all 108

Metadata

Authors
Volta, M., Beccano-Kelly, D. A., Paschall, S. A., Cataldi, S., MacIsaac, S. E., Kuhlmann, N., Kadgien, C. A., Tatarnikov, I., Fox, J., Khinda, J., Mitchell, E., Bergeron, S., Melrose, H., Farrer, M. J., & Milnerwood, A. J.
Venue
eLife
Published
2017-09-20
Volume
6
ISSN
2050-084X
Cited by
108
References
2
Language
en
Funders
  • Michael J. Fox Foundation for Parkinson's Research
  • Parkinson Canada
  • Canadian Institutes of Health Research
  • Canada Excellence Research Chairs, Government of Canada

About these checks

Registry, retraction, Cites and statistics results are computed, not judged, with one exception: a printed reference that no index lists is read once by a model before it counts as a citation error. Claims are extracted by a model and kept only when their quote appears verbatim in the text; each cited source is then checked, with a model’s help, for whether it says what the claim relies on. Those verdicts can be wrong — read the claim’s quote and the cited source before relying on one.

Statistics and arithmetic are recomputed, not judged.

Confidence bands are shown only for fields calibrated on our annotated test set. None is calibrated yet, so no band is shown.

What counts as a claim ›How we measure confidence ›How we check this ›

Are you an author, or do you see a problem with this page? Request a review