Student or educator? Sign up with your school email and get 6 months of Pro free.
Cited by 79

The DOI matches its Crossref record; 7 of the 7 references it cites were found in a registry or an index.

Tau monomer encodes strains

Sharma, Apurwa M, Thomas, Talitha L, Woodard, DaNae R, Kashmer, Omar M, Diamond, Marc I·2018·eLife

Published version of a preprint

Abstract

Tauopathies have diverse presentation, progression, and neuropathology. They are linked to tau prion strains, self-replicating assemblies of unique quaternary conformation, whose origin is unknown. Strains can be propagated indefinitely in cultured cells, and induce unique patterns of transmissible neuropathology upon inoculation into mice. DS9 and DS10 cell lines propagate different synthetic strains that derive from recombinant tau. We previously observed that tau monomer adopts two conformational states: one that is inert (Mi) and one that is seed-competent (Ms) (Mirbaha et al., 2018). We have now found that Ms itself is comprised of multiple stable ensembles that encode unique strains. DS9 monomer inoculated into naive cells encoded only DS9, whereas DS10 monomer encoded multiple sub-strains. Sub-strains each induced distinct pathology upon inoculation into a tauopathy mouse model (PS19). Ms purified from an Alzeimer's disease brain encoded a single strain. Conversely, Ms from a corticobasal degeneration brain encoded three sub-strains, in which monomer from any one re-established all three upon inoculation into cells. Seed competent tau monomer thus adopts multiple, stable seed-competent conformations, each of which encodes a limited number of strains. This provides insight into the emergence of distinct tauopathies, and may improve diagnosis and therapy.

Overview

The claims and statistics of this paper haven’t been checked yet.

Run the check — free, no account needed. It reads the open-access text and checks the sources it cites.

A few free checks a day · papers already verified open instantly · results are public

Integrity signals

Registry

Crossref · 10.7554/elife.37813

Cites

7 of 7 references verified0 citation errors · 0 not checkable

Statistics

Figures

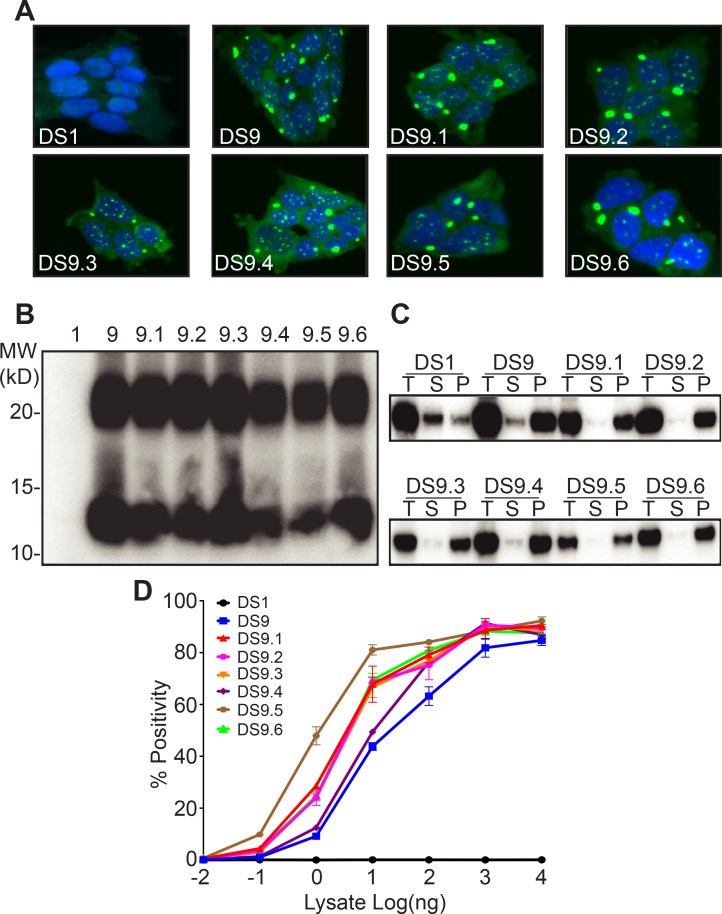
Figure 1. Tau Ms from DS9 retains strain identity. (A) Clones isolated from DS9 monomer (9.1–9.6) show morphological characteristics similar to DS9. (B) Limited proteolysis digests all the monomer from DS1, but reveals similar protease resistant band patterns for DS9 and DS9.1–9.6. Both DS9 and its sub-strains exhibited a band around 10 kD, and a second band between 20 and 25 kD. (C) Sedimentation analysis was performed on DS1, 9, and its substrains DS9.1–9.6. Total (T) lysate was resolved into supernatant (S) and pellet (P) fractions by ultracentrifugation. Supernatant to pellet ratio loaded on the gel was 1:1 for all samples. DS1 had tau in the supernatant, whereas DS9 and its substrains had tau predominantly in the pellet. The band represents RD-YFP at ~45 kD. (D) DS9 and sub-strains had similar seeding activities upon transduction into P301S FRET biosensor cells. Images are representative of thousands similar cells. Western blots are representative of at least three replicates. Seeding assays represent an individual experiment in which each data point represents a sample analyzed in triplicate. Error bars represent the standard deviation.
Figure 1. Tau Ms from DS9 retains strain identity. (A) Clones isolated from DS9 monomer (9.1–9.6) show morphological characteristics similar to DS9. (B) Limited proteolysis digests all the monomer from DS1, but reveals similar protease resistant band patterns for DS9 and DS9.1–9.6. Both DS9 and its sub-strains exhibited a band around 10 kD, and a second band between 20 and 25 kD. (C) Sedimentation analysis was performed on DS1, 9, and its substrains DS9.1–9.6. Total (T) lysate was resolved into supernatant (S) and pellet (P) fractions by ultracentrifugation. Supernatant to pellet ratio loaded on the gel was 1:1 for all samples. DS1 had tau in the supernatant, whereas DS9 and its substrains had tau predominantly in the pellet. The band represents RD-YFP at ~45 kD. (D) DS9 and sub-strains had similar seeding activities upon transduction into P301S FRET biosensor cells. Images are representative of thousands similar cells. Western blots are representative of at least three replicates. Seeding assays represent an individual experiment in which each data point represents a sample analyzed in triplicate. Error bars represent the standard deviation.CC BY · PubMed Central
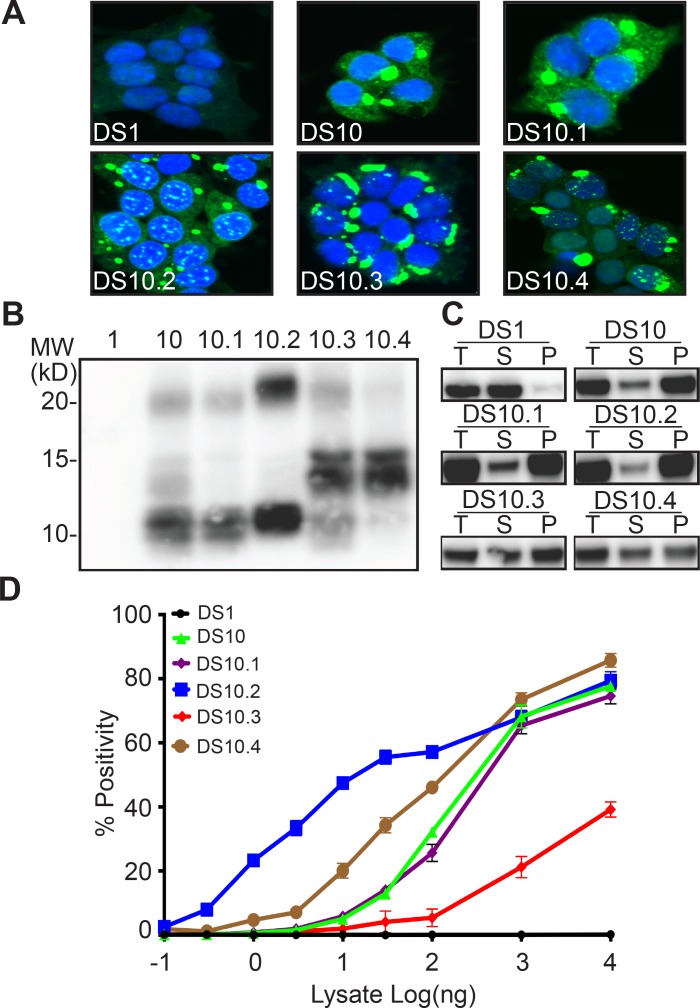
Figure 2. Tau Ms from DS10 creates multiple sub-strains. (A) Clones isolated from DS10 monomer give rise to cells with multiple morphologies. Four sub-strains were discriminated based on multiple tests. (B) Limited proteolysis of RD-YFP using pronase differentiated the protease resistant cores in the sub-strains. Lane 1 represents DS1, which is comprised of RD-YFP monomer that is completely digested. (C) Sedimentation analysis of RD-YFP was performed on DS1, 10, and DS10.1–4. Total (T) lysate was resolved into supernatant (S) and pellet (P) fractions by ultracentrifugation. Supernatant to pellet ratio loaded on the gel was 1:1 for all samples. DS1 had RD-YFP in the supernatant; DS10, 10.1 and 10.2 had most RD-YFP in the pellet; DS10.3 and DS10.4 had mixed RD-YFP solubility. (D) DS10 sub-strains had distinct seeding activities upon transduction into P301S FRET biosensor cells. Images are representative of thousands similar cells. Western blots are representative of at least three replicates. Seeding assays represent an individual experiment in which each data point represents a sample analyzed in triplicate. Error bars represent the standard deviation.
Figure 2. Tau Ms from DS10 creates multiple sub-strains. (A) Clones isolated from DS10 monomer give rise to cells with multiple morphologies. Four sub-strains were discriminated based on multiple tests. (B) Limited proteolysis of RD-YFP using pronase differentiated the protease resistant cores in the sub-strains. Lane 1 represents DS1, which is comprised of RD-YFP monomer that is completely digested. (C) Sedimentation analysis of RD-YFP was performed on DS1, 10, and DS10.1–4. Total (T) lysate was resolved into supernatant (S) and pellet (P) fractions by ultracentrifugation. Supernatant to pellet ratio loaded on the gel was 1:1 for all samples. DS1 had RD-YFP in the supernatant; DS10, 10.1 and 10.2 had most RD-YFP in the pellet; DS10.3 and DS10.4 had mixed RD-YFP solubility. (D) DS10 sub-strains had distinct seeding activities upon transduction into P301S FRET biosensor cells. Images are representative of thousands similar cells. Western blots are representative of at least three replicates. Seeding assays represent an individual experiment in which each data point represents a sample analyzed in triplicate. Error bars represent the standard deviation.CC BY · PubMed Central
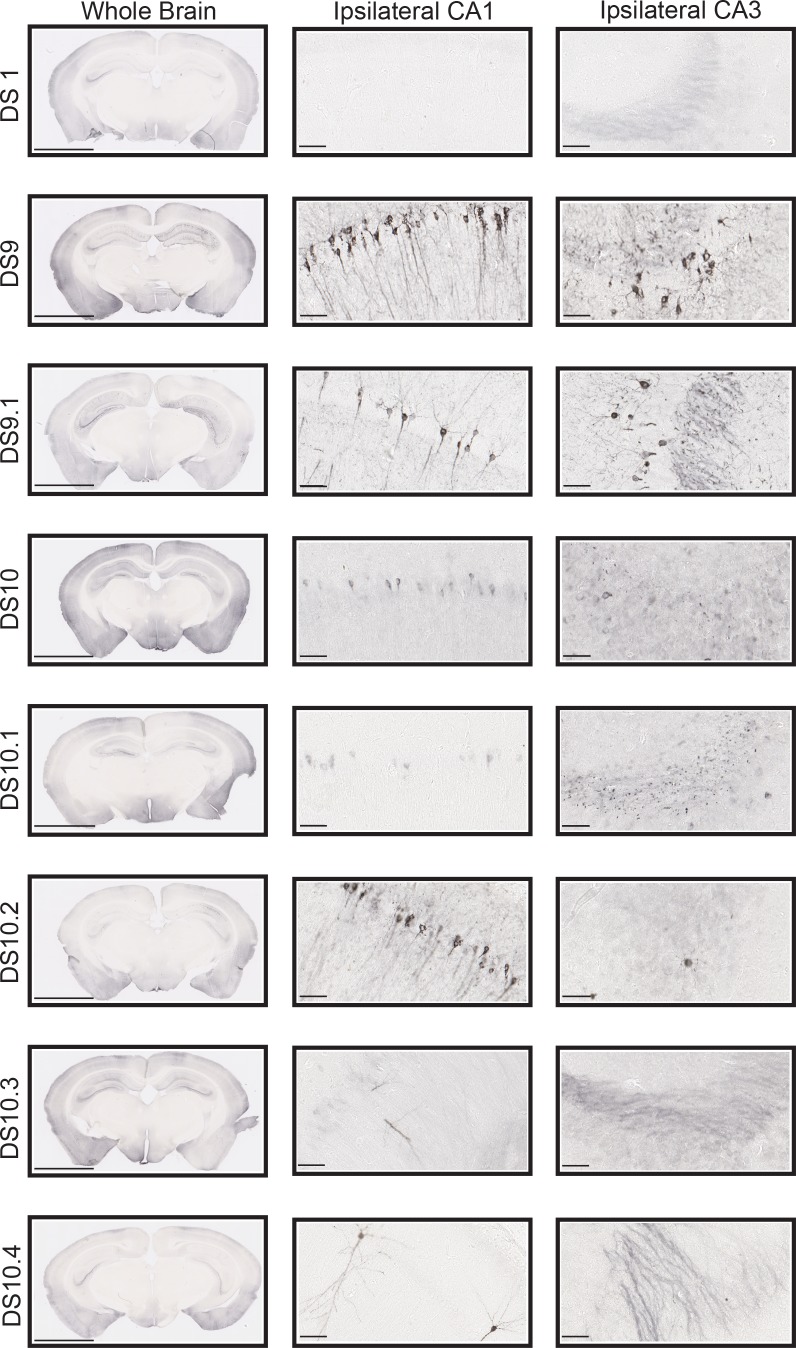
Figure 3. Sub-strains trigger unique tau pathology in P301S mice. 10 μg of clarified lysate was injected into the left hippocampi of 3 mo P301S mice, followed by AT8 staining after 4 weeks. Coronal images are oriented with the injection site on the left. DS9 and DS9.1 induced similar pathology in the CA1 and CA3 regions. DS1 induced no pathology. DS10 and DS10.1 induced similar pathology in CA1 and CA3. In both cases, we observed AT8 staining in the cell body throughout CA1 and AT8-positive puncta throughout CA3. DS10.2 induced AT8 signal in both the cell body and along the axons in CA1. There was very little pathology in CA3. DS10.3 induced very little AT8 signal in CA1 and none in CA3. DS10.4 likewise induced little pathology in CA1 region and none in CA3. Each image represents an example from five mice (3 males/2 females or 2 males/3 females per group) treated identically. We noted no differences in induced pathology between males and females. The scale bars represent 200 μm for the whole brain and 50 μm for the CA1 and CA3 regions.
Figure 3. Sub-strains trigger unique tau pathology in P301S mice. 10 μg of clarified lysate was injected into the left hippocampi of 3 mo P301S mice, followed by AT8 staining after 4 weeks. Coronal images are oriented with the injection site on the left. DS9 and DS9.1 induced similar pathology in the CA1 and CA3 regions. DS1 induced no pathology. DS10 and DS10.1 induced similar pathology in CA1 and CA3. In both cases, we observed AT8 staining in the cell body throughout CA1 and AT8-positive puncta throughout CA3. DS10.2 induced AT8 signal in both the cell body and along the axons in CA1. There was very little pathology in CA3. DS10.3 induced very little AT8 signal in CA1 and none in CA3. DS10.4 likewise induced little pathology in CA1 region and none in CA3. Each image represents an example from five mice (3 males/2 females or 2 males/3 females per group) treated identically. We noted no differences in induced pathology between males and females. The scale bars represent 200 μm for the whole brain and 50 μm for the CA1 and CA3 regions.CC BY · PubMed Central
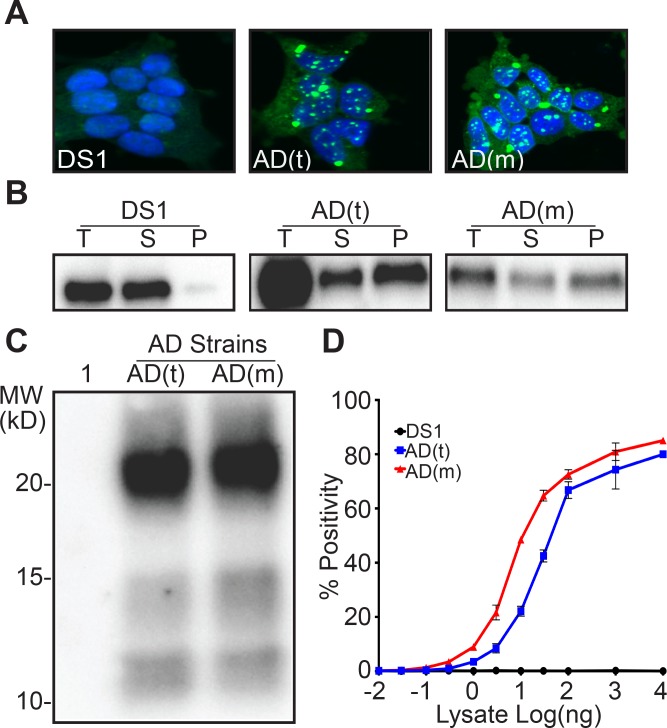
Figure 4. Ms derived from an AD patient produces a single strain. (A) Clonal cell lines derived from AD-derived total lysate, AD(t), and Ms, AD(m) exhibited identical inclusion morphologies. (B) RD-YFP derived from AD(t) and AD(m) had similar solubility profiles. RD-YFP in DS1 was only present in the supernatant fraction. Total (T) lysate was resolved into supernatant (S) and pellet (P) fractions by ultracentrifugation. Supernatant to pellet ratio loaded on the gel was 1:1 for all samples. (C) Limited proteolysis of RD-YFP aggregates from AD(t) and AD(m) clonal lines produced identical band patterns. Lane 1 represents DS1, which is comprised of RD-YFP monomer that is completely digested. (D) Lysates of AD(t) and AD(m) clonal lines had similar seeding profiles. Images are representative of thousands similar cells. Western blots are representative of at least three replicates. Seeding assays represent an individual experiment in which each data point represents a sample analyzed in triplicate. Error bars represent the standard deviation.
Figure 4. Ms derived from an AD patient produces a single strain. (A) Clonal cell lines derived from AD-derived total lysate, AD(t), and Ms, AD(m) exhibited identical inclusion morphologies. (B) RD-YFP derived from AD(t) and AD(m) had similar solubility profiles. RD-YFP in DS1 was only present in the supernatant fraction. Total (T) lysate was resolved into supernatant (S) and pellet (P) fractions by ultracentrifugation. Supernatant to pellet ratio loaded on the gel was 1:1 for all samples. (C) Limited proteolysis of RD-YFP aggregates from AD(t) and AD(m) clonal lines produced identical band patterns. Lane 1 represents DS1, which is comprised of RD-YFP monomer that is completely digested. (D) Lysates of AD(t) and AD(m) clonal lines had similar seeding profiles. Images are representative of thousands similar cells. Western blots are representative of at least three replicates. Seeding assays represent an individual experiment in which each data point represents a sample analyzed in triplicate. Error bars represent the standard deviation.CC BY · PubMed Central
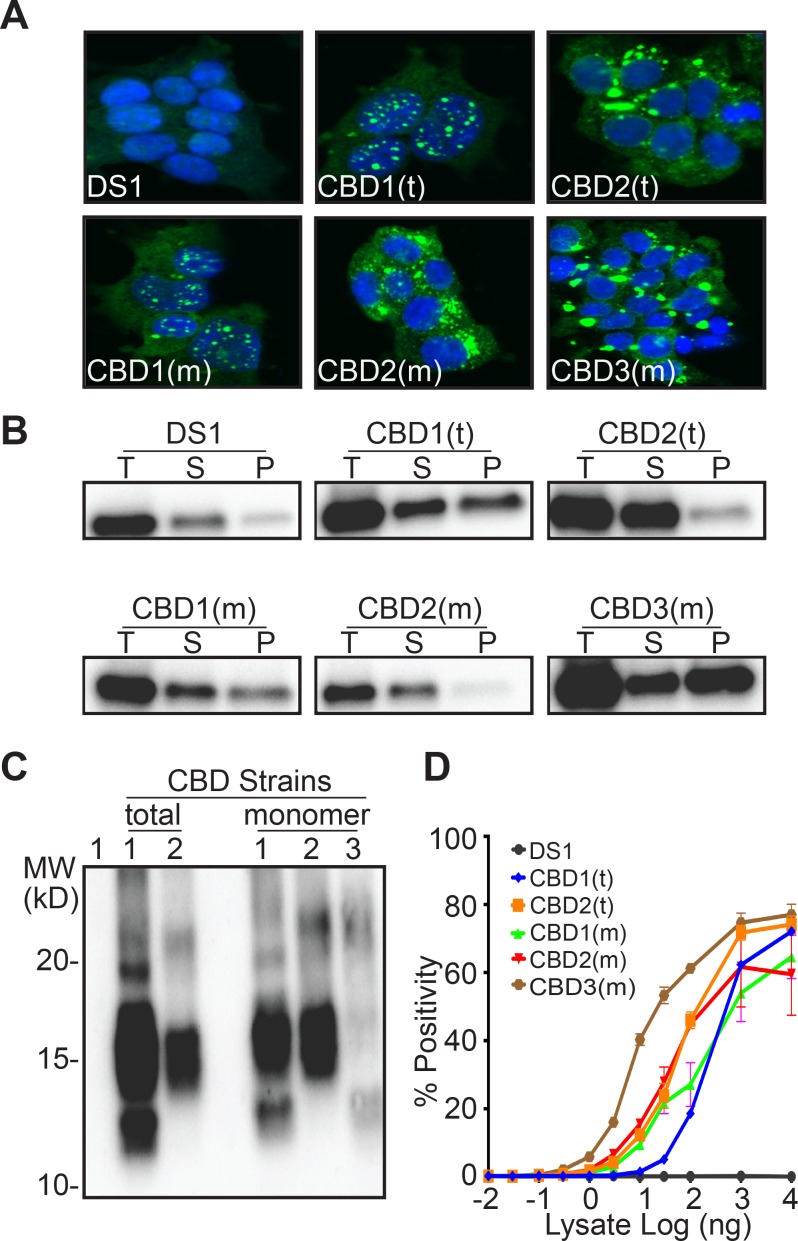
Figure 5. Ms derived from a CBD patient produces three distinct strains. (A) Clonal lines derived from CBD total lysate had two distinct inclusion patterns, CBD1(t), CBD2(t). Clonal lines derived from CBD Ms had two patterns identical to those from the total lysate, CBD1(m), CBD2(m), and a third, CBD3(m). (B) RD-YFP from CBD1(t) and CBD1(m) had mixed solubility. In CBD2(t) and CBD2(m), most RD-YFP was present in the supernatant. CBD3(m) had mixed solubility with most RD-YFP in the insoluble fraction. Total (T) lysate was resolved into supernatant (S) and pellet (P) fractions by ultracentrifugation. Supernatant to pellet ratio loaded on the gel was 1:1 for all samples. Lane 1 represents DS1, which is comprised of RD-YFP monomer that is completely digested. (C) RD-YFP aggregates from CBD1(t) and CBD1(m) exhibited similar patterns of proteolysis, with protease-resistant bands around 10–15 kD and a strong band around 15 kD. Proteolysis of RD-YFP from CBD2(t) and CBD2(m) only produced a strong band around 15 kD. CBD3(m) had a unique proteolysis pattern with a band around 10–15 kD. (D) Lysates from clones CBD1(t), CBD1(m), CBD2(t) and CBD2(m) had similar seeding profiles, while lysate from CBD3(m) had more potent seeding activity. Images are representative of thousands similar cells. Western blots are representative of at least three replicates. Seeding assays represent an individual experiment in which each data point represents a sample analyzed in triplicate. Error bars represent the standard deviation.
Figure 5. Ms derived from a CBD patient produces three distinct strains. (A) Clonal lines derived from CBD total lysate had two distinct inclusion patterns, CBD1(t), CBD2(t). Clonal lines derived from CBD Ms had two patterns identical to those from the total lysate, CBD1(m), CBD2(m), and a third, CBD3(m). (B) RD-YFP from CBD1(t) and CBD1(m) had mixed solubility. In CBD2(t) and CBD2(m), most RD-YFP was present in the supernatant. CBD3(m) had mixed solubility with most RD-YFP in the insoluble fraction. Total (T) lysate was resolved into supernatant (S) and pellet (P) fractions by ultracentrifugation. Supernatant to pellet ratio loaded on the gel was 1:1 for all samples. Lane 1 represents DS1, which is comprised of RD-YFP monomer that is completely digested. (C) RD-YFP aggregates from CBD1(t) and CBD1(m) exhibited similar patterns of proteolysis, with protease-resistant bands around 10–15 kD and a strong band around 15 kD. Proteolysis of RD-YFP from CBD2(t) and CBD2(m) only produced a strong band around 15 kD. CBD3(m) had a unique proteolysis pattern with a band around 10–15 kD. (D) Lysates from clones CBD1(t), CBD1(m), CBD2(t) and CBD2(m) had similar seeding profiles, while lysate from CBD3(m) had more potent seeding activity. Images are representative of thousands similar cells. Western blots are representative of at least three replicates. Seeding assays represent an individual experiment in which each data point represents a sample analyzed in triplicate. Error bars represent the standard deviation.CC BY · PubMed Central
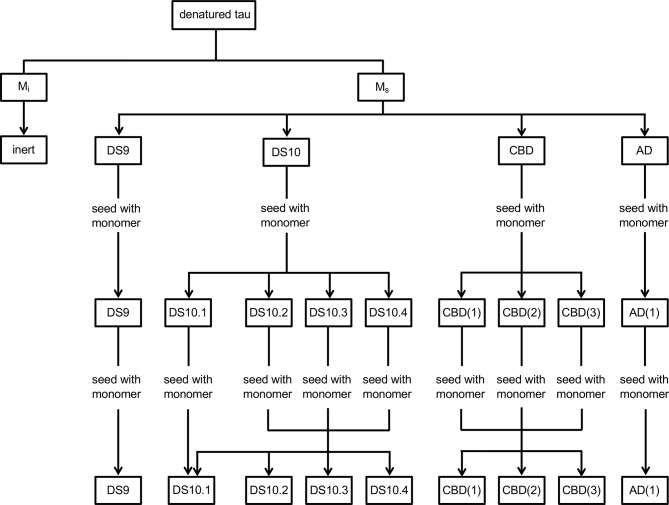
Figure 6. Model for families of monomer conformations. We propose a model that discriminates two general conformational ensembles: Mi and Ms. Mi is inert, whereas Ms has seeding activity. Within Ms, multiple conformations exist that can encode individual or multiple strains. Once an assembly forms, a strain will be faithfully replicated; however, if Ms is isolated from the strain, it can assemble to form a defined set of sub-strains.
Figure 6. Model for families of monomer conformations. We propose a model that discriminates two general conformational ensembles: Mi and Ms. Mi is inert, whereas Ms has seeding activity. Within Ms, multiple conformations exist that can encode individual or multiple strains. Once an assembly forms, a strain will be faithfully replicated; however, if Ms is isolated from the strain, it can assemble to form a defined set of sub-strains.CC BY · PubMed Central
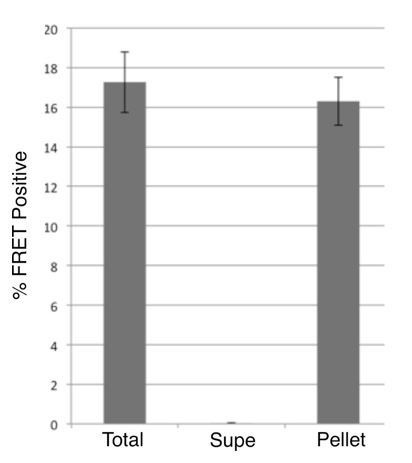
Author response image 1. Immunoprecipitation of seeding activity from DS10.2. Lysates from DS10.2 cells expressing tau RD-YFP in an aggregated form were exposed to HJ9.3 antibody, which recognizes tau aa306-321, followed by immunoprecipitation. Total, supernatant, and pellet fractions were transduced via Lipofectamine into tau RD-CFP/YFP FRET biosensor cells, and the percentage of cells with aggregates was quantified by flow cytometry. After exposure to anti-tau antibody, no seeding activity remained in the supernatant, and all had been removed to the pellet fraction.
Author response image 1. Immunoprecipitation of seeding activity from DS10.2. Lysates from DS10.2 cells expressing tau RD-YFP in an aggregated form were exposed to HJ9.3 antibody, which recognizes tau aa306-321, followed by immunoprecipitation. Total, supernatant, and pellet fractions were transduced via Lipofectamine into tau RD-CFP/YFP FRET biosensor cells, and the percentage of cells with aggregates was quantified by flow cytometry. After exposure to anti-tau antibody, no seeding activity remained in the supernatant, and all had been removed to the pellet fraction.CC BY · PubMed Central
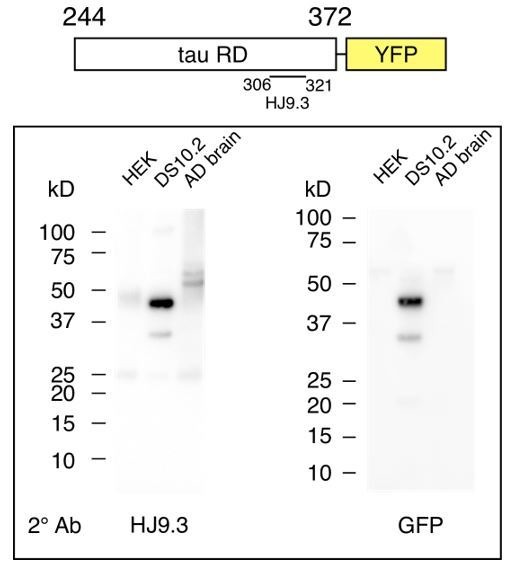
Author response image 2. Tau monomer from DS10.2 is predominantly full-length. Diagram indicates tau RD-YFP and the epitope of HJ9.3, which was used for initial
Author response image 2. Tau monomer from DS10.2 is predominantly full-length. Diagram indicates tau RD-YFP and the epitope of HJ9.3, which was used for initialCC BY · PubMed Central

Verification

Claims the paper makes

The claims and statistics of this paper haven’t been checked yet.

Run the check — free, no account needed. It reads the open-access text and checks the sources it cites.

A few free checks a day · papers already verified open instantly · results are public

Claims other papers make about this one

Each is checked against this paper’s own text: does it say what the citing paper says it does?

Self-check

Percentages, sums and reported differences re-computed from the paper’s own numbers.

The self-check needs the paper’s full text.

Citations

Cites

Show all 7 references

Research works printed but not linked: 8

  1. Clavaguera, 2013, Brain homogenates from human tauopathies induce tau inclusions in mouse brain, PNAS, 110, 9535, 10.1073/pnas.1301175110 · DOI · Paper page
  2. Holmes, 2014, Proteopathic tau seeding predicts tauopathy in vivo, Proceedings of the National Academy of Sciences, 111, E4376, 10.1073/pnas.1411649111 · DOI · Paper page
  3. Kaufman, 2016, Tau Prion Strains Dictate Patterns of Cell Pathology, Progression Rate, and Regional Vulnerability In Vivo, Neuron, 92, 796, 10.1016/j.neuron.2016.09.055 · DOI · Paper page
  4. Mirbaha, 2018, Inert and seed-competent tau monomers suggest structural origins of aggregation, eLife, 7, 338, 10.7554/eLife.36584 · DOI
  5. Ohhashi, 2018, Molecular basis for diversification of yeast prion strain conformation, PNAS, 115, 2389, 10.1073/pnas.1715483115 · DOI
  6. Sanders, 2014, Distinct tau prion strains propagate in cells and mice and define different tauopathies, Neuron, 82, 1271, 10.1016/j.neuron.2014.04.047 · DOI · Paper page
  7. von Bergen, 2000, Assembly of tau protein into Alzheimer paired helical filaments depends on a local sequence motif ((306)VQIVYK(311)) forming beta structure, PNAS, 97, 5129, 10.1073/pnas.97.10.5129 · DOI · Paper page
  8. von Bergen, 2001, Mutations of tau protein in frontotemporal dementia promote aggregation of paired helical filaments by enhancing local beta-structure, Journal of Biological Chemistry, 276, 48165, 10.1074/jbc.M105196200 · DOI

Cited by

See all 79

Metadata

Authors
Sharma, A. M., Thomas, T. L., Woodard, D. R., Kashmer, O. M., & Diamond, M. I.
Venue
eLife
Published
2018-12-11
Volume
7
ISSN
2050-084X
Cited by
79
References
7
Language
en
Funders
  • National Institutes of Health (1R01NS071835, R01NS089932)
  • Rainwater Charitable Foundation (Tau Consortium)

About these checks

Registry, retraction, Cites and statistics results are computed, not judged, with one exception: a printed reference that no index lists is read once by a model before it counts as a citation error. Claims are extracted by a model and kept only when their quote appears verbatim in the text; each cited source is then checked, with a model’s help, for whether it says what the claim relies on. Those verdicts can be wrong — read the claim’s quote and the cited source before relying on one.

Statistics and arithmetic are recomputed, not judged.

Confidence bands are shown only for fields calibrated on our annotated test set. None is calibrated yet, so no band is shown.

What counts as a claim ›How we measure confidence ›How we check this ›

Are you an author, or do you see a problem with this page? Request a review

How to cite

Cite CoChat for the checks on this page, and the paper for its own findings.

This page
CoChat. (2026). Citation check: Tau monomer encodes strains. https://app.cochat.ai/papers/10.7554/elife.37813
The paper
Sharma, A. M., Thomas, T. L., Woodard, D. R., Kashmer, O. M., & Diamond, M. I. (2018). Tau monomer encodes strains. eLife. https://doi.org/10.7554/elife.37813

Data sources

Bibliographic data: Semantic Scholar, OpenAlex, Crossref.

Contains information from the Semantic Scholar Academic Graph Datasets, made available under the ODC Attribution License (ODC-BY 1.0).

Semantic Scholar’s data is described in: Kinney, R., et al. (2023). The Semantic Scholar Open Data Platform. arXiv:2301.10140.