Cited by 120Hematopoietic Stem Cell TransplantationMesenchymal stem cell researchBlood disorders and treatments

The DOI matches its Crossref record; 56 of the 56 references it cites were found in a registry or an index.

Murine HSCs contribute actively to native hematopoiesis but with reduced differentiation capacity upon aging

Open access

Published version of a preprint

Abstract

A hallmark of adult hematopoiesis is the continuous replacement of blood cells with limited lifespans. While active hematopoietic stem cell (HSC) contribution to multilineage hematopoiesis is the foundation of clinical HSC transplantation, recent reports have questioned the physiological contribution of HSCs to normal/steady-state adult hematopoiesis. Here, we use inducible lineage tracing from genetically marked adult HSCs and reveal robust HSC-derived multilineage hematopoiesis. This commences via defined progenitor cells, but varies substantially in between different hematopoietic lineages. By contrast, adult HSC contribution to hematopoietic cells with proposed fetal origins is neglible. Finally, we establish that the HSC contribution to multilineage hematopoiesis declines with increasing age. Therefore, while HSCs are active contributors to native adult hematopoiesis, it appears that the numerical increase of HSCs is a physiologically relevant compensatory mechanism to account for their reduced differentiation capacity with age.

Overview

The claims and statistics of this paper haven’t been checked yet.

Run the check — free, no account needed. It reads the open-access text and checks the sources it cites.

A few free checks a day · papers already verified open instantly · results are public

Integrity signals

Registry

Crossref · 10.7554/elife.41258

Cites

56 of 56 references verified0 citation errors · 0 not checkable

Statistics

Figures

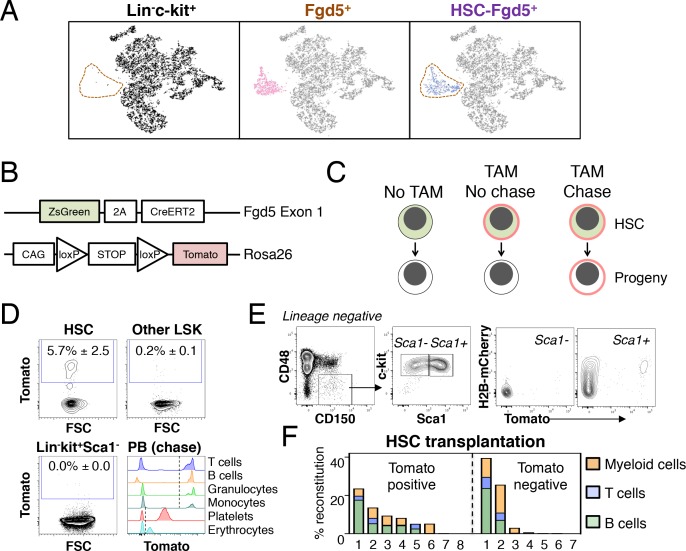
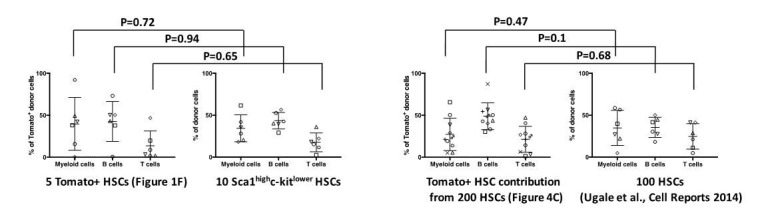
Figure 1. Fgd5-CreERT2 specifically labels HSCs and Fgd5-mediated label progresses throughout the hematopoietic system. (A) Lineage negative c-kit+ cells (Lin-c-kit+, left), lineage negative c-kit+ Fgd5+ cells (Fgd5+, middle) and lineage negative Fgd5+c-kit+Sca-1+CD150+CD48- cells (HSC-Fgd5+, right) were isolated and subjected to single cell RNA-sequencing. The data was aggregated and visualized in a two-dimensional scatter plot after PCA and tSNE dimensionality reduction. Fgd5+ cells are highlighted in pink (middle), Lin-c-kit+ cells are highlighted in black (left plot) and HSC-Fgd5+ cells are highlighted in blue (right plot). The area that Fgd5+ cells occupy in relation to the transcriptomes of Lin-c-kit+ cells and HSC-Fgd5+ cells is marked by a dotted line (left and right plots). (B) Schematic representation of the Fgd5CreERT2/+; Rosa26lsl-Tomato/+ model. ZsGreen and CreERT2 are expressed from the Fgd5 locus and expression of a Tomato allele is driven by a CAG promoter from the Rosa26 locus and is preceded by a LoxP flanked STOP cassette. (C) Model description; HSCs selectively and continuously express ZsGreen in an Fgd5-dependent manner. Upon Tamoxifen (TAM) administration, HSCs express Tomato and expression of Tomato label is inherited by all progeny of Tomato-expressing HSCs. (D) Representative FACS plots showing Tomato label in BM HSPCs from Fgd5CreERT2/+; Rosa26lsl-Tomato/+ mice that were injected with Tamoxifen 48 hr prior to analysis. (D, lower right) Representative histograms depicting Tomato label in PB cells at various time points after the start of Tamoxifen administration from mice in Figure 3B (T cells 48 weeks, B cells 25 weeks, granulocytes and monocytes 8 weeks, platelets and erythrocytes 13 weeks). Numbers in FACS plots depict the mean % of Tomato labeled cells ± SD (n = 5) and dashed lines in histograms indicates the boundary for Tomato positivity. (E) FACS plots showing H2B-mCherry label retention and Tomato labeling in Lineage-c-kit+CD150+CD48- and Sca1+ or Sca1- cells from a representative mouse that had diluted H2B-mCherry label for 5 weeks and were injected with Tamoxifen 5 days prior to analysis (n = 3; 14–19 weeks old at analysis). (F) The fraction of donor-derived cells among different blood cell lineages was assessed in individual mice 16 weeks post-transplantation in recipients of 5 Tomato+ (n = 8) or 5 Tomato- (n = 7) HSCs. Abbreviations: 2A, 2A self-cleaving peptide; CAG, CAG promoter; loxP, LoxP site.
Figure 1. Fgd5-CreERT2 specifically labels HSCs and Fgd5-mediated label progresses throughout the hematopoietic system. (A) Lineage negative c-kit+ cells (Lin-c-kit+, left), lineage negative c-kit+ Fgd5+ cells (Fgd5+, middle) and lineage negative Fgd5+c-kit+Sca-1+CD150+CD48- cells (HSC-Fgd5+, right) were isolated and subjected to single cell RNA-sequencing. The data was aggregated and visualized in a two-dimensional scatter plot after PCA and tSNE dimensionality reduction. Fgd5+ cells are highlighted in pink (middle), Lin-c-kit+ cells are highlighted in black (left plot) and HSC-Fgd5+ cells are highlighted in blue (right plot). The area that Fgd5+ cells occupy in relation to the transcriptomes of Lin-c-kit+ cells and HSC-Fgd5+ cells is marked by a dotted line (left and right plots). (B) Schematic representation of the Fgd5CreERT2/+; Rosa26lsl-Tomato/+ model. ZsGreen and CreERT2 are expressed from the Fgd5 locus and expression of a Tomato allele is driven by a CAG promoter from the Rosa26 locus and is preceded by a LoxP flanked STOP cassette. (C) Model description; HSCs selectively and continuously express ZsGreen in an Fgd5-dependent manner. Upon Tamoxifen (TAM) administration, HSCs express Tomato and expression of Tomato label is inherited by all progeny of Tomato-expressing HSCs. (D) Representative FACS plots showing Tomato label in BM HSPCs from Fgd5CreERT2/+; Rosa26lsl-Tomato/+ mice that were injected with Tamoxifen 48 hr prior to analysis. (D, lower right) Representative histograms depicting Tomato label in PB cells at various time points after the start of Tamoxifen administration from mice in Figure 3B (T cells 48 weeks, B cells 25 weeks, granulocytes and monocytes 8 weeks, platelets and erythrocytes 13 weeks). Numbers in FACS plots depict the mean % of Tomato labeled cells ± SD (n = 5) and dashed lines in histograms indicates the boundary for Tomato positivity. (E) FACS plots showing H2B-mCherry label retention and Tomato labeling in Lineage-c-kit+CD150+CD48- and Sca1+ or Sca1- cells from a representative mouse that had diluted H2B-mCherry label for 5 weeks and were injected with Tamoxifen 5 days prior to analysis (n = 3; 14–19 weeks old at analysis). (F) The fraction of donor-derived cells among different blood cell lineages was assessed in individual mice 16 weeks post-transplantation in recipients of 5 Tomato+ (n = 8) or 5 Tomato- (n = 7) HSCs. Abbreviations: 2A, 2A self-cleaving peptide; CAG, CAG promoter; loxP, LoxP site.CC BY · PubMed Central
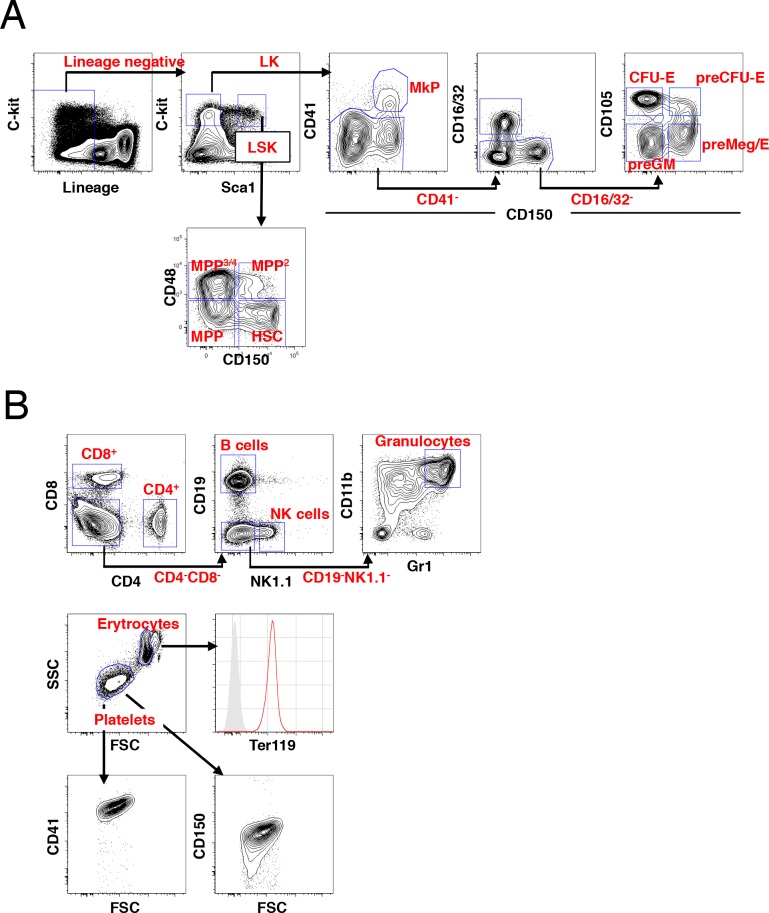
Figure 1—figure supplement 1. FACS gating strategies for identification of hematopoietic subsets. (A) The gating scheme for identification of HSCs/MPPs and myeloerythroid progenitors within the LSK and LK populations, respectively. (B) The gating scheme for identification of peripheral blood subsets. Red histogram display Ter119 expression in erythrocytes over an unlabeled control (grey histogram) and platelets identified by gating on scatter characteristics display expression of both CD41 and CD150.
Figure 1—figure supplement 1. FACS gating strategies for identification of hematopoietic subsets. (A) The gating scheme for identification of HSCs/MPPs and myeloerythroid progenitors within the LSK and LK populations, respectively. (B) The gating scheme for identification of peripheral blood subsets. Red histogram display Ter119 expression in erythrocytes over an unlabeled control (grey histogram) and platelets identified by gating on scatter characteristics display expression of both CD41 and CD150.CC BY · PubMed Central
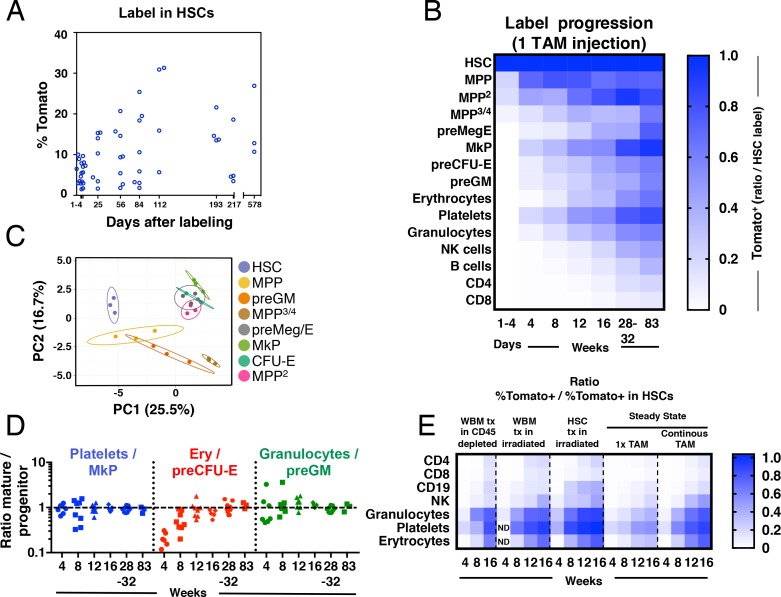
Figure 2. Fgd5-CreERT2 mediated lineage tracing reveals robust HSC contribution with distinct kinetics into hematopoietic cell subsets in steady state and after transplantation. Cohorts of Fgd5CreERT2/+; Rosa26lsl-Tomato/+ mice were chased for up to 83 weeks after receiving one Tamoxifen injection before endpoint analysis of the % of Tomato+ cells in HSCs (A) and hematopoietic progenitor and PB cell subsets (B). The fraction of Tomato+ cells in each indicated hematopoietic cell subset was divided by the % Tomato label in HSCs in corresponding mice to determine the ratio of Tomato+ cells relative to HSCs in individual mice. The average ratio is plotted according to time after the Tamoxifen (TAM) injection and displayed in a heat map format. Mice were analyzed at 1–4 days (n = 18) and at 4 (n = 7), 8 (n = 8), 12 (n = 8), 16 (n = 4), 28 (n = 4), 32 (n = 5) and 83 (n = 3) weeks after the Tamoxifen injection. All mice were between 5 and 11 weeks old at the time of Tamoxifen injection. (C) PCA plot of multiplexed qRT-PCR data for 48 genes from triplicates of 10 cells from each of the indicated populations. Ellipses show an area where a new observation from the same group would position itself with a probability of 0.95. Numbers indicate the % of variance in the total data set that the respective PC explains. (D) For individual animals, the % of Tomato+ cells in PB cell types was divided by the % of Tomato+ cells in the indicated progenitor cell types and this value was plotted according to the duration of the chase period. Symbols represent individual mice (number of mice analyzed as in A and B). A dashed line is drawn to indicate an equilibrium-ratio of 1. (E) Ratios calculated as in B and plotted according to the number of weeks after transplantation or after the start of Tamoxifen administration for steady state/native mice (n = 3 for WBM tx in CD45 depleted, n = 5 for WBM tx in irradiated, n = 11 for HSC tx in irradiated, n = 4–8 for 1x TAM, n = 4–9 for continous TAM). All Fgd5CreERT2/+; Rosa26lsl-Tomato/+ mice/cells were between 5 and 11 weeks old at the time of Tamoxifen administration or when used as cell donors for transplantation.
Figure 2. Fgd5-CreERT2 mediated lineage tracing reveals robust HSC contribution with distinct kinetics into hematopoietic cell subsets in steady state and after transplantation. Cohorts of Fgd5CreERT2/+; Rosa26lsl-Tomato/+ mice were chased for up to 83 weeks after receiving one Tamoxifen injection before endpoint analysis of the % of Tomato+ cells in HSCs (A) and hematopoietic progenitor and PB cell subsets (B). The fraction of Tomato+ cells in each indicated hematopoietic cell subset was divided by the % Tomato label in HSCs in corresponding mice to determine the ratio of Tomato+ cells relative to HSCs in individual mice. The average ratio is plotted according to time after the Tamoxifen (TAM) injection and displayed in a heat map format. Mice were analyzed at 1–4 days (n = 18) and at 4 (n = 7), 8 (n = 8), 12 (n = 8), 16 (n = 4), 28 (n = 4), 32 (n = 5) and 83 (n = 3) weeks after the Tamoxifen injection. All mice were between 5 and 11 weeks old at the time of Tamoxifen injection. (C) PCA plot of multiplexed qRT-PCR data for 48 genes from triplicates of 10 cells from each of the indicated populations. Ellipses show an area where a new observation from the same group would position itself with a probability of 0.95. Numbers indicate the % of variance in the total data set that the respective PC explains. (D) For individual animals, the % of Tomato+ cells in PB cell types was divided by the % of Tomato+ cells in the indicated progenitor cell types and this value was plotted according to the duration of the chase period. Symbols represent individual mice (number of mice analyzed as in A and B). A dashed line is drawn to indicate an equilibrium-ratio of 1. (E) Ratios calculated as in B and plotted according to the number of weeks after transplantation or after the start of Tamoxifen administration for steady state/native mice (n = 3 for WBM tx in CD45 depleted, n = 5 for WBM tx in irradiated, n = 11 for HSC tx in irradiated, n = 4–8 for 1x TAM, n = 4–9 for continous TAM). All Fgd5CreERT2/+; Rosa26lsl-Tomato/+ mice/cells were between 5 and 11 weeks old at the time of Tamoxifen administration or when used as cell donors for transplantation.CC BY · PubMed Central
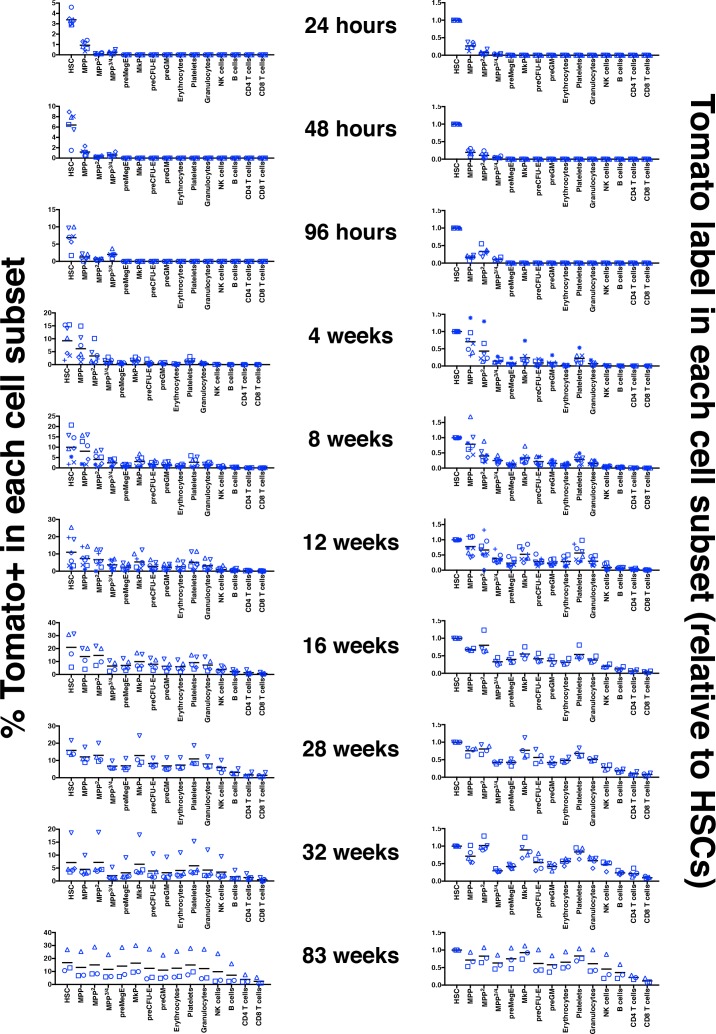
Figure 2—figure supplement 1. Label induction and progression in 1x Tamoxifen treated adult Fgd5CreERT2/+; Rosa26lsl-Tomato/+ mice. Left column: percentages of Tomato+ cells among the indicated hematopoietic subsets in bone marrow and peripheral blood at the indicated time after a single Tamoxifen injection. Right column: ratio of the % of Tomato+ cells in the indicated hematopoietic cell subsets relative to the % of Tomato+ HSCs in corresponding mice. Mice were analyzed 24 hr (n = 6), 48 hr (n = 6), 96 hr (n = 6), 4 w (n = 7), 8 w (n = 8), 12 w (n = 8), 16 w (n = 4), 28 w (n = 4), 32 w (n = 5) and 83 w (n = 3) after Tamoxifen injection. Cohorts of mice were injected with Tamoxifen in five different experiments. Symbols indicate individual mice and bars indicate the mean Tomato level at each time point evaluated.
Figure 2—figure supplement 1. Label induction and progression in 1x Tamoxifen treated adult Fgd5CreERT2/+; Rosa26lsl-Tomato/+ mice. Left column: percentages of Tomato+ cells among the indicated hematopoietic subsets in bone marrow and peripheral blood at the indicated time after a single Tamoxifen injection. Right column: ratio of the % of Tomato+ cells in the indicated hematopoietic cell subsets relative to the % of Tomato+ HSCs in corresponding mice. Mice were analyzed 24 hr (n = 6), 48 hr (n = 6), 96 hr (n = 6), 4 w (n = 7), 8 w (n = 8), 12 w (n = 8), 16 w (n = 4), 28 w (n = 4), 32 w (n = 5) and 83 w (n = 3) after Tamoxifen injection. Cohorts of mice were injected with Tamoxifen in five different experiments. Symbols indicate individual mice and bars indicate the mean Tomato level at each time point evaluated.CC BY · PubMed Central
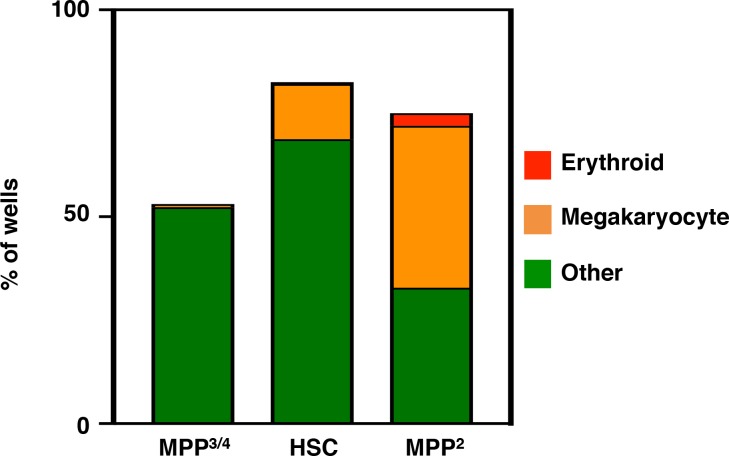
Figure 2—figure supplement 2. In vitro differentiation potential of LSK HSPCs. Single GMLPs (n = 279), HSCs (n = 240) and LSKCD150+CD48+ cells (n = 460) were seeded into Terasaki wells and cultured for 6 days before scoring wells for erythroid cells and megakaryocytes by microscopic evaluation. The % of wells containing erythroid cells (red), megakaryocytes (orange) or cells other than erythroid or megakaryocytes (green) are plotted in filled bars from the different indicated cells evaluated.
Figure 2—figure supplement 2. In vitro differentiation potential of LSK HSPCs. Single GMLPs (n = 279), HSCs (n = 240) and LSKCD150+CD48+ cells (n = 460) were seeded into Terasaki wells and cultured for 6 days before scoring wells for erythroid cells and megakaryocytes by microscopic evaluation. The % of wells containing erythroid cells (red), megakaryocytes (orange) or cells other than erythroid or megakaryocytes (green) are plotted in filled bars from the different indicated cells evaluated.CC BY · PubMed Central
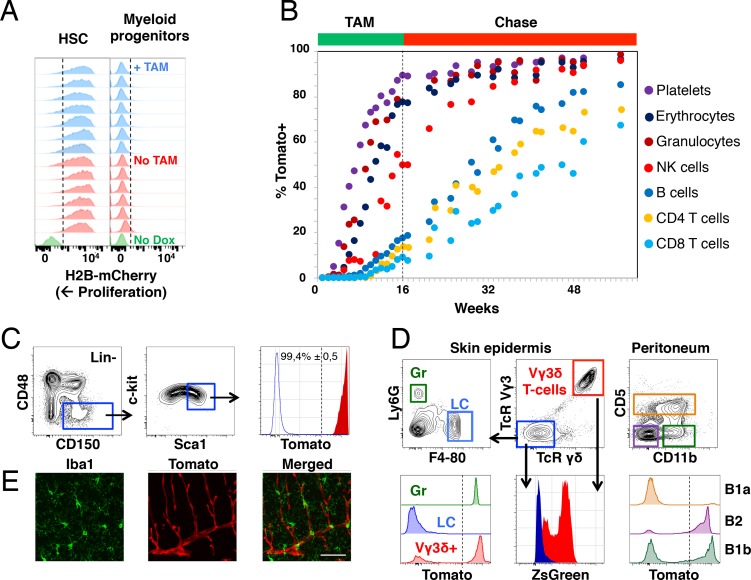
Figure 3. Fgd5-mediated lineage tracing after complete HSC labeling reveals limited adult HSCs contribution to tissue-resident immune cell subsets. (A) H2B-mCherry label retention in HSCs and myeloid progenitors after 5 weeks of chase in mice continuously fed Tamoxifen (TAM) containing food (blue histograms, n = 7) or normal food (red histograms, n = 6) during the chase period. Green histograms depict an unlabeled control. Dashed lines indicate the boundary for H2B-mCherry positivity. Lineage negative c-kit+Sca1- cells are denoted as myeloid progenitors. (B) Cohorts of Fgd5CreERT2/+; Rosa26lsl-Tomato/+ mice were continuously fed Tamoxifen food for 16 weeks (TAM phase) and thereafter normal chow during a chase phase of 32 weeks (n = 5) or 41 weeks (n = 4). During the TAM and chase phases, PB was regularly analyzed for Tomato label in the indicated subsets. Data points indicate the average % of Tomato label in each indicated subset. (C–E) Endpoint analysis, after 41 weeks chase, in mice from Figure 3B (n = 3). (C) Representative FACS plots showing the gating strategy to identify HSCs in lineage negative BM cells (left, middle) and depiction of the Tomato label in HSCs (right, red histogram) compared to an unlabeled control (blue histogram). Dashed line indicates the boundary for Tomato positivity, arrows indicate the gating strategy. (D) Representative FACS plots of cells isolated from skin tissue (epidermis) or the peritoneal cavity. Histograms show Tomato label (bottom left and right) or ZsGreen label (bottom middle) in the indicated subsets. Dashed line indicate the boundary for Tomato positivity, arrows indicate the gating hierarchy, gates and corresponding histograms are color matched. (E) Representative confocal images of the brain. (Left) IBA1 positive cells (green) are not labeled with Tomato (red, middle) while blood vessels are labeled with Tomato (middle). (Right) Merged images display both IBA1 staining and Tomato label. Scale bar = 50 μm. Mice in B-E were 5–6 weeks old at the start of Tamoxifen administration.
Figure 3. Fgd5-mediated lineage tracing after complete HSC labeling reveals limited adult HSCs contribution to tissue-resident immune cell subsets. (A) H2B-mCherry label retention in HSCs and myeloid progenitors after 5 weeks of chase in mice continuously fed Tamoxifen (TAM) containing food (blue histograms, n = 7) or normal food (red histograms, n = 6) during the chase period. Green histograms depict an unlabeled control. Dashed lines indicate the boundary for H2B-mCherry positivity. Lineage negative c-kit+Sca1- cells are denoted as myeloid progenitors. (B) Cohorts of Fgd5CreERT2/+; Rosa26lsl-Tomato/+ mice were continuously fed Tamoxifen food for 16 weeks (TAM phase) and thereafter normal chow during a chase phase of 32 weeks (n = 5) or 41 weeks (n = 4). During the TAM and chase phases, PB was regularly analyzed for Tomato label in the indicated subsets. Data points indicate the average % of Tomato label in each indicated subset. (C–E) Endpoint analysis, after 41 weeks chase, in mice from Figure 3B (n = 3). (C) Representative FACS plots showing the gating strategy to identify HSCs in lineage negative BM cells (left, middle) and depiction of the Tomato label in HSCs (right, red histogram) compared to an unlabeled control (blue histogram). Dashed line indicates the boundary for Tomato positivity, arrows indicate the gating strategy. (D) Representative FACS plots of cells isolated from skin tissue (epidermis) or the peritoneal cavity. Histograms show Tomato label (bottom left and right) or ZsGreen label (bottom middle) in the indicated subsets. Dashed line indicate the boundary for Tomato positivity, arrows indicate the gating hierarchy, gates and corresponding histograms are color matched. (E) Representative confocal images of the brain. (Left) IBA1 positive cells (green) are not labeled with Tomato (red, middle) while blood vessels are labeled with Tomato (middle). (Right) Merged images display both IBA1 staining and Tomato label. Scale bar = 50 μm. Mice in B-E were 5–6 weeks old at the start of Tamoxifen administration.CC BY · PubMed Central
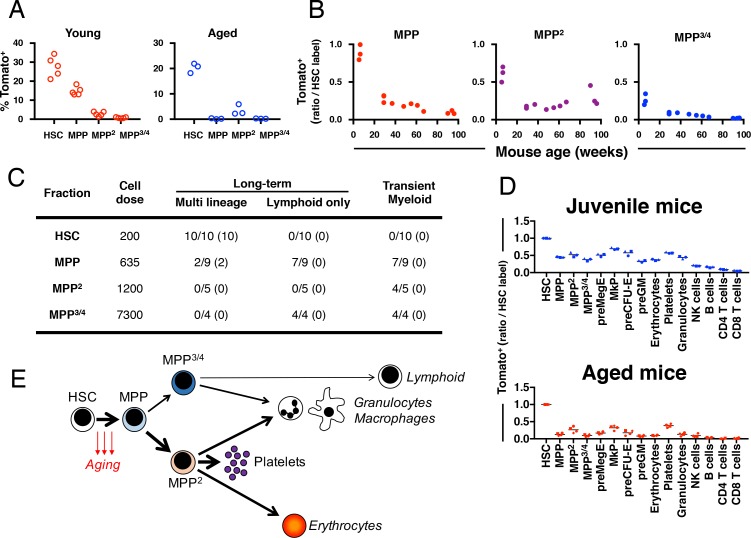
Figure 4. Fgd5 mediate lineage tracing reveals gradually declining HSC contribution to hematopoiesis with age. (A) Cohorts of aged (11–12 months; n = 3) or young (23–25 days; n = 5,) Fgd5CreERT2/+; Rosa26lsl-Tomato/+ mice were injected with Tamoxifen 5 times on consecutive days and analyzed for Tomato label in LSK-HSPCs on day 6. Bars indicate median %. (B) Fgd5CreERT2/+; Rosa26lsl-Tomato/+ mice were injected with Tamoxifen for 5 consecutive days and analyzed for Tomato label in LSK-HSPCs 21 days later. The % of Tomato+ cells in MPP2-4 was divided by the % of Tomato+ HSCs in corresponding mice to determine the ratio of Tomato+ cells relative to HSCs. Ratios are plotted according to the age of mice at the time of Tamoxifen injection. (C) Indicated LSK subsets were isolated from Fgd5CreERT2/+; Rosa26lsl-Tomato/+ mice and transplanted into WT mice on continuous Tamoxifen. Multilineage hematopoiesis and Tomato contribution was assed in PB 4, 8, 12 and 16 weeks after transplantation. Values in parenthesis indicate the number of mice with Tomato+ offspring. (D) Young (29 days; n = 3) and old (16 months; n = 4) Fgd5CreERT2/+; Rosa26lsl-Tomato/+ mice were injected once with Tamoxifen and analyzed for Tomato label 18 weeks later. The % of Tomato+ cells in each indicated cell type was divided by the % of Tomato+ HSCs in corresponding mice to determine the ratio of Tomato+ cells relative to HSCs. (E) Model depicting HSC contribution to native hematopoiesis. Arrow weights and arrow lengths indicate the magnitude and the kinetics of HSC contribution to the indicated cell type respectively. The declining HSC contribution to hematopoiesis with age can be traced to a reduced differentiation of HSCs to MPPs (red arrows).
Figure 4. Fgd5 mediate lineage tracing reveals gradually declining HSC contribution to hematopoiesis with age. (A) Cohorts of aged (11–12 months; n = 3) or young (23–25 days; n = 5,) Fgd5CreERT2/+; Rosa26lsl-Tomato/+ mice were injected with Tamoxifen 5 times on consecutive days and analyzed for Tomato label in LSK-HSPCs on day 6. Bars indicate median %. (B) Fgd5CreERT2/+; Rosa26lsl-Tomato/+ mice were injected with Tamoxifen for 5 consecutive days and analyzed for Tomato label in LSK-HSPCs 21 days later. The % of Tomato+ cells in MPP2-4 was divided by the % of Tomato+ HSCs in corresponding mice to determine the ratio of Tomato+ cells relative to HSCs. Ratios are plotted according to the age of mice at the time of Tamoxifen injection. (C) Indicated LSK subsets were isolated from Fgd5CreERT2/+; Rosa26lsl-Tomato/+ mice and transplanted into WT mice on continuous Tamoxifen. Multilineage hematopoiesis and Tomato contribution was assed in PB 4, 8, 12 and 16 weeks after transplantation. Values in parenthesis indicate the number of mice with Tomato+ offspring. (D) Young (29 days; n = 3) and old (16 months; n = 4) Fgd5CreERT2/+; Rosa26lsl-Tomato/+ mice were injected once with Tamoxifen and analyzed for Tomato label 18 weeks later. The % of Tomato+ cells in each indicated cell type was divided by the % of Tomato+ HSCs in corresponding mice to determine the ratio of Tomato+ cells relative to HSCs. (E) Model depicting HSC contribution to native hematopoiesis. Arrow weights and arrow lengths indicate the magnitude and the kinetics of HSC contribution to the indicated cell type respectively. The declining HSC contribution to hematopoiesis with age can be traced to a reduced differentiation of HSCs to MPPs (red arrows).CC BY · PubMed Central
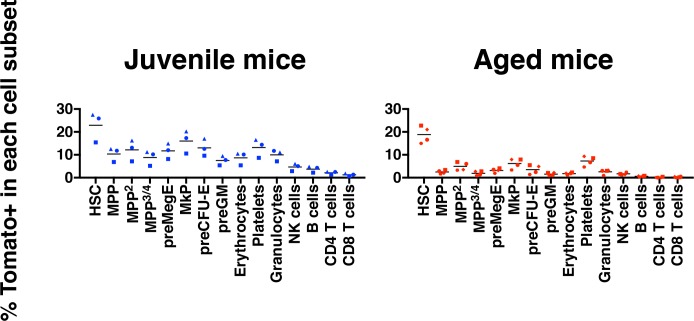
Figure 4—figure supplement 1. Aging associates with reduced multilineage HSC contribution. The percentages of Tomato+ cells among the indicated hematopoietic cells in bone marrow and peripheral blood 18 weeks following injection of Tamoxifen.
Figure 4—figure supplement 1. Aging associates with reduced multilineage HSC contribution. The percentages of Tomato+ cells among the indicated hematopoietic cells in bone marrow and peripheral blood 18 weeks following injection of Tamoxifen.CC BY · PubMed Central
Author response image 1. The Tomato fluorescent protein does not influence on the in vivo differentiation potential of HSCs.
Author response image 1. The Tomato fluorescent protein does not influence on the in vivo differentiation potential of HSCs.CC BY · PubMed Central
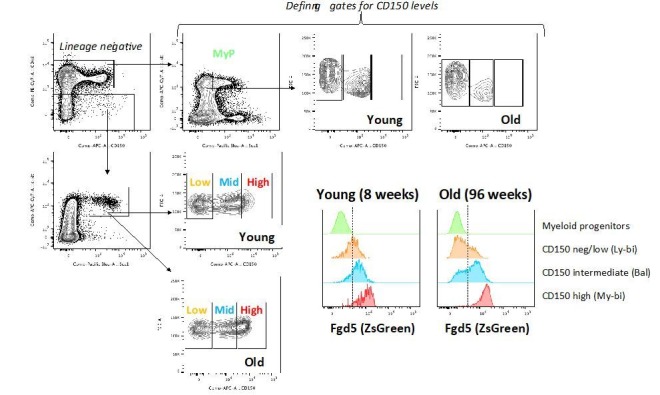
Author response image 2. The expression of Fgd5 in HSC subsets of young and old mice.
Author response image 2. The expression of Fgd5 in HSC subsets of young and old mice.CC BY · PubMed Central

Verification

Claims the paper makes

The claims and statistics of this paper haven’t been checked yet.

Run the check — free, no account needed. It reads the open-access text and checks the sources it cites.

A few free checks a day · papers already verified open instantly · results are public

Claims other papers make about this one

Each is checked against this paper’s own text: does it say what the citing paper says it does?

Self-check

Percentages, sums and reported differences re-computed from the paper’s own numbers.

The self-check needs the paper’s full text.

Citations

Cites

Show all 56 references

Cited by

Sorted by citations

See all 120

Metadata

Authors
Säwen, P., Eldeeb, M., Erlandsson, E., Kristiansen, T. A., Laterza, C., Kokaia, Z., Karlsson, G., Yuan, J., Soneji, S., Mandal, P. K., Rossi, D. J., & Bryder, D.
Affiliations
  • Division of Molecular Hematology, Department of Laboratory Medicine, Medical Faculty, Lund University, Lund, Sweden
  • Lund University (SE)
  • Boston Children's Hospital (US)
Corresponding author
Bryder, David
Venue
eLife
Published
2018-12-18
Volume
7
ISSN
2050-084X (ISSN-L)
OpenAlex
W2904698165
Cited by
120
References
56
Citations by year
2026: 7 · 2025: 20 · 2024: 16 · 2023: 16 · 2022: 19 · 2021: 13 · 2020: 19 · 2019: 10
FWCI
7.53
Type
journal article
Language
en
Open access
Locations
  • eLife (publishedVersion, cc-by)
  • bioRxiv (Cold Spring Harbor Laboratory) (acceptedVersion, cc-by)
  • Europe PMC (PubMed Central) (publishedVersion, cc-by)
  • PubMed Central (publishedVersion, cc-by)
  • PubMed (publishedVersion)
  • DOAJ (DOAJ: Directory of Open Access Journals) (submittedVersion, cc-by-sa)
  • Lund University Publications (Lund University) (submittedVersion)
  • Padua Research Archive (University of Padova) (submittedVersion)
Funders
  • Cancerfonden
  • The Tobias foundation (Tobias Prize)
  • Vetenskapsrådet
  • Knut och Alice Wallenbergs Stiftelse
  • European Research Council (ERC Consolidator grant (615068))
Topics
  • Health Sciences › Medicine › Hematology › Hematopoietic Stem Cell Transplantation
  • Life Sciences › Biochemistry, Genetics and Molecular Biology › Cell Biology › Mesenchymal stem cell research
  • Health Sciences › Medicine › Hematology › Blood disorders and treatments
Keywords
hematopoietic stem cells, multilineage hematopoiesis, HSC aging, hematopoietic progenitor cells, HSC expansion
MeSH terms
Age Factors, Aging, Animals, Cell Differentiation, Hematopoiesis, Hematopoietic Stem Cells, Staining and Labeling, Cell Lineage, Mice

About these checks

Registry, retraction, Cites and statistics results are computed, not judged, with one exception: a printed reference that no index lists is read once by a model before it counts as a citation error. Claims are extracted by a model and kept only when their quote appears verbatim in the text; each cited source is then checked, with a model’s help, for whether it says what the claim relies on. Those verdicts can be wrong — read the claim’s quote and the cited source before relying on one.

Statistics and arithmetic are recomputed, not judged.

Confidence bands are shown only for fields calibrated on our annotated test set. None is calibrated yet, so no band is shown.

What counts as a claim ›How we measure confidence ›How we check this ›

Are you an author, or do you see a problem with this page? Request a review