

The DOI matches its Crossref record; 8 of the 8 references it cites were found in a registry or an index.
Narrow equilibrium window for complex coacervation of tau and RNA under cellular conditions
Published version of a preprint
Abstract
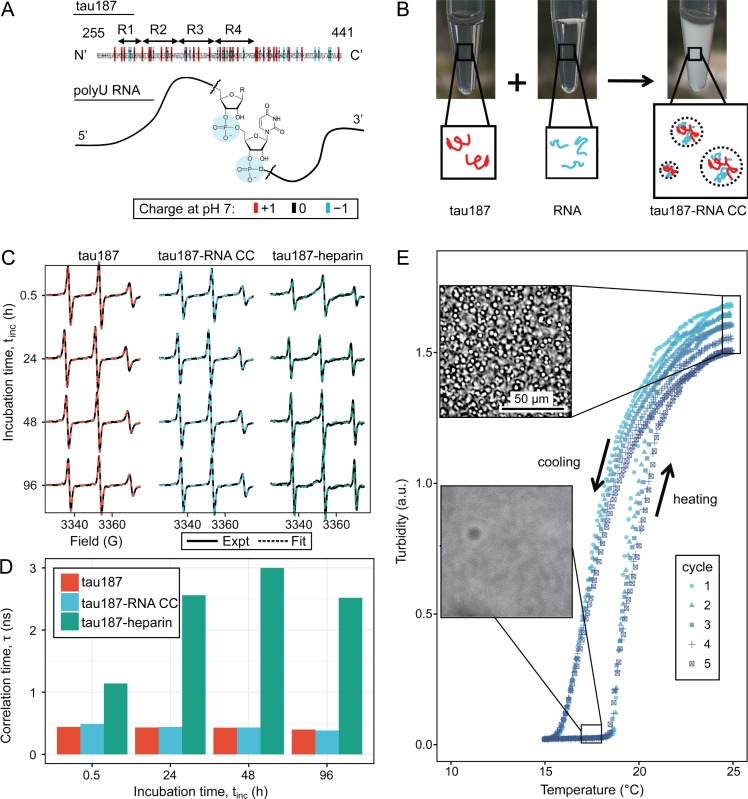
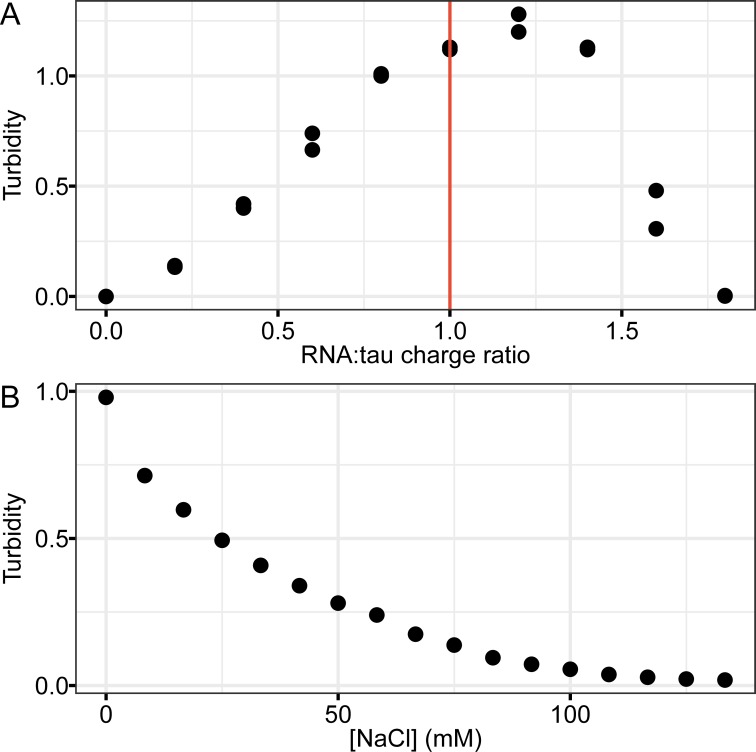
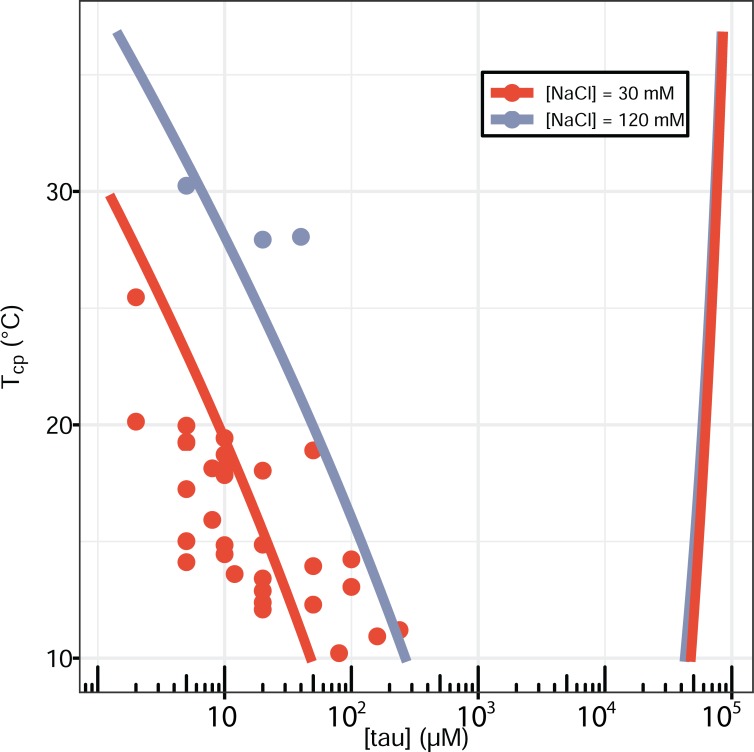
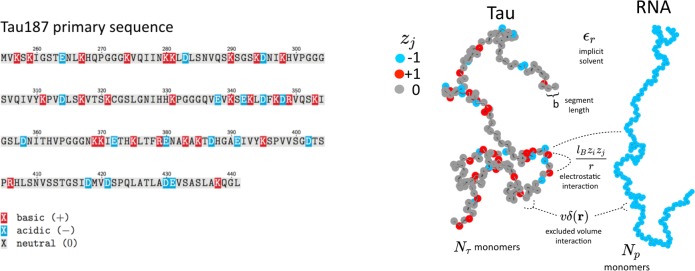
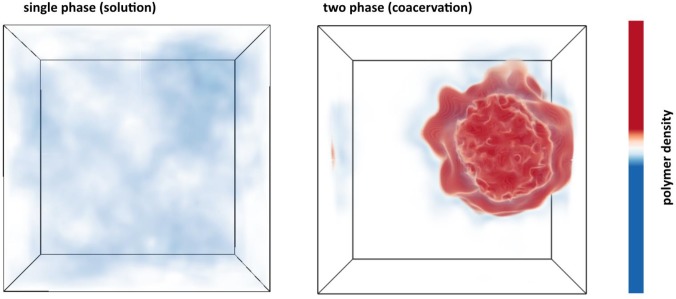
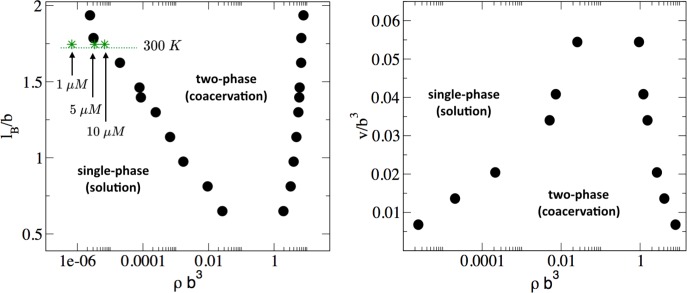
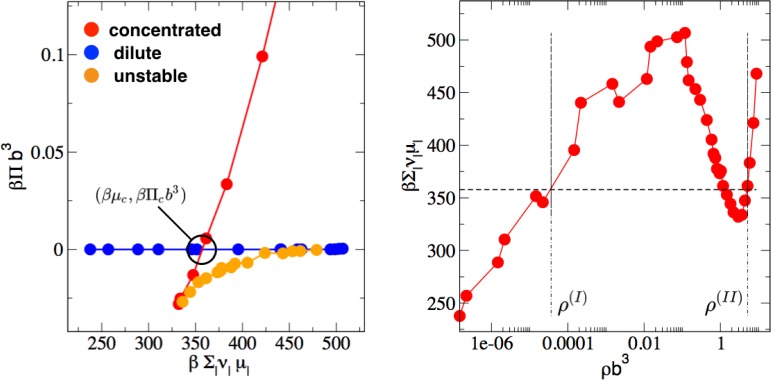
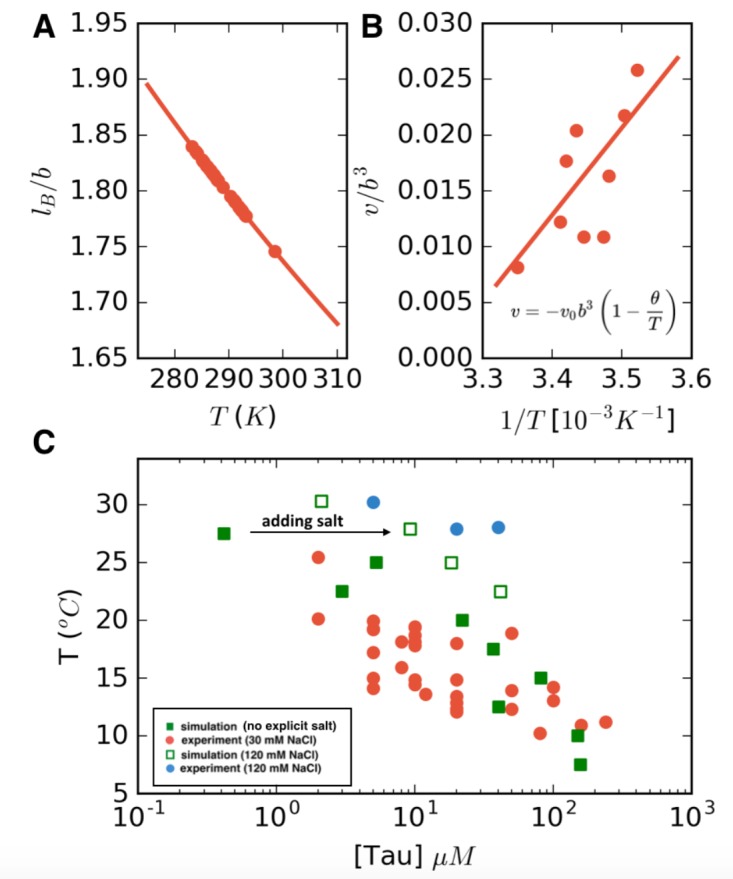
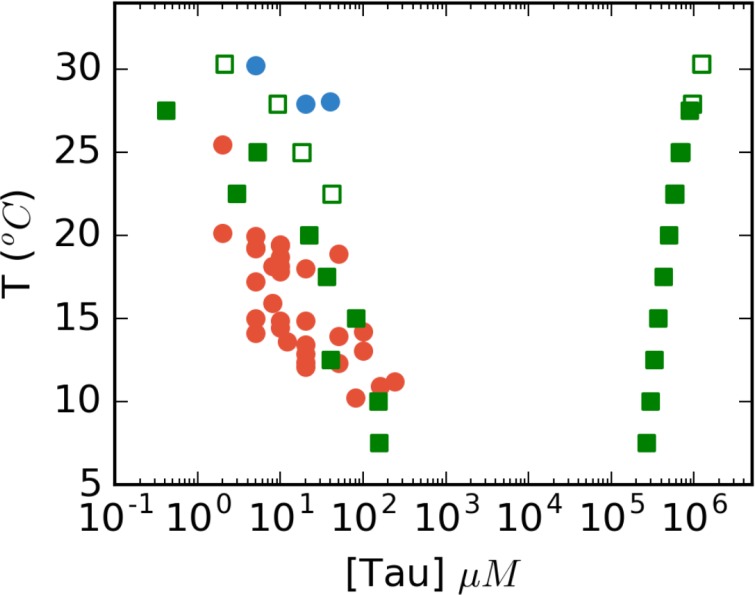
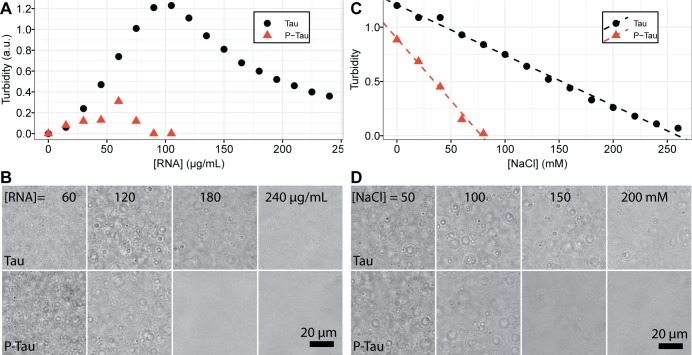
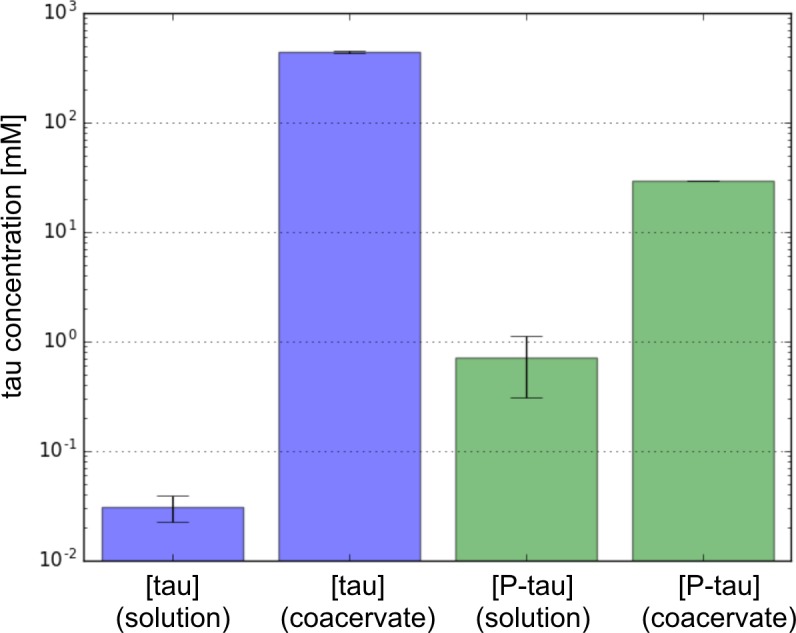
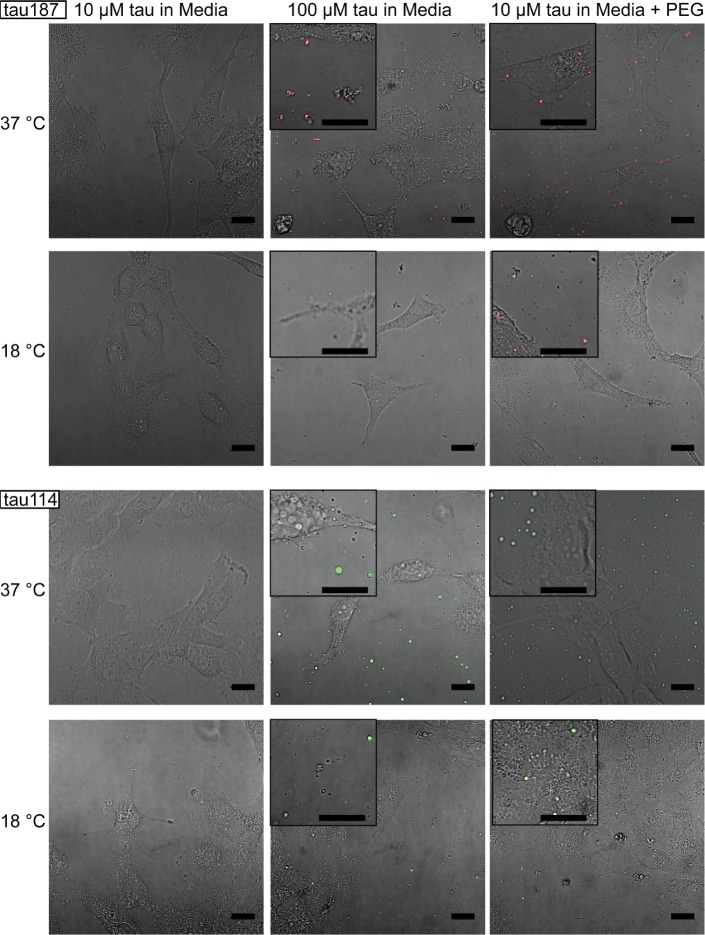
The mechanism that leads to liquid-liquid phase separation (LLPS) of the tau protein, whose pathological aggregation is implicated in neurodegenerative disorders, is not well understood. Establishing a phase diagram that delineates the boundaries of phase co-existence is key to understanding whether LLPS is an equilibrium or intermediate state. We demonstrate that tau and RNA reversibly form complex coacervates. While the equilibrium phase diagram can be fit to an analytical theory, a more advanced model is investigated through field theoretic simulations (FTS) that provided direct insight into the thermodynamic driving forces of tau LLPS. Together, experiment and simulation reveal that tau-RNA LLPS is stable within a narrow equilibrium window near physiological conditions over experimentally tunable parameters including temperature, salt and tau concentrations, and is entropy-driven. Guided by our phase diagram, we show that tau can be driven toward LLPS under live cell coculturing conditions with rationally chosen experimental parameters.
Overview
The claims and statistics of this paper haven’t been checked yet.
Run the check — free, no account needed. It reads the open-access text and checks the sources it cites.
Integrity signals
Registry
Cites
Statistics
Figures
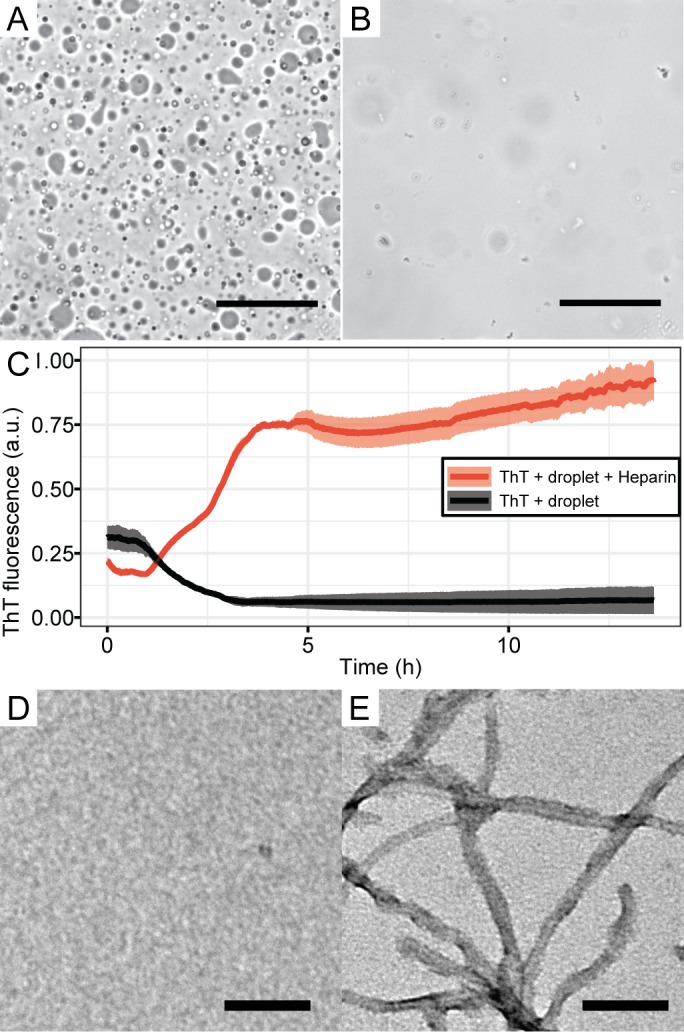
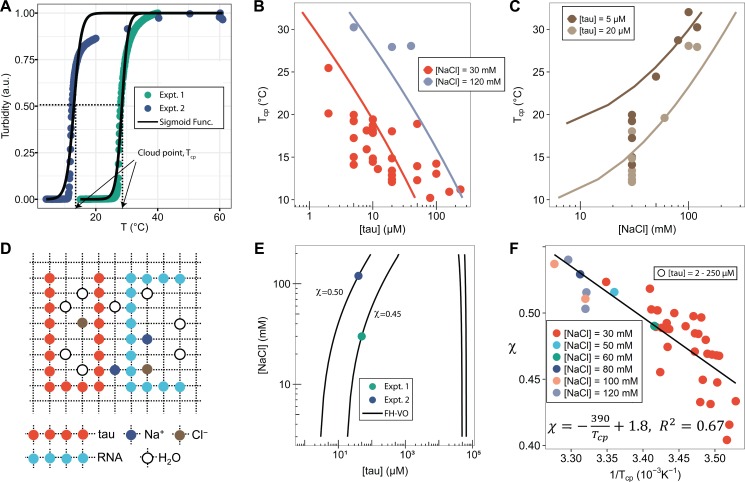
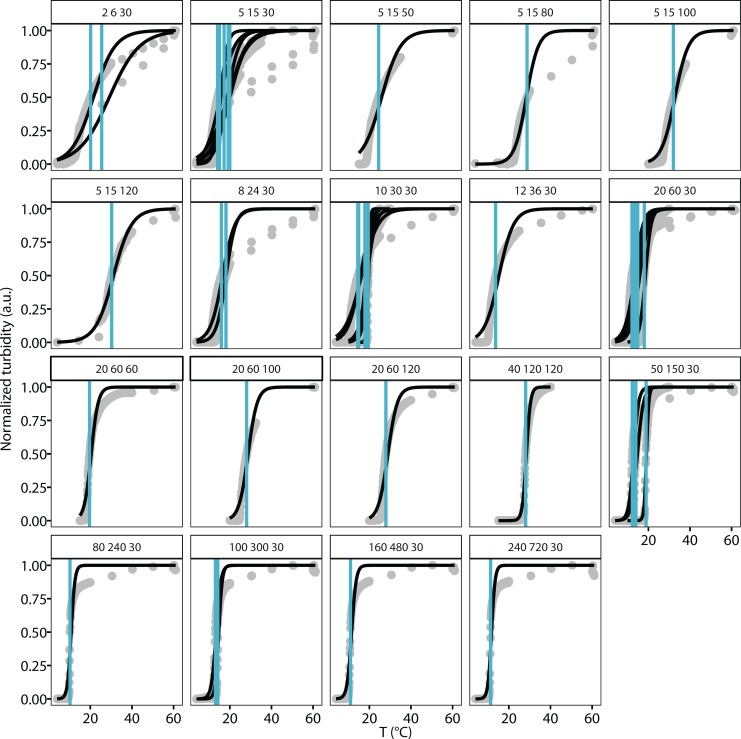
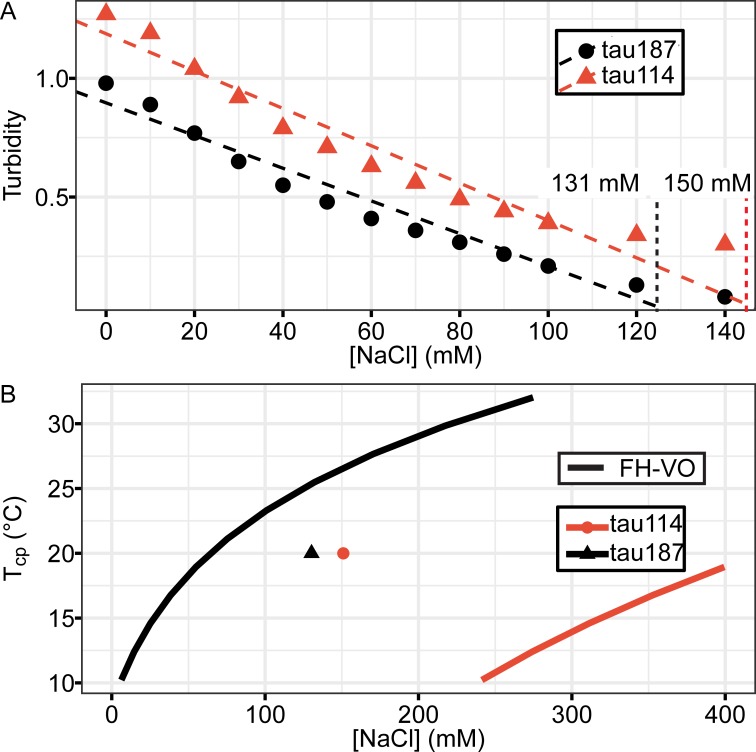
Verification
Claims the paper makes
The claims and statistics of this paper haven’t been checked yet.
Run the check — free, no account needed. It reads the open-access text and checks the sources it cites.
Claims other papers make about this one
Each is checked against this paper’s own text: does it say what the citing paper says it does?
In the citing paper
“Tau:RNA coacervates assemble via electrostatic interactions between positive charges in Tau and negative charges in RNA molecules (Lin et al, 2019) or between oppositely charged Tau domains (Boyko et al, 2019), which infers a sensitivity to the ion concentration in the buffer system.”
From Molecular crowding and RNA synergize to promote phase separation, microtubule interaction, and seeding of Tau condensates (2022) · cites this paper as Lin et al, 2019
In the citing paper
“In the case of Tau, polyanionic RNA (or heparin; Lin et al, 2020) co‐condensate with the positively charged Tau microtubule‐assembly domain into liquid‐like droplets (Zhang et al, 2017; Lin et al, 2019).”
From Molecular crowding and RNA synergize to promote phase separation, microtubule interaction, and seeding of Tau condensates (2022) · cites this paper as Lin et al, 2019
Self-check
Percentages, sums and reported differences re-computed from the paper’s own numbers.
The self-check needs the paper’s full text.
Citations
Cites
Kato, M., Han, T. W., Xie, S., Shi, K., Du, X., Wu, L. C., Mirzaei, H., Goldsmith, E. J., Longgood, J., Pei, J., et al. (2012) · Cell · doi:10.1016/j.cell.2012.04.017 · Cited by 2,012
Anderson, P., & Kedersha, N. (2006) · The Journal of Cell Biology · doi:10.1083/jcb.200512082 · Cited by 984
Ambadipudi, S., Biernat, J., Riedel, D., Mandelkow, E., & Zweckstetter, M. (2017) · Nature Communications · doi:10.1038/s41467-017-00480-0 · Cited by 782
Domains of tau Protein and Interactions with Microtubules
Gustke, N., Trinczek, B., Biernat, J., Mandelkow, E.-M., & Mandelkow, E. (1994) · Biochemistry · doi:10.1021/bi00198a017 · Cited by 655
Ordered Nanoporous Polymers from Polystyrene−Polylactide Block Copolymers
Zalusky, A. S., Olayo-Valles, R., Wolf, J. H., & Hillmyer, M. A. (2002) · Journal of the American Chemical Society · doi:10.1021/ja0278584 · Cited by 553
Local Nucleation of Microtubule Bundles through Tubulin Concentration into a Condensed Tau Phase
Hernández-Vega, A., Braun, M., Scharrel, L., Jahnel, M., Wegmann, S., Hyman, B. T., Alberti, S., Diez, S., & Hyman, A. A. (2017) · Cell Reports · doi:10.1016/j.celrep.2017.08.042 · Cited by 395
Relationship of sequence and phase separation in protein low-complexity regions
Martin, E. W., & Mittag, T. (2018) · Biochemistry · doi:10.1021/acs.biochem.8b00008 · Cited by 389
Acetylation Disfavors Tau Phase Separation
Ferreon, J. C., Jain, A., Choi, K.-J., Tsoi, P. S., MacKenzie, K. R., Jung, S. Y., & Ferreon, A. C. (2018) · International Journal of Molecular Sciences · doi:10.3390/ijms19051360 · Cited by 183
Research works printed but not linked: 99
- Alexander-Katz, 2005, Field-theoretic simulations of polymer solutions: finite-size and discretization effects, The Journal of Chemical Physics, 122, 10.1063/1.1827211 · DOI
- Arneodo, 1988, Interfacial-Tension behavior of citrus oils against phases formed by complex coacervation of gelatin, ACS Symposium Series, 370, 132, 10.1021/bk-1988-0370.ch015 · DOI
- Banjade, 2015, Conserved Interdomain Linker promotes phase separation of the multivalent adaptor protein nck, PNAS, 112, E6426, 10.1073/pnas.1508778112 · DOI
- Banjade, 2014, Phase transitions of multivalent proteins can promote clustering of membrane receptors, eLife, 3, 10.7554/eLife.04123 · DOI
- Berry, 2015, RNA transcription modulates phase transition-driven nuclear body assembly, PNAS, 112, E5237, 10.1073/pnas.1509317112 · DOI · Paper page
- Bianconi, 2012, Temperature and solvent dependence of the dynamical landscape of tau protein conformations, Journal of Biological Physics, 38, 169, 10.1007/s10867-011-9244-6 · DOI
- Biesheuvel, 2004, Electrostatic free energy of weakly charged macromolecules in solution and intermacromolecular complexes consisting of oppositely charged polymers, Langmuir, 20, 2785, 10.1021/la036204l · DOI
- Biesheuvel, 2004, Cylindrical cell model for the electrostatic free energy of polyelectrolyte complexes, Langmuir, 20, 4764, 10.1021/la0496789 · DOI
- Boeynaems, 2017, Phase separation of C9orf72 dipeptide repeats perturbs stress granule dynamics, Molecular Cell, 65, 1044, 10.1016/j.molcel.2017.02.013 · DOI
- Borue, 1988, A statistical theory of weakly charged polyelectrolytes: fluctuations, equation of state and microphase separation, Macromolecules, 21, 3240, 10.1021/ma00189a019 · DOI
- Borue, 1990, A statistical theory of globular polyelectrolyte complexes, Macromolecules, 23, 3625, 10.1021/ma00217a015 · DOI
- Brady, 2017, Structural and hydrodynamic properties of an intrinsically disordered region of a germ cell-specific protein on phase separation, PNAS, 114, E8194, 10.1073/pnas.1706197114 · DOI · Paper page
- Brangwynne, 2009, Germline P granules are liquid droplets that localize by controlled dissolution/condensation, Science, 324, 1729, 10.1126/science.1172046 · DOI
- Brangwynne, 2015, Polymer physics of intracellular phase transitions, Nature Physics, 11, 899, 10.1038/nphys3532 · DOI
- Bungenberg de Jong, 1949, Crystallisation–coacervation–flocculation, Colloid Sci, 2, 232
- Burke, 2015, Vitro FUS granules that bind the C-Terminal domain of RNA polymerase II, Molecular Cell, 60, 231, 10.1016/j.molcel.2015.09.006 · DOI · Paper page
- Castelnovo, 2000, Formation of polyelectrolyte multilayers, Langmuir, 16, 7524, 10.1021/la000211h · DOI
- Castelnovo, 2001, Complexation between oppositely charged polyelectrolytes: beyond the random phase approximation, The European Physical Journal, 6, 377, 10.1007/s10189-001-8051-7 · DOI
- Chang, 2017, Sequence and entropy-based control of complex coacervates, Nature Communications, 8, 10.1038/s41467-017-01249-1 · DOI
- Choi, 2015, Entropic mechanism for the lower critical solution temperature of poly(ethylene oxide) in a room temperature ionic liquid, ACS Macro Letters, 4, 799, 10.1021/acsmacrolett.5b00355 · DOI
- Chollakup, 2010, Phase behavior and coacervation of aqueous poly(acrylic acid)−poly(allylamine) Solutions, Macromolecules, 43, 2518, 10.1021/ma902144k · DOI
- Das, 2018, A lattice model of Charge-Pattern-Dependent polyampholyte phase separation, The Journal of Physical Chemistry B, 122, 5418, 10.1021/acs.jpcb.7b11723 · DOI
- de la Cruz, 1995, Precipitation of highly charged polyelectrolyte solutions in the presence of multivalent salts, The Journal of Chemical Physics, 103, 5781, 10.1063/1.470459 · DOI
- Delaney, 2016, Recent developments in fully fluctuating Field-Theoretic simulations of polymer melts and solutions, The Journal of Physical Chemistry B, 120, 7615, 10.1021/acs.jpcb.6b05704 · DOI
- Delaney, 2017, Theory of polyelectrolyte complexation-Complex coacervates are self-coacervates, The Journal of Chemical Physics, 146, 10.1063/1.4985568 · DOI
- Despres, 2017, Identification of the tau phosphorylation pattern that drives its aggregation, PNAS, 114, 9080, 10.1073/pnas.1708448114 · DOI
- Dias, 2014, Pressure-Dependent properties of elementary hydrophobic interactions: ramifications for activation properties of protein folding, The Journal of Physical Chemistry B, 118, 7488, 10.1021/jp501935f · DOI
- Dill, 1989, Thermal stabilities of globular proteins, Biochemistry, 28, 5439, 10.1021/bi00439a019 · DOI
- Dobrynin, 2001, Counterion condensation and phase separation in solutions of hydrophobic polyelectrolytes, Macromolecules, 34, 1964, 10.1021/ma001619o · DOI
- Doi, 1988, The Theory of Polymer Dynamics
- Düchs, 2014, A multi-species exchange model for fully fluctuating Polymer field theory simulations, The Journal of Chemical Physics, 141, 10.1063/1.4900574 · DOI
- Elbaum-Garfinkle, 2015, The disordered P granule protein LAF-1 drives phase separation into droplets with tunable viscosity and dynamics, PNAS, 112, 7189, 10.1073/pnas.1504822112 · DOI · Paper page
- Eschmann, 2017, Signature of an aggregation-prone conformation of tau, Scientific Reports, 7, 10.1038/srep44739 · DOI
- Feil, 1993, Effect of comonomer hydrophilicity and ionization on the lower critical solution temperature of N-isopropylacrylamide copolymers, Macromolecules, 26, 2496, 10.1021/ma00062a016 · DOI
- Finka, 2013, Proteomic data from human cell cultures refine mechanisms of chaperone-mediated protein homeostasis, Cell Stress and Chaperones, 18, 591, 10.1007/s12192-013-0413-3 · DOI · Paper page
- Flory, 1969, Statistical mechanics of chain molecules, Biopolymers, 8, 699, 10.1002/bip.1969.360080514 · DOI
- Fredrickson, 2006, The Equilibrium Theory of Inhomogeneous Polymers
- Fu, 2016, Driving forces for oppositely charged polyion association in aqueous solutions: enthalpic, entropic, but not electrostatic, Journal of the American Chemical Society, 138, 980, 10.1021/jacs.5b11878 · DOI
- Gennes, 1979, Scaling Concepts in Polymer Physics
- Gummel, 2007, Counterions release from electrostatic complexes of polyelectrolytes and proteins of opposite charge: a direct measurement, Journal of the American Chemical Society, 129, 5806, 10.1021/ja070414t · DOI
- Holehouse, 2015, Quantitative assessments of the distinct contributions of polypeptide backbone amides versus side chain groups to chain expansion via chemical denaturation, Journal of the American Chemical Society, 137, 2984, 10.1021/ja512062h · DOI
- Hone, 2000, A Small-Angle neutron scattering study of the structure of gelatin/Polyelectrolyte complexes, Macromolecules, 33, 1206, 10.1021/ma9911750 · DOI
- Hückel, 1923, The theory of electrolytes: I. lowering of freezing point and related phenomena, Phys Z, 24, 185
- Hyman, 2014, Liquid-liquid phase separation in biology, Annual Review of Cell and Developmental Biology, 30, 39, 10.1146/annurev-cellbio-100913-013325 · DOI · Paper page
- Jeon, 2016, Effects of molecular crowding and confinement on the spatial organization of a biopolymer, Soft Matter, 12, 9436, 10.1039/C6SM01184E · DOI
- Kim, 2016, Complexation and coacervation of like-charged polyelectrolytes inspired by mussels, PNAS, 113, E847, 10.1073/pnas.1521521113 · DOI
- Klauder, 1983, A Langevin approach to fermion and quantum spin correlation functions, Journal of Physics A: Mathematical and General, 16, L317, 10.1088/0305-4470/16/10/001 · DOI
- Kudlay, 2004, Complexation of oppositely charged polyelectrolytes: Effect of Ion Pair Formation, Macromolecules, 37, 9231, 10.1021/ma048519t · DOI
- Kudlay, 2004, Precipitation of oppositely charged polyelectrolytes in salt solutions, The Journal of Chemical Physics, 120, 404, 10.1063/1.1629271 · DOI
- Kwon, 2014, Poly-dipeptides encoded by the C9orf72 repeats bind nucleoli, impede RNA biogenesis, and kill cells, Science, 345, 1139, 10.1126/science.1254917 · DOI
- Kwon, 2015, Theoretical analysis of multiple phase coexistence in polyelectrolyte blends, Macromolecules, 48, 6008, 10.1021/acs.macromol.5b00901 · DOI
- Lacombe, 1976, Statistical thermodynamics of fluid mixtures, The Journal of Physical Chemistry, 80, 2568, 10.1021/j100564a009 · DOI
- Lee, 2008, Complex coacervation: a field theoretic simulation study of polyelectrolyte complexation, The Journal of Chemical Physics, 128, 10.1063/1.2936834 · DOI
- Lee, 2016, C9orf72 dipeptide repeats impair the assembly, dynamics, and function of Membrane-Less organelles, Cell, 167, 774, 10.1016/j.cell.2016.10.002 · DOI
- Li, 2013, Stress granules as crucibles of ALS pathogenesis, The Journal of Cell Biology, 201, 361, 10.1083/jcb.201302044 · DOI
- Li, 2018, Phase behavior and salt partitioning in polyelectrolyte complex coacervates, Macromolecules, 51, 2988, 10.1021/acs.macromol.8b00238 · DOI
- Li, 2018, TAR DNA-binding protein 43 (TDP-43) liquid-liquid phase separation is mediated by just a few aromatic residues, The Journal of Biological Chemistry, 293, 10.1074/jbc.AC117.001037 · DOI
- Lin, 2016, Sequence-Specific polyampholyte phase separation in membraneless organelles, Physical Review Letters, 117, 10.1103/PhysRevLett.117.178101 · DOI
- Lin, 2017, Random-phase-approximation theory for sequence-dependent, biologically functional liquid-liquid phase separation of intrinsically disordered proteins, Journal of Molecular Liquids, 228, 176, 10.1016/j.molliq.2016.09.090 · DOI
- Lin, 2018, Theories for Sequence-Dependent phase behaviors of biomolecular condensates, Biochemistry, 57, 2499, 10.1021/acs.biochem.8b00058 · DOI
- Lytle, 2017, Transfer matrix theory of polymer complex coacervation, Soft Matter, 13, 7001, 10.1039/C7SM01080J · DOI
- Mair, 2016, FLEXITau: quantifying Post-translational modifications of tau protein in Vitro and in Human Disease, Analytical Chemistry, 88, 3704, 10.1021/acs.analchem.5b04509 · DOI
- Makhatadze, 1993, Contribution of hydration to protein folding thermodynamics. I. the enthalpy of hydration, Journal of Molecular Biology, 232, 639, 10.1006/jmbi.1993.1416 · DOI
- Matubayasi, 2017, Free-energy analysis of protein solvation with all-atom molecular dynamics simulation combined with a theory of solutions, Current Opinion in Structural Biology, 43, 45, 10.1016/j.sbi.2016.10.005 · DOI
- Molliex, 2015, Phase separation by low complexity domains promotes stress granule assembly and drives pathological fibrillization, Cell, 163, 123, 10.1016/j.cell.2015.09.015 · DOI · Paper page
- Murakami, 2015, ALS/FTD Mutation-Induced phase transition of FUS liquid droplets and reversible hydrogels into irreversible hydrogels impairs RNP granule function, Neuron, 88, 678, 10.1016/j.neuron.2015.10.030 · DOI · Paper page
- Muthukumar, 2004, Theory of counter-ion condensation on flexible polyelectrolytes: adsorption mechanism, The Journal of Chemical Physics, 120, 9343, 10.1063/1.1701839 · DOI
- Nakajima, 1972, Phase relationships of an equivalent mixture of sulfated polyvinyl alcohol and aminoacetalyzed polyvinyl alcohol in microsalt aqueous solution, Biopolymers, 11, 1345, 10.1002/bip.1972.360110704 · DOI
- Nott, 2015, Phase transition of a disordered nuage protein generates environmentally responsive membraneless organelles, Molecular Cell, 57, 936, 10.1016/j.molcel.2015.01.013 · DOI · Paper page
- Overbeek, 1957, Phase separation in polyelectrolyte solutions. Theory of complex coacervation, Journal of Cellular and Comparative Physiology, 49, 7, 10.1002/jcp.1030490404 · DOI
- Parisi, 1983, On complex probabilities, Physics Letters B, 131, 393, 10.1016/0370-2693(83)90525-7 · DOI
- Patel, 2015, A Liquid-to-Solid phase transition of the ALS protein FUS accelerated by disease mutation, Cell, 162, 1066, 10.1016/j.cell.2015.07.047 · DOI · Paper page
- Pavlova, 2009, Site-specific dynamic nuclear polarization of hydration water as a generally applicable approach to monitor protein aggregation, Physical Chemistry Chemical Physics, 11, 6833, 10.1039/b906101k · DOI
- Pavlova, 2016, Protein structural and surface water rearrangement constitute major events in the earliest aggregation stages of tau, PNAS, 113, E127, 10.1073/pnas.1504415113 · DOI
- Peterson, 2008, A soluble oligomer of tau associated with fiber formation analyzed by NMR, Biochemistry, 47, 7393, 10.1021/bi702466a · DOI
- Popov, 2007, Field-theoretic simulations of polyelectrolyte complexation, Journal of Polymer Science Part B: Polymer Physics, 45, 3223, 10.1002/polb.21334 · DOI
- Qin, 2016, Criticality and connectivity in macromolecular charge complexation, Macromolecules, 49, 8789, 10.1021/acs.macromol.6b02113 · DOI
- Rubinstein, 2003, Polymer Physics, 10.1093/oso/9780198520597.001.0001 · DOI · Paper page
- Sanchez, 1978, Statistical thermodynamics of polymer solutions, Macromolecules, 11, 1145, 10.1021/ma60066a017 · DOI
- Shen, 2017, Electrostatic correlations and the polyelectrolyte self energy, The Journal of Chemical Physics, 146, 10.1063/1.4975777 · DOI
- Shen, 2018, Polyelectrolyte chain structure and solution phase behavior, Macromolecules, 51, 1706, 10.1021/acs.macromol.7b02685 · DOI
- Silverstein, 2000, The strength of hydrogen bonds in liquid water and around nonpolar solutes, Journal of the American Chemical Society, 122, 8037, 10.1021/ja000459t · DOI
- Sing, 2017, Development of the modern theory of polymeric complex coacervation, Advances in Colloid and Interface Science, 239, 2, 10.1016/j.cis.2016.04.004 · DOI
- Siow, 1972, Cloud-Point curves in polymer solutions with adjacent upper and lower critical solution temperatures, Macromolecules, 5, 29, 10.1021/ma60025a008 · DOI
- Spruijt, 2010, Binodal compositions of polyelectrolyte complexes, Macromolecules, 43, 6476, 10.1021/ma101031t · DOI
- Stockmayer, 1955, Chain dimensions near the flory temperature, Journal of Polymer Science, 15, 595, 10.1002/pol.1955.120158028 · DOI
- Suzuki, 1982, An estimation of the temperature dependence of the excluded-volume integral, European Polymer Journal, 18, 247, 10.1016/0014-3057(82)90115-X · DOI
- Tainaka, 1979, Study of complex coacervation in low concentration by virial expansion method. I. salt free systems, Journal of the Physical Society of Japan, 46, 1899, 10.1143/JPSJ.46.1899 · DOI
- Tainaka, 1980, Effect of counterions on complex coacervation, Biopolymers, 19, 1289, 10.1002/bip.1980.360190705 · DOI
- Thirumalai, 2012, Role of water in protein aggregation and amyloid polymorphism, Accounts of Chemical Research, 45, 83, 10.1021/ar2000869 · DOI
- Uversky, 2015, Intrinsically disordered proteins as crucial constituents of cellular aqueous two phase systems and coacervates, FEBS Letters, 589, 15, 10.1016/j.febslet.2014.11.028 · DOI
- Veis, 1963, Phase separation in polyelectrolyte systems. iii. effect of aggregation and molecular weight heterogeneity, The Journal of Physical Chemistry, 67, 1960, 10.1021/j100804a004 · DOI
- Veis, 1960, Phase separation in polyelectrolyte systems. I. complex coacervates of gelatin, The Journal of Physical Chemistry, 64, 1203, 10.1021/j100838a022 · DOI
- Villet MC. 2012. Advanced computational field theory methods for fluctuating polymer solutions. ProQuest. https://search.proquest.com/openview/4c8b8e54782d4d6d5964834f0bdc88ec/1?pq-origsite=gscholar&cbl=18750&diss=y [Accessed June 16, 2018].
- Villet, 2014, Efficient field-theoretic simulation of polymer solutions, The Journal of Chemical Physics, 141, 10.1063/1.4902886 · DOI
- Water, 2014, Complex coacervates of hyaluronic acid and lysozyme: effect on protein structure and physical stability, European Journal of Pharmaceutics and Biopharmaceutics, 88, 325, 10.1016/j.ejpb.2014.09.001 · DOI
- Wegmann, 2018, Tau protein liquid-liquid phase separation can initiate tau aggregation, The EMBO Journal, 37, e98049, 10.15252/embj.201798049 · DOI · Paper page
- Wippich, 2013, Dual specificity kinase DYRK3 couples stress granule condensation/dissolution to mTORC1 signaling, Cell, 152, 791, 10.1016/j.cell.2013.01.033 · DOI
- Zhang, 2017, RNA stores tau reversibly in complex coacervates, PLOS Biology, 15, 10.1371/journal.pbio.2002183 · DOI · Paper page
Cited by
Phase separation and neurodegenerative diseases: a disturbance in the force
Zbinden, A., Pérez-Berlanga, M., De Rossi, P., & Polymenidou, M. (2020) · Developmental Cell · doi:10.1016/j.devcel.2020.09.014 · Cited by 500
Liquid-liquid phase separation induces pathogenic tau conformations in vitro
Kanaan, N. M., Hamel, C., Grabinski, T., & Combs, B. (2020) · Nature Communications · doi:10.1038/s41467-020-16580-3 · Cited by 397
Abyzov, A., Blackledge, M., & Zweckstetter, M. (2022) · Chemical Reviews · doi:10.1021/acs.chemrev.1c00774 · Cited by 215
Hochmair, J., Exner, C., Franck, M., Dominguez‐Baquero, A., Diez, L., Brognaro, H., Kraushar, M. L., Mielke, T., Radbruch, H., Kaniyappan, S., et al. (2022) · The EMBO Journal · doi:10.15252/embj.2021108882 · Cited by 106
Liquid-liquid phase separation in Alzheimer’s disease
Fu, Q., Zhang, B., Chen, X., & Chu, L. (2024) · Journal of Molecular Medicine · doi:10.1007/s00109-023-02407-3 · Cited by 33
Metadata
- Authors
- Lin, Y., McCarty, J., Rauch, J. N., Delaney, K. T., Kosik, K. S., Fredrickson, G. H., Shea, J.-E., & Han, S.
- Affiliations
- Biomolecular Science and Engineering, University of California Santa Barbara, Santa Barbara, United States
- Department of Chemistry and Biochemistry, University of California Santa Barbara, Santa Barbara, United States
- Department of Molecular, Cellular and Developmental Biology, University of California Santa Barbara, Santa Barbara, United States
- Materials Research Laboratory, University of California Santa Barbara, Santa Barbara, United States
- Venue
- eLife
- Publisher
- eLife Sciences Publications, Ltd
- Published
- 2019-04-05
- Volume
- 8
- ISSN
- 2050-084X
- PMC
- PMC6450672
- Cited by
- 165
- References
- 8
- Language
- en
- Licence
- Funders
- National Institute on Aging (RO1AG05605)
- National Science Foundation (MRSEC Program, Award No. DMR 1720256, MCB-1716956)
- Santa Barbara Foundation (Tri-Counties Blood Bank Fellowship)
- Rainwater Foundation (Tau Consortium)
About these checks
Registry, retraction, Cites and statistics results are computed, not judged, with one exception: a printed reference that no index lists is read once by a model before it counts as a citation error. Claims are extracted by a model and kept only when their quote appears verbatim in the text; each cited source is then checked, with a model’s help, for whether it says what the claim relies on. Those verdicts can be wrong — read the claim’s quote and the cited source before relying on one.
Statistics and arithmetic are recomputed, not judged.
Confidence bands are shown only for fields calibrated on our annotated test set. None is calibrated yet, so no band is shown.
What counts as a claim ›How we measure confidence ›How we check this ›
Are you an author, or do you see a problem with this page? Request a review
Data sources
Bibliographic data: Semantic Scholar, OpenAlex, Crossref.
Contains information from the Semantic Scholar Academic Graph Datasets, made available under the ODC Attribution License (ODC-BY 1.0).
Semantic Scholar’s data is described in: Kinney, R., et al. (2023). The Semantic Scholar Open Data Platform. arXiv:2301.10140.
