

The DOI matches its Crossref record; 66 of the 66 references it cites were found in a registry or an index.
Multivariable two-sample Mendelian randomization estimates of the effects of intelligence and education on health
Open accessAbstract
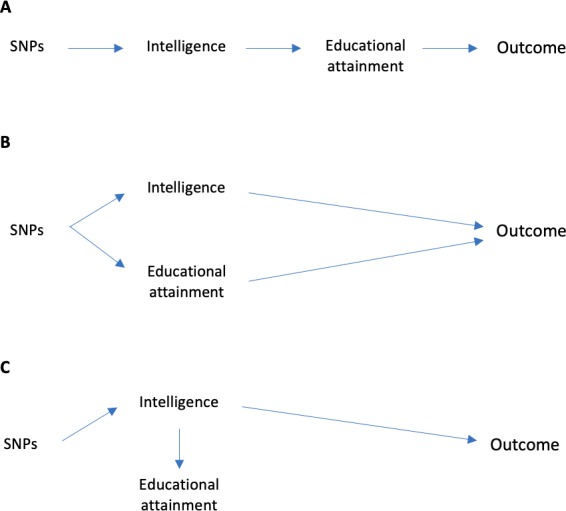
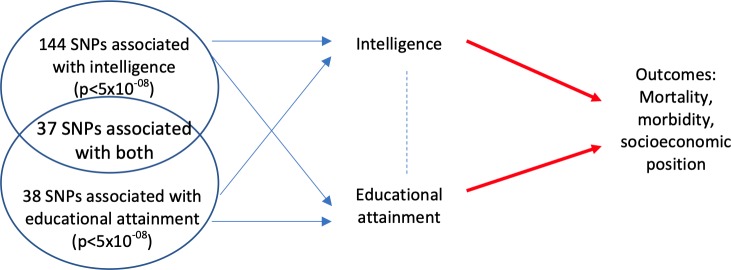
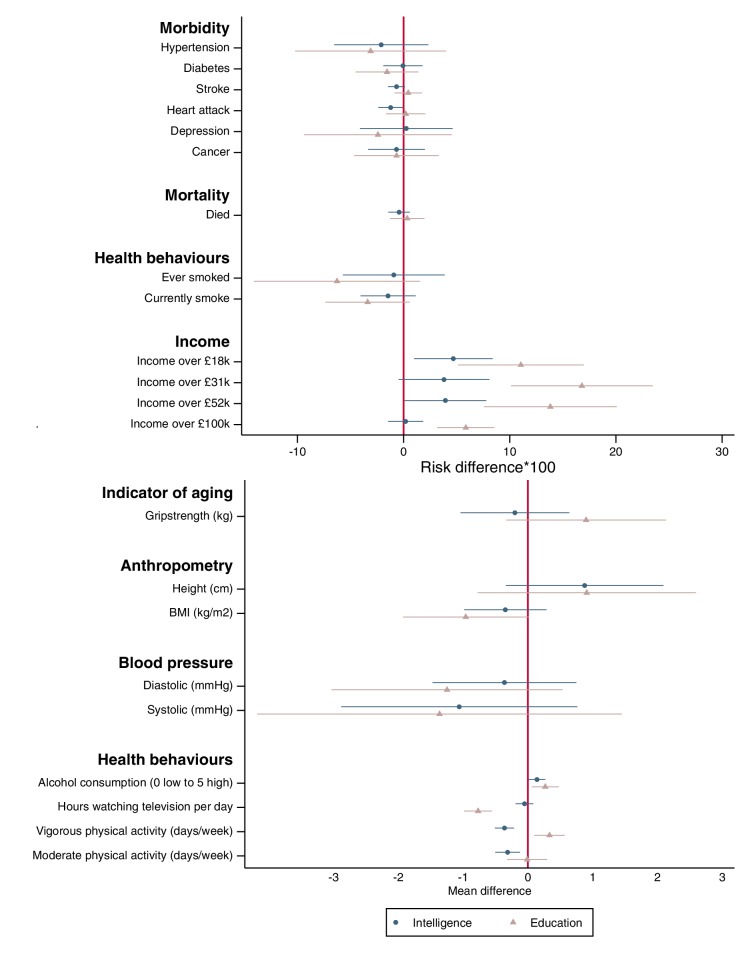
Intelligence and education are predictive of better physical and mental health, socioeconomic position (SEP), and longevity. However, these associations are insufficient to prove that intelligence and/or education cause these outcomes. Intelligence and education are phenotypically and genetically correlated, which makes it difficult to elucidate causal relationships. We used univariate and multivariable Mendelian randomization to estimate the total and direct effects of intelligence and educational attainment on mental and physical health, measures of socioeconomic position, and longevity. Both intelligence and education had beneficial total effects. Higher intelligence had positive direct effects on income and alcohol consumption, and negative direct effects on moderate and vigorous physical activity. Higher educational attainment had positive direct effects on income, alcohol consumption, and vigorous physical activity, and negative direct effects on smoking, BMI and sedentary behaviour. If the Mendelian randomization assumptions hold, these findings suggest that both intelligence and education affect health.
Overview
The claims and statistics of this paper haven’t been checked yet.
Run the check — free, no account needed. It reads the open-access text and checks the sources it cites.
Integrity signals
Registry
Cites
Statistics
Figures
Verification
Claims the paper makes
The claims and statistics of this paper haven’t been checked yet.
Run the check — free, no account needed. It reads the open-access text and checks the sources it cites.
Claims other papers make about this one
Each is checked against this paper’s own text: does it say what the citing paper says it does?
The source backs part of the claim, not all of it — or backs it for a different population, condition or comparison.
In the citing paper
“Triangulation of evidence from multiple methodologies — using different methodologies that are subject to different sources and directions of potential bias — can help to identify bias in MR studies.6,7,155 Alignment of results across these different methodologies can improve confidence in an initial causal interpretation.”
From Mendelian randomization (2022) · cites this paper as [155]
Experimental — accuracy not yet measured
Self-check
Percentages, sums and reported differences re-computed from the paper’s own numbers.
The self-check needs the paper’s full text.
Citations
Cites
Specification Tests in Econometrics
Hausman, J. A. (1978) · Econometrica · doi:10.2307/1913827 · Cited by 18,820
Bowden, J., Davey Smith, G., Haycock, P. C., & Burgess, S. (2016) · Genetic Epidemiology · doi:10.1002/gepi.21965 · Cited by 8,922
The MR-Base platform supports systematic causal inference across the human phenome
Hemani, G., Zheng, J., Elsworth, B., Wade, K. H., Haberland, V., Baird, D., Laurin, C., Burgess, S., Bowden, J., Langdon, R., et al. (2018) · eLife · doi:10.7554/elife.34408 · Cited by 7,959
Davey Smith, G., & Ebrahim, S. (2003) · International Journal of Epidemiology · doi:10.1093/ije/dyg070 · Cited by 5,882
Mendelian randomization: genetic anchors for causal inference in epidemiological studies
Davey Smith, G., & Hemani, G. (2014) · Human Molecular Genetics · doi:10.1093/hmg/ddu328 · Cited by 4,677
Reading Mendelian randomisation studies: a guide, glossary, and checklist for clinicians
Davies, N. M., Holmes, M. V., & Davey Smith, G. (2018) · BMJ · doi:10.1136/bmj.k601 · Cited by 4,404
Self-citationFry, A., Littlejohns, T. J., Sudlow, C., Doherty, N., Adamska, L., Sprosen, T., Collins, R., & Allen, N. E. (2017) · American Journal of Epidemiology · doi:10.1093/aje/kwx246 · Cited by 3,979
Robust inference in summary data Mendelian randomization via the zero modal pleiotropy assumption
Hartwig, F. P., Davey Smith, G., & Bowden, J. (2017) · International Journal of Epidemiology · doi:10.1093/ije/dyx102 · Cited by 3,485
The Estimation of Economic Relationships using Instrumental Variables
Sargan, J. D. (1958) · Econometrica · doi:10.2307/1907619 · Cited by 3,377
23andMe Research Team, Lee, J. J., COGENT (Cognitive Genomics Consortium), Social Science Genetic Association Consortium, Wedow, R., Okbay, A., Kong, E., Maghzian, O., Zacher, M., Nguyen-Viet, T. A., et al. (2018) · Nature Genetics · doi:10.1038/s41588-018-0147-3 · Cited by 2,470
Cited by
Sorted by citations
Sanderson, E., Glymour, M. M., Holmes, M. V., Kang, H., Morrison, J., Munafò, M. R., Palmer, T., Schooling, C. M., Wallace, C., Zhao, Q., et al. (2022) · Nature Reviews Methods Primers · doi:10.1038/s43586-021-00092-5 · Cited by 2,229
Self-citationSanderson, E. C. M., Spiller, W., & Bowden, J. (2021) · Statistics in Medicine · doi:10.1002/sim.9133 · Cited by 603
Self-citationBias correction for inverse variance weighting Mendelian randomization
Mounier, N., & Kutalik, Z. (2023) · Genetic Epidemiology · doi:10.1002/gepi.22522 · Cited by 465
Rosoff, D. B., Smith, G. D., Mehta, N. N., Clarke, T., & Lohoff, F. W. (2020) · PLoS Medicine · doi:10.1371/journal.pmed.1003410 · Cited by 213
Pleiotropy robust methods for multivariable Mendelian randomization
Grant, A. J., & Burgess, S. (2021) · Statistics in Medicine · doi:10.1002/sim.9156 · Cited by 194
van de Vegte, Y. J., Said, M. A., Rienstra, M., van der Harst, P., & Verweij, N. (2020) · Nature Communications · doi:10.1038/s41467-020-15553-w · Cited by 145
Intelligence, health and death
Deary, I. J., Hill, W. D., & Galé, C. R. (2021) · Nature Human Behaviour · doi:10.1038/s41562-021-01078-9 · Cited by 111
Self-citationEducation leads to a more physically active lifestyle: Evidence based on Mendelian randomization
Kari, J. T., Viinikainen, J., Böckerman, P., Tammelin, T., Pitkänen, N., Lehtimäki, T. J., Pahkala, K., Hirvensalo, M. H., Raitakari, O. T., & Pehkonen, J. (2020) · Scandinavian Journal of Medicine and Science in Sports · doi:10.1111/sms.13653 · Cited by 120
Treur, J. L., Munafo, M. R., Logtenberg, E., Wiers, R. W. H. J., & Verweij, K. J. H. (2021) · Psychological Medicine · doi:10.1017/s003329172100180x · Cited by 101
Two‐Sample Multivariable Mendelian Randomization Analysis Using R
Rasooly, D., & Peloso, G. M. (2021) · Current Protocols · doi:10.1002/cpz1.335 · Cited by 81
Wang, Y., Ye, C., Kong, L., Zheng, J., Xu, M., Xu, Y., Li, M., Zhao, Z., Lu, J., Chen, Y., et al. (2022) · Hypertension · doi:10.1161/hypertensionaha.122.20286 · Cited by 85
Does better education mitigate risky health behavior? A mendelian randomization study
Viinikainen, J., Bryson, A., Böckerman, P., Kari, J. T., Lehtimäki, T. J., Raitakari, O. T., Viikari, J. S. A., & Pehkonen, J. (2022) · Economics & Human Biology · doi:10.1016/j.ehb.2022.101134 · Cited by 82
Genetically predicted education attainment in relation to somatic and mental health
Yuan, S., Xiong, Y., Michaëlsson, M., Michaëlsson, K., & Larsson, S. C. (2021) · Scientific Reports · doi:10.1038/s41598-021-83801-0 · Cited by 69
Rosoff, D. B., Kaminsky, Z. A., McIntosh, A. M., Smith, G. D., & Lohoff, F. W. (2020) · Translational Psychiatry · doi:10.1038/s41398-020-01047-2 · Cited by 62
Tanveer, M., Hohmann, A., Roy, N., Zeba, A., Tanveer, U., & Siener, M. (2022) · International Journal of Environmental Research and Public Health · doi:10.3390/ijerph191811619 · Cited by 52
Hu, Y., Zhang, Y., Zhang, H., Gao, S., Wang, L., Wang, T., Han, Z., Sun, B., & Liu, G. (2022) · Molecular Psychiatry · doi:10.1038/s41380-022-01695-4 · Cited by 48
Robust multivariable Mendelian randomization based on constrained maximum likelihood
Lin, Z., Xue, H., & Pan, W. (2023) · The American Journal of Human Genetics · doi:10.1016/j.ajhg.2023.02.014 · Cited by 52
Integration of genomics and transcriptomics predicts diabetic retinopathy susceptibility genes
Skol, A. D., Jung, S. C., Sokovic, A. M., Chen, S., Fazal, S., Sosina, O. A., Borkar, P. P., Lin, A., Sverdlov, M. S., Cao, D., et al. (2020) · eLife · doi:10.7554/elife.59980 · Cited by 50
Howe, L. J., Tudball, M., Davey Smith, G., & Davies, N. M. (2022) · International Journal of Epidemiology · doi:10.1093/ije/dyab208 · Cited by 48
Self-citationIs genetic liability to ADHD and ASD causally linked to educational attainment?
Dardani, C., Riglin, L., Leppert, B., Sanderson, E. C. M., Rai, D., Howe, L. D., Smith, G. D., Tilling, K. M., Thapar, A., Davies, N. M., et al. (2021) · International Journal of Epidemiology · doi:10.1093/ije/dyab107 · Cited by 46
Self-citationCausal inference on neuroimaging data with Mendelian randomisation
Taschler, B., Smith, S. M., & Nichols, T. E. (2022) · NeuroImage · doi:10.1016/j.neuroimage.2022.119385 · Cited by 47
Socioeconomic inequalities in cardiovascular disease: a causal perspective
Bann, D., Wright, L., Hughes, A. D., & Chaturvedi, N. (2023) · Nature Reviews Cardiology · doi:10.1038/s41569-023-00941-8 · Cited by 46
Grant, A. J., & Burgess, S. (2024) · The American Journal of Human Genetics · doi:10.1016/j.ajhg.2023.12.002 · Cited by 44
Marchi, M., Alkema, A., Xia, C., Thio, C. H. L., Chen, L.-Y., Schalkwijk, W., Galeazzi, G. M., Ferrari, S., Pingani, L., Kweon, H., et al. (2024) · Nature Human Behaviour · doi:10.1038/s41562-024-01919-3 · Cited by 47
Self-citationSlaney, C., Sallis, H., Jones, H. J., Dardani, C., CHARGE Inflammation Working Group, Tilling, K. M., Munafo, M. R., Smith, G. D., Mahedy, L., & Khandaker, G. M. (2023) · Brain Behavior and Immunity · doi:10.1016/j.bbi.2023.02.010 · Cited by 39
Howe, L. J., Rasheed, H., Jones, P. R., Boomsma, D. I., Evans, D. M., Giannelis, A., Hayward, C., Hopper, J. L., Hughes, A., Lahtinen, H., et al. (2023) · International Journal of Epidemiology · doi:10.1093/ije/dyad079 · Cited by 37
Self-citationMalanchini, M., Rimfeld, K., Gidziela, A., Cheesman, R., Allegrini, A. G., Shakeshaft, N. G., Schofield, K. L., Packer, A. E., Ogden, R., McMillan, A. J., et al. (2021) · Molecular Psychiatry · doi:10.1038/s41380-021-01300-0 · Cited by 38
Luo, G., Yao, Y., Tao, J., Wang, T., & Yan, M. (2022) · Frontiers in Neuroscience · doi:10.3389/fnins.2022.1074605 · Cited by 38
Kim, M. S., Song, M., Kim, S., Kim, B., Kang, W., Kim, J. Y., Myung, W., Lee, I., Do, R., Khera, A. V., et al. (2023) · Obesity · doi:10.1002/oby.23722 · Cited by 33
Polygenic and socioeconomic risk for high body mass index: 69 years of follow-up across life
Bann, D., Wright, L., Hardy, R., Williams, D. M., & Davies, N. M. (2022) · PLoS Genetics · doi:10.1371/journal.pgen.1010233 · Cited by 32
Self-citationEVALUATING THE CAUSAL RELATIONSHIP BETWEEN EDUCATIONAL ATTAINMENT AND MENTAL HEALTH
Demange, P., Boomsma, D. I., van Bergen, E., & Nivard, M. G. (2023) · European Neuropsychopharmacology · doi:10.1016/j.euroneuro.2023.08.044 · Cited by 28
Shi, X., Yuan, W., Cao, Q., & Cui, W. (2022) · Addiction · doi:10.1111/add.16019 · Cited by 27
Adams, C. D. (2020) · Scientific Reports · doi:10.1038/s41598-020-63104-6 · Cited by 20
Norris, T., Salzmann, A., Henry, A., Garfield, V., & Pereira, S. M. P. (2023) · International Journal of Epidemiology · doi:10.1093/ije/dyad043 · Cited by 21
Wang, M., Jian, Z., Gao, X., Chi, Y., Jin, X., Li, H., & Wang, K. (2021) · Frontiers in Public Health · doi:10.3389/fpubh.2021.742952 · Cited by 20
Education Attainment, Intelligence and COVID-19: A Mendelian Randomization Study
Li, G. H., Lam, S. K. K., Wong, I. C. K., Chu, J. K.-P., & Cheung, C. (2021) · Journal of Clinical Medicine · doi:10.3390/jcm10214870 · Cited by 21
Kleineidam, L., Stark, M., Riedel-Heller, S. G., Pabst, A., Schmiedek, F., Streit, F., Rietschel, M., Klinger-König, J., Grabe, H. J., Erhardt, A., et al. (2022) · The World Journal of Biological Psychiatry · doi:10.1080/15622975.2021.2011408 · Cited by 19
Wang, Y., Kong, L., Ye, C., Dou, C., Zheng, J., Xu, M., Xu, Y., Li, M., Zhao, Z., Lu, J., et al. (2023) · Liver International · doi:10.1111/liv.15669 · Cited by 18
Adams, C. D., & Boutwell, B. B. (2020) · Scientific Reports · doi:10.1038/s41598-020-69114-8 · Cited by 18
Yang, Y., Bartz, T. M., Brown, M. R., Guo, X., Zilhão, N. R., Trompet, S., Weiss, S., Yao, J., Brody, J. A., Defilippi, C. R., et al. (2021) · Circulation: Genomic and Precision Medicine · doi:10.1161/circgen.121.003460 · Cited by 16
The quality of life in nasopharyngeal carcinoma radiotherapy: A longitudinal study
Kan, Y., Yang, S., Wu, X., Wang, S., Li, X., Zhang, F., Wang, P., & Zhao, J. (2023) · Asia-Pacific Journal of Oncology Nursing · doi:10.1016/j.apjon.2023.100251 · Cited by 15
Sun, K., Ming, Y., Wu, Y., Zeng, Y., Xu, J., Wu, L., Li, M., & Shen, B. (2023) · Orthopaedic Surgery · doi:10.1111/os.13821 · Cited by 16
Liao, L., Zhuang, X., Zhang, S., Liao, X.-X., & Li, W. (2020) · International Journal of Cardiology · doi:10.1016/j.ijcard.2020.09.068 · Cited by 13
Winpenny, E. M., Howe, L. D., van Sluijs, E. M. F., Hardy, R., & Tilling, K. M. (2021) · Journal of Epidemiology & Community Health · doi:10.1136/jech-2021-216611 · Cited by 15
Tang, L., Li, C., Chen, W., Zeng, Y., Yang, H., Hu, Y., Song, H., Zeng, X., Li, Q., & Fu, P. (2022) · Cancer Epidemiology Biomarkers & Prevention · doi:10.1158/1055-9965.epi-21-1318 · Cited by 15
COVID-19 and cognitive performance: a Mendelian randomization study
Tang, C.-M., Li, G. H., & Cheung, C. (2023) · Frontiers in Public Health · doi:10.3389/fpubh.2023.1185957 · Cited by 13
Association between gut microbiota and spinal stenosis: a two-sample mendelian randomization study
Li, J., Wei, J., Wang, J., Xu, T., Wu, B., Yang, S., Jing, S., Wu, H. K., & Hao, H. (2024) · Frontiers in Immunology · doi:10.3389/fimmu.2024.1360132 · Cited by 16
Demange, P., Boomsma, D. I., van Bergen, E., & Nivard, M. G. (2024) · Nature Mental Health · doi:10.1038/s44220-024-00245-x · Cited by 13
Smoking, alcohol consumption and risk of Dupuytren’s disease: a Mendelian randomization study
Wang, Z., Wang, Z., Yan, Z., Xu, Z., & Gao, A. (2023) · BMC Medical Genomics · doi:10.1186/s12920-023-01650-4 · Cited by 12
van de Weijer, M. P., Demange, P., Pelt, D. H. M., Bartels, M., & Nivard, M. G. (2023) · Psychological Medicine · doi:10.1017/s003329172300329x · Cited by 12
Jian, Z., Wang, M., Jin, X., & Wei, X. (2021) · Frontiers in Public Health · doi:10.3389/fpubh.2021.731962 · Cited by 13
Xu, J., Du, S., & Dong, X. (2022) · Frontiers in Public Health · doi:10.3389/fpubh.2022.868416 · Cited by 12
Li, H., Zhang, X., Zhang, X., Wang, Z., Feng, S., & Zhang, G. (2023) · Journal of Intelligence · doi:10.3390/jintelligence11020029 · Cited by 11
Liu, M., Khasiyev, F., Sariya, S., Spagnolo‐Allende, A., Sanchez, D. L., Andrews, H., Yang, Q., Beiser, A., Qiao, Y., Thomas, E. A., et al. (2023) · Journal of the American Heart Association · doi:10.1161/jaha.123.030935 · Cited by 11
Gong, M., Liu, H., Liu, Z., Wang, Y., Qi, S., Guo, H. W., & Jin, S. L. (2025) · Frontiers in Endocrinology · doi:10.3389/fendo.2025.1439341 · Cited by 10
Huang, Y., Wang, S., Tian, L., Zhang, X., Liu, S., Zhu, Z., Wang, W., Shi, D., He, M., & Shang, X. (2025) · The journal of nutrition health & aging · doi:10.1016/j.jnha.2025.100525 · Cited by 11
Femoral neck width genetic risk score is a novel independent risk factor for hip fractures
Tobias, J. H., Nethander, M., Faber, B. G., Heppenstall, S. V., Ebsim, R., Cootes, T. F., Lindner, C., Saunders, F. R., Gregory, J. S., Aspden, R. M., et al. (2024) · Journal of Bone and Mineral Research · doi:10.1093/jbmr/zjae002 · Cited by 11
Genetically determined intelligence and coronary artery disease risk
Li, L., Pang, S., Zeng, L., Güldener, U., & Schunkert, H. (2020) · Clinical Research in Cardiology · doi:10.1007/s00392-020-01721-x · Cited by 9
Schmiedek, F., Kroehne, U., Goldhammer, F., Prindle, J., Lindenberger, U., Klinger-König, J., Grabe, H. J., Riedel-Heller, S. G., Pabst, A., Streit, F., et al. (2022) · The World Journal of Biological Psychiatry · doi:10.1080/15622975.2021.2011407 · Cited by 9
Li, Y., Zhang, J., Wen, J., Liu, M., Liu, W., & Li, Y. (2023) · Frontiers in Immunology · doi:10.3389/fimmu.2023.1249017 · Cited by 10
Implications of the genomic revolution for education research and policy
Morris, T., von Hinke, S., Pike, L., Ingram, N., Smith, G. D., Munafo, M. R., & Davies, N. M. (2022) · British Educational Research Journal · doi:10.1002/berj.3784 · Cited by 10
Self-citationMendelian randomization on the association of obesity with vitamin D: Guangzhou Biobank Cohort Study
Huang, Y. Y., Zhang, W. S., Jiang, C. Q., Zhu, F., Jin, Y. L., Cheng, K. K., Lam, T., & Xu, L. (2022) · European Journal of Clinical Nutrition · doi:10.1038/s41430-022-01234-y · Cited by 9
Educational Attainment and Ischemic Stroke: A Mendelian Randomization Study
Gao, L., Wang, K., Ni, Q., Fan, H., Zhao, L., Huang, L., Yang, M., & Li, H. (2022) · Frontiers in Genetics · doi:10.3389/fgene.2021.794820 · Cited by 8
Cunningham‐Erves, J., George, W., Sanderson, M., Stewart, E. C., Jin, S., Davis, J. S., & Brandt, H. M. (2024) · Frontiers in Public Health · doi:10.3389/fpubh.2024.1321173 · Cited by 8
Chen, J., Yang, K., Qiu, Y., Lai, W., Qi, S.-F., Wang, G., Chen, L., Li, K., Zhou, D., Liu, Q., et al. (2023) · Cancer Medicine · doi:10.1002/cam4.5974 · Cited by 8
Ye, Z., Mo, C., Liu, S., Gao, S., Feng, L., Zhao, B., Canida, T. A., Wu, Y., Hatch, K. S., Ma, Y., et al. (2023) · Journal of Neuroscience Research · doi:10.1002/jnr.25205 · Cited by 7
Cadar, D., Robitaille, A., Pattie, A., Deary, I. J., & Terrera, G. M. (2020) · Psychology and Aging · doi:10.1037/pag0000477 · Cited by 8
Self-citationC-reactive protein and cognitive impairment: A bidirectional Mendelian randomization study
Xie, W., Kong, C., Luo, W., Zheng, J., & Zhou, Y. (2024) · Archives of Gerontology and Geriatrics · doi:10.1016/j.archger.2024.105359 · Cited by 8
Lin, Y.-L., Yao, T., Wang, Y.-W., Yu, J., Zhen, C., Lin, J., & Chen, S.-B. (2024) · Clinics and Research in Hepatology and Gastroenterology · doi:10.1016/j.clinre.2024.102419 · Cited by 7
Genetics of educational attainment and coronary risk in Mendelian randomization studies
Schunkert, H., Erdmann, J., Samani, N. J., Deloukas, P., & Zeng, L. (2020) · European Heart Journal · doi:10.1093/eurheartj/ehz946 · Cited by 7
Education and Atrial Fibrillation: Mendelian Randomization Study
Liu, Y., Liu, C., & Liu, Q. (2022) · Global Heart · doi:10.5334/gh.1107 · Cited by 7
Mao, B., Kanjanarat, P., Wongpakaran, T., Permsuwan, U., & O’Donnell, R. R. (2023) · Healthcare · doi:10.3390/healthcare11152174 · Cited by 6
Wright, L., Davies, N. M., & Bann, D. (2023) · PLoS Medicine · doi:10.1371/journal.pmed.1004207 · Cited by 8
Self-citationArmitage, J. M., Wootton, R. E., Davis, O. S. P., & Haworth, C. M. A. (2024) · npj Mental Health Research · doi:10.1038/s44184-024-00066-x · Cited by 7
Li, Y., Wang, S., Liu, L., Cai, H., Huang, Y., Gao, M., Zhang, X., Wu, Q., & Qiu, G. (2025) · Advanced Science · doi:10.1002/advs.202413491 · Cited by 6
Mediators of the association between education and periodontitis: Mendelian randomization study
Chen, Y., Wang, L., Mo, S.-Q., Zhao, D., Fan, Y.-Z., Zhang, R.-N., Zhu, Z., Guo, L., & Shen, W. (2025) · BMC Oral Health · doi:10.1186/s12903-025-06006-1 · Cited by 5
Howell, I., Noble, J., Howell, A., Morgan, C., Logan, J., Miller, S., Chaudhuri, R., Russell, R. E. K., Bafadhel, M., Beasley, R. W., et al. (2025) · Respirology · doi:10.1111/resp.70077 · Cited by 5
Tanveer, M., Tanveer, U., Zeba, A., & Siener, M. (2024) · Journal of Population Therapeutics and Clinical Pharmacology · doi:10.53555/jptcp.v31i2.4576 · Cited by 5
Woolf, B. A. R., Gill, D., Grant, A. J., & Burgess, S. (2024) · PLoS ONE · doi:10.1371/journal.pone.0291183 · Cited by 5
Avinun, R. (2019) · bioRxiv (Cold Spring Harbor Laboratory) · doi:10.1101/727552 · Cited by 4
Wang, H., Chen, Z., Dang, X., & Wang, H. (2023) · Frontiers in Genetics · doi:10.3389/fgene.2023.1280378 · Cited by 4
Two sample Mendelian Randomisation using an outcome from a multilevel model of disease progression
Lawton, M. A., Ben-Shlomo, Y., Gkatzionis, A., Hu, M. T. M., Grosset, D., & Tilling, K. (2023) · European Journal of Epidemiology · doi:10.1007/s10654-023-01093-2 · Cited by 4
Lin, X., Zuo, Y., Hu, H., & Zhou, J. (2024) · Frontiers in Genetics · doi:10.3389/fgene.2024.1393106 · Cited by 4
Luo, P., & Huang, C. (2024) · Frontiers in Nutrition · doi:10.3389/fnut.2024.1375179 · Cited by 4
Zhang, K., Zhou, J., Li, A., & Chen, M. (2023) · Frontiers in Medicine · doi:10.3389/fmed.2023.1162153 · Cited by 3
Wang, J., & Yang, G. (2024) · Frontiers in Neurology · doi:10.3389/fneur.2024.1434433 · Cited by 3
Corley, E., Fahey, L., Fitzgerald, J. C., Holleran, L., Walton, E., Morris, D. W., & Donohoe, G. J. (2023) · Genes Brain & Behavior · doi:10.1111/gbb.12850 · Cited by 2
Xia, C., Lu, Y., Zhou, Z., Marchi, M., Kweon, H., Ning, Y., Liewald, D. C. M., Anderson, E. L., Koellinger, P., Cox, S. R., et al. (2025) · Molecular Psychiatry · doi:10.1038/s41380-025-03047-4 · Cited by 6
Self-citationUsing instrumental variables to estimate the attributable fraction
Dahlqwist, E., Kutalik, Z., & Sjölander, A. (2019) · Statistical Methods in Medical Research · doi:10.1177/0962280219879175 · Cited by 3
Papadimitriou, N., Kazmi, N., Dimou, N. L., Tsilidis, K. K., Martin, R. M., Lewis, S. J., Lynch, B. M., Hoffmeister, M., Kweon, S., Li, L., et al. (2023) · Cancer Medicine · doi:10.1002/cam4.6732 · Cited by 2
Li, C., Xian, X., Zhao, X., Liu, H., Wu, X., Chen, Y., Cao, P., Miao, F., Yan, J., & Zhang, X. (2025) · International Journal of Cardiology · doi:10.1016/j.ijcard.2025.133746 · Cited by 2
Vertical pleiotropy explains the heritability of social science traits
Alexander, N., Illius, S., Feyerabend, D., Wacker, J., & Liszkowski, U. (2022) · Behavioral and Brain Sciences · doi:10.1017/s0140525x22002382 · Cited by 9
Self-citationSchmengler, H., Oldehinkel, A. J., Vollebergh, W., Pasman, J. A., Hartman, C. A., Stevens, G. W. J. M., Nolte, I. M., & Peeters, M. (2023) · Social Science & Medicine · doi:10.1016/j.socscimed.2023.116254 · Cited by 2
Qu, H., He, C., Xu, H., & Sun, X. (2023) · Medicine · doi:10.1097/md.0000000000035037 · Cited by 2
Environmental Influences on Genetic Contributions to Intelligence and Education
Hill, W. D. (2021) · American Journal of Psychiatry · doi:10.1176/appi.ajp.2021.21050545 · Cited by 2
Self-citationMagriplis, E., Bakogianni, I., Arvaniti, F., Kotopoulou, S., Smiliotopoulos, T., Karatzi, K., Karounias, D., Panagiotakos, D. B., & Zampelas, A. (2025) · Journal of Public Health · doi:10.1007/s10389-025-02441-0 · Cited by 1
Key Targets in Subacute Spinal Cord Injury Identified by Bioinformatics and Mendelian Randomization
Yuan, X., Zhang, M., Wang, F., Wang, X., Cui, L., Tang, B., Song, X., Wang, X., Zhang, L., Wang, Z., et al. (2025) · World Neurosurgery · doi:10.1016/j.wneu.2025.123966 · Cited by 1
Okyere, J., Dosoo, A. K., Ayebeng, C., Duodu, P. A., & Dickson, K. S. (2025) · Journal of Health Population and Nutrition · doi:10.1186/s41043-025-00838-x · Cited by 1
Shared genetic etiology between childhood cognitive function and longevity
Hill, W. D., & Deary, I. J. (2025) · Genomic psychiatry : · doi:10.61373/gp025l.0098 · Cited by 1
Self-citationEducational Attainment as the Primary Socioeconomic Determinant of Heart Failure
Ye, M., Gu, Z., Guo, S., Xu, H., Dong, Y., Zhu, W., & Sun, J. (2025) · JACC Advances · doi:10.1016/j.jacadv.2025.102268 · Cited by 1
Metadata
- Authors
- Davies, N. M., Hill, W. D., Anderson, E. L., Sanderson, E., Deary, I. J., & Davey Smith, G.
- Affiliations
- University of Bristol (GB)
- University of Edinburgh (GB)
- Medical Research Council Integrative Epidemiology Unit, University of Bristol, Bristol, United Kingdom
- Corresponding author
- Davies, Neil Martin
- ORCID
- Venue
- eLife
- Publisher
- eLife Sciences Publications, Ltd
- Published
- 2019-09-17
- Volume
- 8
- ISSN
- 2050-084X (ISSN-L)
- PMC
- PMC6748790
- OpenAlex
- W2974720922
- Cited by
- 135
- References
- 66
- Citations by year
- 2026: 6 · 2025: 19 · 2024: 26 · 2023: 33 · 2022: 18 · 2021: 17 · 2020: 12 · 2019: 4
- FWCI
- 7.68
- Type
- journal article
- Language
- en
- Open access
- gold
- doi.org
- Licence
- Locations
- eLife (publishedVersion, cc-by)
- Europe PMC (PubMed Central) (publishedVersion, cc-by)
- PubMed Central (publishedVersion, cc-by)
- PubMed (publishedVersion)
- DOAJ (DOAJ: Directory of Open Access Journals) (submittedVersion, cc-by-sa)
- Edinburgh Research Explorer (University of Edinburgh) (submittedVersion, cc-by)
- Bristol Research (University of Bristol) (submittedVersion, cc-by)
- Funders
- Economic and Social Research Council (ES/N000757/1)
- Medical Research Council (MC_UU_12013/1, MC_UU_12013/9, MC_UU_00011/1, MR/K026992/1)
- Age UK (Disconnected Mind Grant)
- Topics
- Life Sciences › Biochemistry, Genetics and Molecular Biology › Genetics › Genetic Associations and Epidemiology
- Social Sciences › Psychology › Experimental and Cognitive Psychology › Cognitive Abilities and Testing
- Social Sciences › Sociology and Political Science › Intergenerational and Educational Inequality Studies
- Keywords
- intelligence, educational attainment, mental health, physical health, socioeconomic position, longevity, income, alcohol consumption, physical activity, smoking, body mass index, sedentary behavior, genetic correlation
- MeSH terms
- Adult, Aged, Education, Female, United Kingdom, Health, Humans, Intelligence, Health Knowledge, Attitudes, Practice, Male, Middle Aged, Biostatistics
About these checks
Registry, retraction, Cites and statistics results are computed, not judged, with one exception: a printed reference that no index lists is read once by a model before it counts as a citation error. Claims are extracted by a model and kept only when their quote appears verbatim in the text; each cited source is then checked, with a model’s help, for whether it says what the claim relies on. Those verdicts can be wrong — read the claim’s quote and the cited source before relying on one.
Statistics and arithmetic are recomputed, not judged.
Confidence bands are shown only for fields calibrated on our annotated test set. None is calibrated yet, so no band is shown.
What counts as a claim ›How we measure confidence ›How we check this ›
Are you an author, or do you see a problem with this page? Request a review
