Cited by 164Memory and Neural MechanismsMemory Processes and InfluencesMeta-analysis and systematic reviews

The DOI matches its Crossref record; 86 of the 86 references it cites were found in a registry or an index.

Navigating the garden of forking paths for data exclusions in fear conditioning research

Open access

Published version of a preprint

Abstract

In this report, we illustrate the considerable impact of researcher degrees of freedom with respect to exclusion of participants in paradigms with a learning element. We illustrate this empirically through case examples from human fear conditioning research, in which the exclusion of 'non-learners' and 'non-responders' is common - despite a lack of consensus on how to define these groups. We illustrate the substantial heterogeneity in exclusion criteria identified in a systematic literature search and highlight the potential problems and pitfalls of different definitions through case examples based on re-analyses of existing data sets. On the basis of these studies, we propose a consensus on evidence-based rather than idiosyncratic criteria, including clear guidelines on reporting details. Taken together, we illustrate how flexibility in data collection and analysis can be avoided, which will benefit the robustness and replicability of research findings and can be expected to be applicable to other fields of research that involve a learning element.

Overview

The claims and statistics of this paper haven’t been checked yet.

Run the check — free, no account needed. It reads the open-access text and checks the sources it cites.

A few free checks a day · papers already verified open instantly · results are public

Integrity signals

Registry

Crossref · 10.7554/elife.52465

Cites

86 of 86 references verified0 citation errors · 0 not checkable

Statistics

Figures

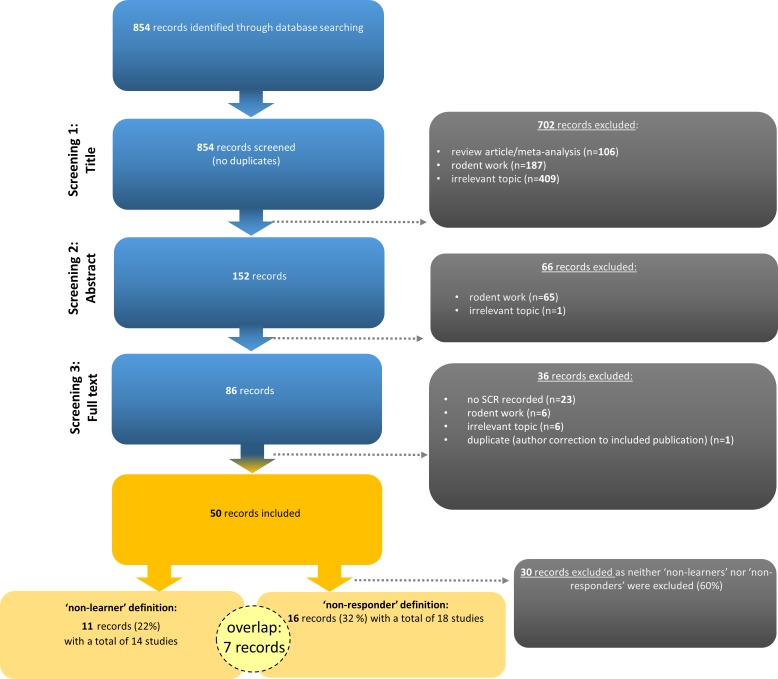
Figure 1. Flow chart illustrating the selection of records according to PRISMA guidelines (Moher et al., 2009). Note that seven records (14%) employed the definition and exclusion of both ‘non-learners’ and ‘non-responders’. Examples of irrelevant topics included studies that did not use fear conditioning paradigms (see https://osf.io/uxdhk/ for a documentation of excluded publications).
Figure 1. Flow chart illustrating the selection of records according to PRISMA guidelines (Moher et al., 2009). Note that seven records (14%) employed the definition and exclusion of both ‘non-learners’ and ‘non-responders’. Examples of irrelevant topics included studies that did not use fear conditioning paradigms (see https://osf.io/uxdhk/ for a documentation of excluded publications).CC BY · PubMed Central
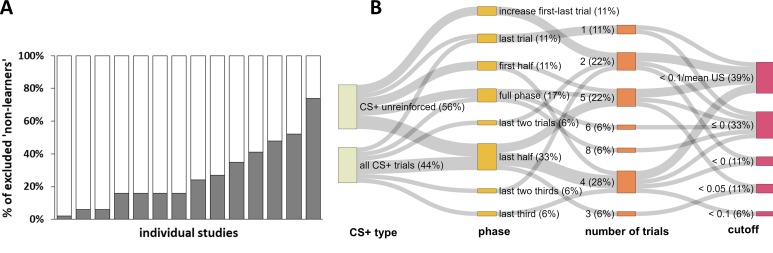
Figure 2. Graphical illustration of the percentage of ‘non-learners’ and forking path analysis across studies. (A) Illustration of the percentage of participants excluded (‘non-learners’) based on SCR CS+/CS–discrimination scores across studies included in the systematic literature search (note that these 14 individual studies are derived from 11 different records, as three records reported two individual studies each). Please note that some studies excluded participants on the basis of ‘non-learning’ as well as ‘non-responding’ (cf. Figure 1), and hence the percentages displayed here do not necessarily map onto the percentage of total participants excluded per study. Also note that the study with the highest percentage of excluded participants (i.e., 74%) reported the percentage of excluded participants as a single value that included ‘non-learners’ and ‘non-responders’. This study is only included here because the largest proportion of exclusions can be expected to result from ‘non-learning’. (B) Sanky plot showing the ‘forking paths’ of performance-based exclusion of participants as 'non-learners', illustrating differences in the experimental phase, number of trials, the SCR CS+/CS– discrimination score in µS used to define a ‘non-learner’, the CS+ type considered (illustrated as the nodes in graded colors) and their combinations used to define 'non-learners' across studies. Path width was scaled in relation to frequency of the combinations. Note that for some ‘nodes’ the percentages do not add up to 100% because of rounding.
Figure 2. Graphical illustration of the percentage of ‘non-learners’ and forking path analysis across studies. (A) Illustration of the percentage of participants excluded (‘non-learners’) based on SCR CS+/CS–discrimination scores across studies included in the systematic literature search (note that these 14 individual studies are derived from 11 different records, as three records reported two individual studies each). Please note that some studies excluded participants on the basis of ‘non-learning’ as well as ‘non-responding’ (cf. Figure 1), and hence the percentages displayed here do not necessarily map onto the percentage of total participants excluded per study. Also note that the study with the highest percentage of excluded participants (i.e., 74%) reported the percentage of excluded participants as a single value that included ‘non-learners’ and ‘non-responders’. This study is only included here because the largest proportion of exclusions can be expected to result from ‘non-learning’. (B) Sanky plot showing the ‘forking paths’ of performance-based exclusion of participants as 'non-learners', illustrating differences in the experimental phase, number of trials, the SCR CS+/CS– discrimination score in µS used to define a ‘non-learner’, the CS+ type considered (illustrated as the nodes in graded colors) and their combinations used to define 'non-learners' across studies. Path width was scaled in relation to frequency of the combinations. Note that for some ‘nodes’ the percentages do not add up to 100% because of rounding.CC BY · PubMed Central
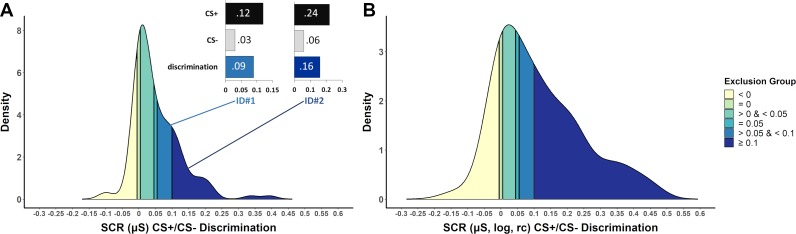
Figure 3. Density plots illustrating the frequency of CS+/CS– discrimination scores in a sample of N = 116 (Data set 1) based on the last half of the acquisition phase (including 7 CS+ and 7CS–, 100% reinforcement rate) for (A) SCR raw data and (B) logarithmized and range-corrected (rc; individual trial SCR/SCRmax_across_all_trials) SCR data (as it is typically not reported to which data exclusion criteria are applied). Color coding (yellow to blue) illustrates which part of the sample would be excluded when applying the performance-based exclusion criteria (i.e. CS+/CS– discrimination) as identified by the systematic literature search. Panel (A) also illustrates two case examples (ID#1 and ID#2) that differ in SCR amplitudes but importantly show the same discrimination ratio between CS+ and CS– (4:1). These two case examples illustrate that high CS+/CS– discrimination cutoffs favor individuals with high SCR amplitudes to remain in the final sub-sample. Data are based on a re-analysis of an unpublished data set recorded in the fMRI environment (Klingelhöfer-Jens M., Kuhn, M. and Lonsdorf, T.B.; unpublished).
Figure 3. Density plots illustrating the frequency of CS+/CS– discrimination scores in a sample of N = 116 (Data set 1) based on the last half of the acquisition phase (including 7 CS+ and 7CS–, 100% reinforcement rate) for (A) SCR raw data and (B) logarithmized and range-corrected (rc; individual trial SCR/SCRmax_across_all_trials) SCR data (as it is typically not reported to which data exclusion criteria are applied). Color coding (yellow to blue) illustrates which part of the sample would be excluded when applying the performance-based exclusion criteria (i.e. CS+/CS– discrimination) as identified by the systematic literature search. Panel (A) also illustrates two case examples (ID#1 and ID#2) that differ in SCR amplitudes but importantly show the same discrimination ratio between CS+ and CS– (4:1). These two case examples illustrate that high CS+/CS– discrimination cutoffs favor individuals with high SCR amplitudes to remain in the final sub-sample. Data are based on a re-analysis of an unpublished data set recorded in the fMRI environment (Klingelhöfer-Jens M., Kuhn, M. and Lonsdorf, T.B.; unpublished).CC BY · PubMed Central
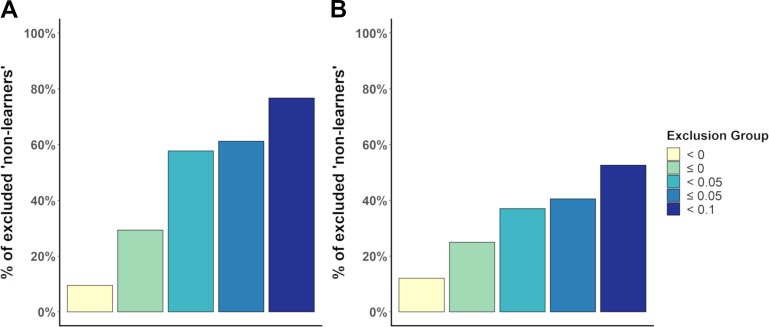
Figure 3—figure supplement 1. Percentages of participants excluded (Data set 1) when employing the different CS+/CS– discrimination cutoffs (as identified by the systematic literature search and graphically shown in Figure 3B) which are illustrated as density plots in Figure 3. Percentages are calculated on the basis of (A) raw SCR scores or (B) logarithmized and range-corrected scores in Data set 1. Note that the different groups are cumulative (i.e., the darker colored groups also comprise the lighter colored groups).
Figure 3—figure supplement 1. Percentages of participants excluded (Data set 1) when employing the different CS+/CS– discrimination cutoffs (as identified by the systematic literature search and graphically shown in Figure 3B) which are illustrated as density plots in Figure 3. Percentages are calculated on the basis of (A) raw SCR scores or (B) logarithmized and range-corrected scores in Data set 1. Note that the different groups are cumulative (i.e., the darker colored groups also comprise the lighter colored groups).CC BY · PubMed Central
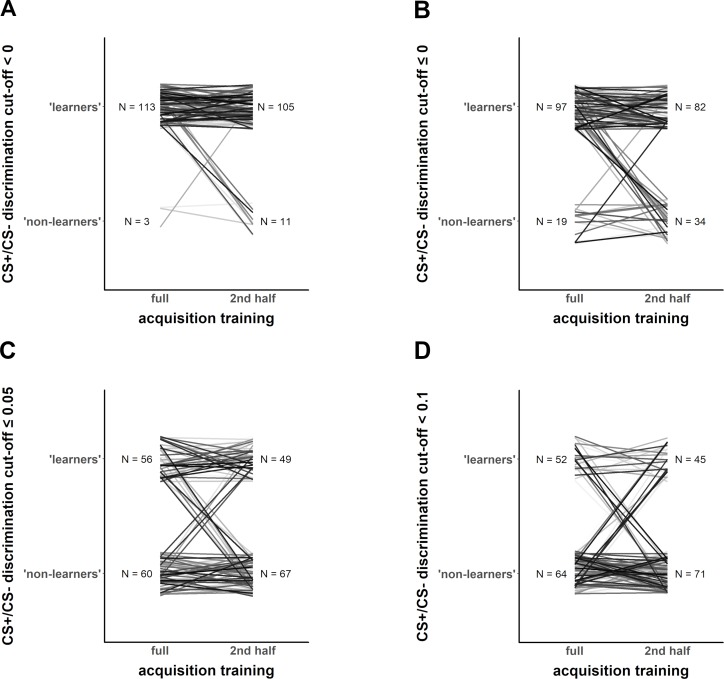
Figure 4. Exemplary illustration of individuals (Data set 1) that switch from being classified as ‘learners’ vs. ‘non-learners’ depending on the different CS+/CS– discrimination cutoff level (panels A–D), when calculation of CS+/CS– discrimination is based on either the full fear acquisition phase or the second half of the fear acquisition training (left and right part of each panel, respectively).
Figure 4. Exemplary illustration of individuals (Data set 1) that switch from being classified as ‘learners’ vs. ‘non-learners’ depending on the different CS+/CS– discrimination cutoff level (panels A–D), when calculation of CS+/CS– discrimination is based on either the full fear acquisition phase or the second half of the fear acquisition training (left and right part of each panel, respectively).CC BY · PubMed Central
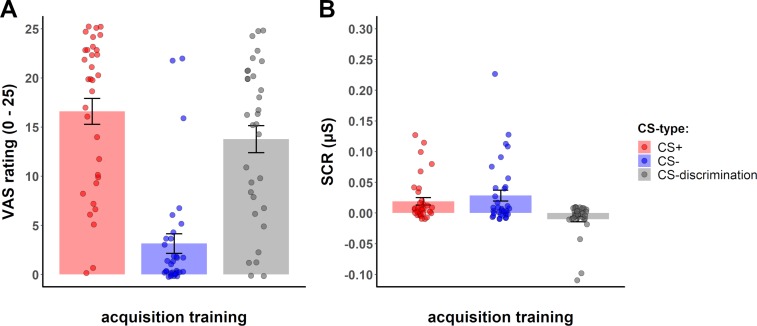
Figure 4—figure supplement 1. Bar plots (mean ± SE) on which the superimposed individual data points show CS+ and CS– amplitudes (of raw SCR values) and CS+/CS– discrimination in (A) fear ratings and (B) SCRs raw values in the group of ‘non-learners’, as exemplarily defined for this example as a group consisting of individuals in the two lowest SCR CS+/CS– discrimination cutoff groups (i.e., ≤0) in Data set 1. This illustrates that individuals who fail to show CS+/CS– discrimination in SCRs (B) may in fact show substantial CS+/CS– discrimination (as an indicator for successful learning) in other outcome measures, as exemplarily illustrated here for fear ratings (A).
Figure 4—figure supplement 1. Bar plots (mean ± SE) on which the superimposed individual data points show CS+ and CS– amplitudes (of raw SCR values) and CS+/CS– discrimination in (A) fear ratings and (B) SCRs raw values in the group of ‘non-learners’, as exemplarily defined for this example as a group consisting of individuals in the two lowest SCR CS+/CS– discrimination cutoff groups (i.e., ≤0) in Data set 1. This illustrates that individuals who fail to show CS+/CS– discrimination in SCRs (B) may in fact show substantial CS+/CS– discrimination (as an indicator for successful learning) in other outcome measures, as exemplarily illustrated here for fear ratings (A).CC BY · PubMed Central
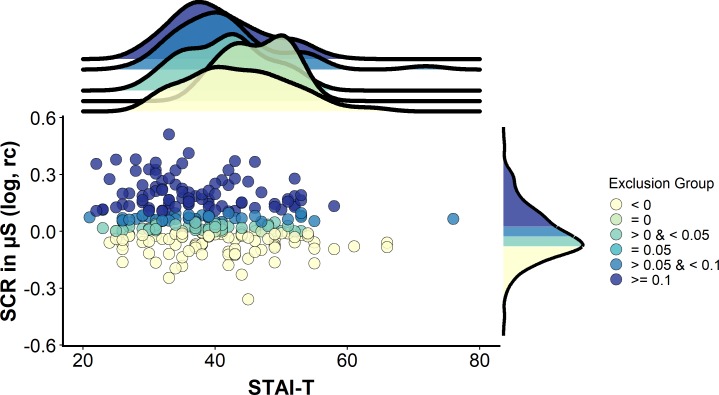
Figure 5. A case example illustrating potential sample bias induced by excluding individuals on the basis of CS+/CS– discrimination scores (based on logarithmized, range-corrected (rc) SCR data). Scatterplot illustrating the association between trait anxiety (measured via the trait version of the State-Trait Anxiety Inventory, STAI-T) and CS+/CS– discrimination scores in a sample of N = 268 (Data set 2). Color coding (yellow to blue) illustrates which part of the sample would be excluded when applying the performance-based exclusion criteria (i.e. CS+/CS– discrimination) as identified by the systematic literature search. Note that within this sample, no individuals were identified with CS+/CS– discrimination equaling 0.05 µS. The upper panel illustrates densities for trait anxiety for the different CS+/CS–discrimination groups. The rightmost panel illustrates the density for CS+/CS– discrimination in the full sample. Data are based on a re-analysis of a data set recorded in the behavioral environment (Schiller et al., 2010). Note that despite the different color coding, which serves illustrative purposes only, the groups are in practice cumulative. More precisely, the groups illustrated by lighter colors are always contained in the darker colored groups when applying the respective cutoffs. For example, the group excluded when employing a cutoff of <0.1 µS (mid blue) also comprises the groups already excluded for the lower cutoffs of = 0.05 µS (light blue), <0.05 µS (turquoise), = 0 µS (light green) and <0 µS (yellow). For illustrative purposes, the different groups are treated as separate groups in this figure.
Figure 5. A case example illustrating potential sample bias induced by excluding individuals on the basis of CS+/CS– discrimination scores (based on logarithmized, range-corrected (rc) SCR data). Scatterplot illustrating the association between trait anxiety (measured via the trait version of the State-Trait Anxiety Inventory, STAI-T) and CS+/CS– discrimination scores in a sample of N = 268 (Data set 2). Color coding (yellow to blue) illustrates which part of the sample would be excluded when applying the performance-based exclusion criteria (i.e. CS+/CS– discrimination) as identified by the systematic literature search. Note that within this sample, no individuals were identified with CS+/CS– discrimination equaling 0.05 µS. The upper panel illustrates densities for trait anxiety for the different CS+/CS–discrimination groups. The rightmost panel illustrates the density for CS+/CS– discrimination in the full sample. Data are based on a re-analysis of a data set recorded in the behavioral environment (Schiller et al., 2010). Note that despite the different color coding, which serves illustrative purposes only, the groups are in practice cumulative. More precisely, the groups illustrated by lighter colors are always contained in the darker colored groups when applying the respective cutoffs. For example, the group excluded when employing a cutoff of <0.1 µS (mid blue) also comprises the groups already excluded for the lower cutoffs of = 0.05 µS (light blue), <0.05 µS (turquoise), = 0 µS (light green) and <0 µS (yellow). For illustrative purposes, the different groups are treated as separate groups in this figure.CC BY · PubMed Central
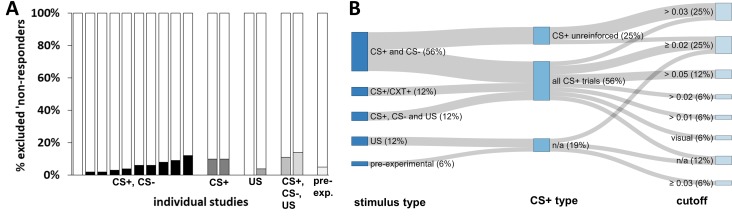
Figure 6. Graphical illustration of the percentage of ‘non-responders’ and forking path analysis across studies. (A) Illustration of the percentage of participants excluded from each study as a result of ‘ SCR non-responding’ to (i) the conditioned stimuli (i.e., CS+ and CS–), (ii) the US, (iii) the CS+ (which also comprises a study that used the CXT+, i.e. context), (iv) the CS+, CS– and US or (v) a pre-experimental test. Note that these 18 individual studies are derived from 16 different records, two of which included two different studies that used the same criteria. Note that some studies excluded participants on the basis of ‘non-learning’ as well as ‘non-responding’, and hence the percentages displayed here do not necessarily map onto the percentage of total participants excluded from each study. Also note that a single study (Schiller et al., 2018) is not included in this visualization because it reported % ‘non-learners’ and % ‘non-responders’ as a single value. This value has been included in the visualization of ‘non-learners’ (Figure 2) as these are expected to represent the largest proportion. (B) Sanky plot illustrating the stimulus type (pre-experiment refers to determination of 'responding' in an unrelated phase prior to the experiment), the minimally required response amplitude in µS (note that ‘visual’ refers to visual inspection of the data without a clear-cut amplitude cutoff, NA refers to no criterion applied) illustrated as the nodes in graded colors and their combinations that lead to classification as a ‘non-responder’. Path width was scaled in relation to frequency of the combinations. Note that for some ‘nodes’ the percentages do not add up to 100% because of rounding.
Figure 6. Graphical illustration of the percentage of ‘non-responders’ and forking path analysis across studies. (A) Illustration of the percentage of participants excluded from each study as a result of ‘ SCR non-responding’ to (i) the conditioned stimuli (i.e., CS+ and CS–), (ii) the US, (iii) the CS+ (which also comprises a study that used the CXT+, i.e. context), (iv) the CS+, CS– and US or (v) a pre-experimental test. Note that these 18 individual studies are derived from 16 different records, two of which included two different studies that used the same criteria. Note that some studies excluded participants on the basis of ‘non-learning’ as well as ‘non-responding’, and hence the percentages displayed here do not necessarily map onto the percentage of total participants excluded from each study. Also note that a single study (Schiller et al., 2018) is not included in this visualization because it reported % ‘non-learners’ and % ‘non-responders’ as a single value. This value has been included in the visualization of ‘non-learners’ (Figure 2) as these are expected to represent the largest proportion. (B) Sanky plot illustrating the stimulus type (pre-experiment refers to determination of 'responding' in an unrelated phase prior to the experiment), the minimally required response amplitude in µS (note that ‘visual’ refers to visual inspection of the data without a clear-cut amplitude cutoff, NA refers to no criterion applied) illustrated as the nodes in graded colors and their combinations that lead to classification as a ‘non-responder’. Path width was scaled in relation to frequency of the combinations. Note that for some ‘nodes’ the percentages do not add up to 100% because of rounding.CC BY · PubMed Central
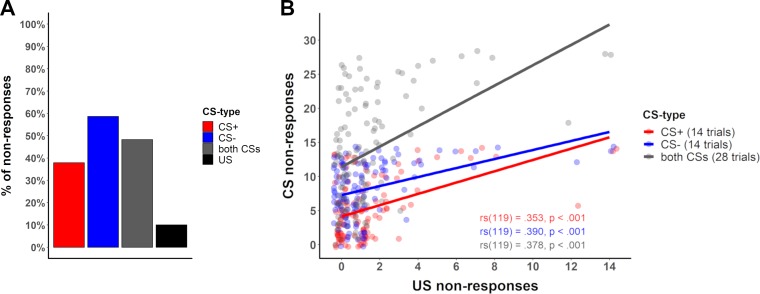
Figure 7. Percentage of no-responses across stimuli and correlation between CS and US non-responses. (A) Bar plot displaying the number of ‘non-responses’ to the CS+, CS–, across both CS and to the US across all participants in Data set 1 (see Appendix 4—table 1 for percentages across different data sets). (B) Scatterplot illustrating the number of ‘non-responses’ (i.e., zero-responses, here defined by an amplitude <0.01 µS) to the US presentations (total of 14 presentations) and the CS+ (red) and CS– (blue) responses (14 presentations each) for each participant in Data set 1. For completeness sake, ‘non-responses’ across CS types are illustrated in gray (CS+ and CS– combined, total of 28 presentations). Lines illustrate the Spearman correlation (rs) between ‘non-responses’ to the US and ‘non-responses’ to the CS+, CS– and both CS, with corresponding correlation coefficients (font color corresponds to CS type) included in the figure.
Figure 7. Percentage of no-responses across stimuli and correlation between CS and US non-responses. (A) Bar plot displaying the number of ‘non-responses’ to the CS+, CS–, across both CS and to the US across all participants in Data set 1 (see Appendix 4—table 1 for percentages across different data sets). (B) Scatterplot illustrating the number of ‘non-responses’ (i.e., zero-responses, here defined by an amplitude <0.01 µS) to the US presentations (total of 14 presentations) and the CS+ (red) and CS– (blue) responses (14 presentations each) for each participant in Data set 1. For completeness sake, ‘non-responses’ across CS types are illustrated in gray (CS+ and CS– combined, total of 28 presentations). Lines illustrate the Spearman correlation (rs) between ‘non-responses’ to the US and ‘non-responses’ to the CS+, CS– and both CS, with corresponding correlation coefficients (font color corresponds to CS type) included in the figure.CC BY · PubMed Central

Verification

Claims the paper makes

The claims and statistics of this paper haven’t been checked yet.

Run the check — free, no account needed. It reads the open-access text and checks the sources it cites.

A few free checks a day · papers already verified open instantly · results are public

Claims other papers make about this one

Each is checked against this paper’s own text: does it say what the citing paper says it does?

Self-check

Percentages, sums and reported differences re-computed from the paper’s own numbers.

The self-check needs the paper’s full text.

Citations

Cites

Show all 85 references

Research works printed but not linked: 2

  1. Pavlov, 1927, Conditioned Reflexes
  2. Sjouwerman, 2018, Individual differences in fear learning: specificity to trait-anxiety beyond other measures of negative affect and mediation via amygdala activation, 10.1101/233528 · DOI

Cited by

Sorted by citations

See all 164

Metadata

Authors
Lonsdorf, T. B., Klingelhöfer-Jens, M., Andreatta, M., Beckers, T., Chalkia, A., Gerlicher, A., Jentsch, V. L., Meir Drexler, S., Mertens, G., Richter, J., Sjouwerman, R., Wendt, J., & Merz, C. J.
Affiliations
  • University Medical Center Hamburg-Eppendorf (DE)
  • University of Würzburg (DE)
  • KU Leuven (BE)
  • University of Amsterdam (NL)
  • Ruhr University Bochum (DE)
  • Institute of Cognitive Neuroscience, Department of Cognitive Psychology, Ruhr University Bochum, Bochum, Germany
  • Department of Psychology, Utrecht University, Utrecht, Netherlands
  • Universität Greifswald (DE)
  • University of Potsdam (DE)
Venue
eLife
Published
2019-12-16
Volume
8
ISSN
2050-084X (ISSN-L)
OpenAlex
W2995231114
Cited by
164
References
85
Citations by year
2026: 16 · 2025: 23 · 2024: 15 · 2023: 27 · 2022: 26 · 2021: 33 · 2020: 21 · 2019: 1
FWCI
2.56
Type
journal article
Language
en
Open access
Locations
  • eLife (publishedVersion, cc-by)
  • PubMed Central (publishedVersion, cc-by)
  • PubMed (publishedVersion)
  • UvA-DARE (University of Amsterdam) (submittedVersion, cc-by)
  • Lirias (submittedVersion, other-oa)
  • RePub (Erasmus University Rotterdam) (submittedVersion, other-oa)
  • DOAJ (DOAJ: Directory of Open Access Journals) (submittedVersion, cc-by-sa)
  • Utrecht University Repository (Utrecht University) (submittedVersion, other-oa)
  • publish.UP (University of Potsdam) (submittedVersion)
  • PUB – Publications at Bielefeld University (Bielefeld University) (submittedVersion)
  • PsyArXiv (OSF Preprints) (submittedVersion, cc-by)
  • PsyArXiv (OSF Preprints) (submittedVersion)
  • Data Archiving and Networked Services (DANS) (submittedVersion, other-oa)
Funders
Deutsche Forschungsgemeinschaft (LO 1980/2-1, LO 1980/1-1, Project B07 44541416, 316803389 - SFB1280, WE 5873/1-1, WE 5873/5-1)
Topics
  • Life Sciences › Neuroscience › Cognitive Neuroscience › Memory and Neural Mechanisms
  • Life Sciences › Neuroscience › Cognitive Neuroscience › Memory Processes and Influences
  • Social Sciences › Decision Sciences › Statistics, Probability and Uncertainty › Meta-analysis and systematic reviews
Keywords
researcher degrees of freedom, data exclusion, fear conditioning, non-responders, exclusion criteria, learning paradigms, reporting guidelines, replicability, robustness of results
MeSH terms
Adult, Conditioning, Psychological, Fear, Female, Humans, Male

About these checks

Registry, retraction, Cites and statistics results are computed, not judged, with one exception: a printed reference that no index lists is read once by a model before it counts as a citation error. Claims are extracted by a model and kept only when their quote appears verbatim in the text; each cited source is then checked, with a model’s help, for whether it says what the claim relies on. Those verdicts can be wrong — read the claim’s quote and the cited source before relying on one.

Statistics and arithmetic are recomputed, not judged.

Confidence bands are shown only for fields calibrated on our annotated test set. None is calibrated yet, so no band is shown.

What counts as a claim ›How we measure confidence ›How we check this ›

Are you an author, or do you see a problem with this page? Request a review