

The DOI matches its Crossref record; 45 of the 46 references it cites were found in a registry or an index.
Self-blinding citizen science to explore psychedelic microdosing
Open accessAbstract
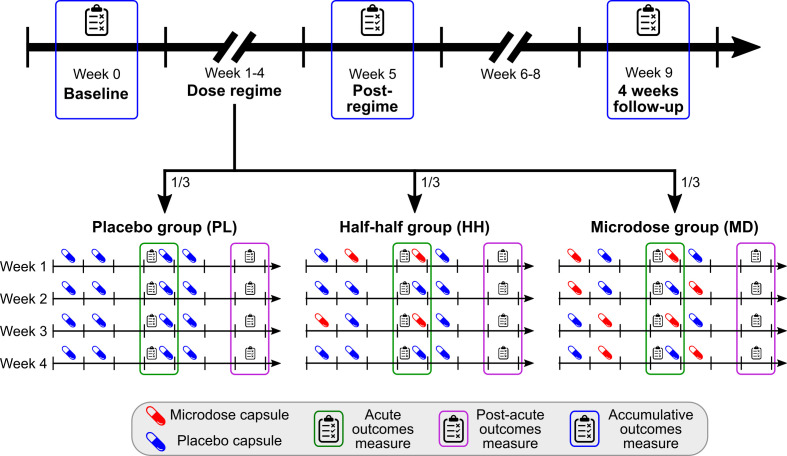
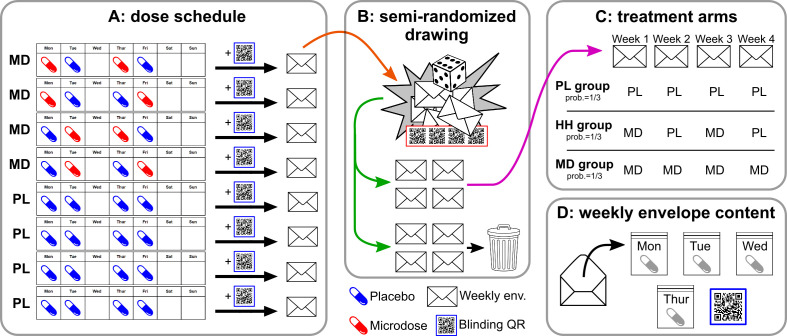
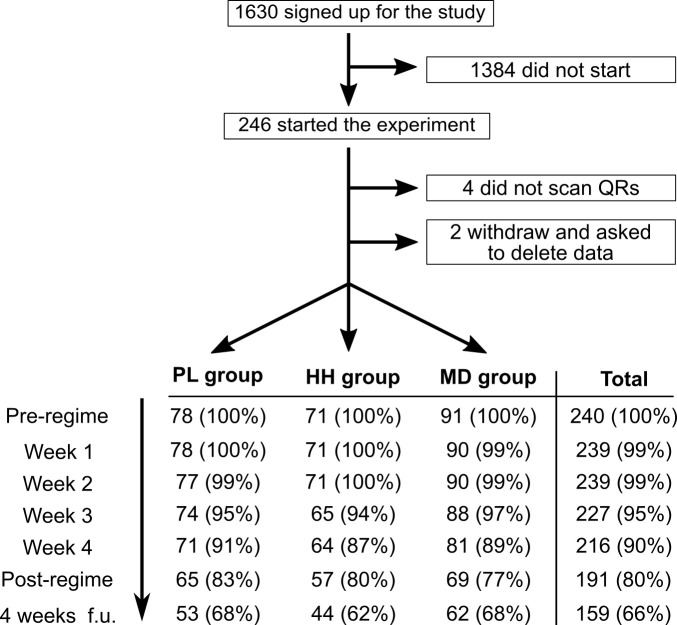
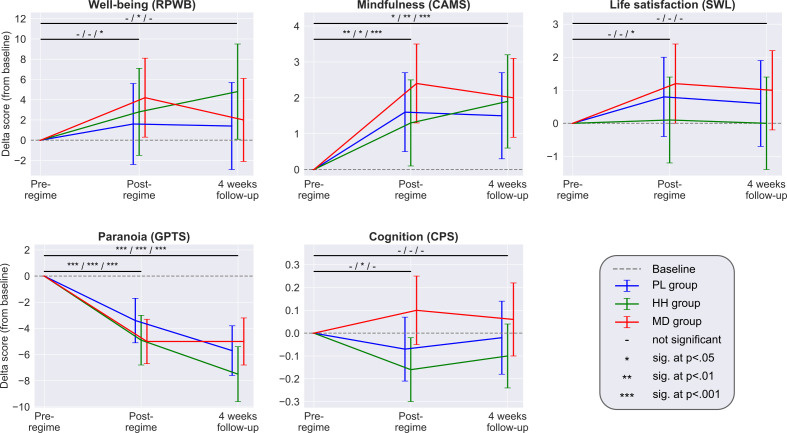
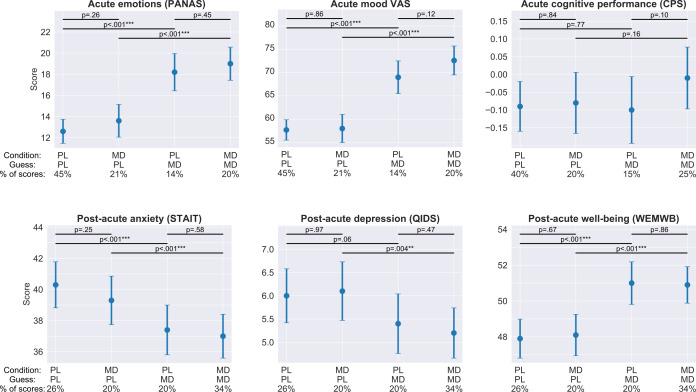
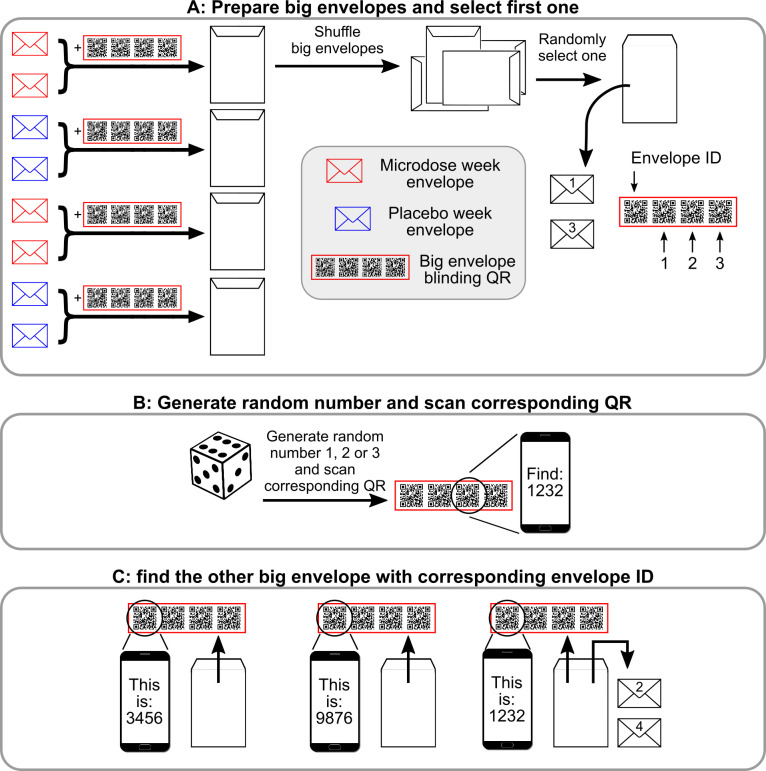
Microdosing is the practice of regularly using low doses of psychedelic drugs. Anecdotal reports suggest that microdosing enhances well-being and cognition; however, such accounts are potentially biased by the placebo effect. This study used a 'self-blinding' citizen science initiative, where participants were given online instructions on how to incorporate placebo control into their microdosing routine without clinical supervision. The study was completed by 191 participants, making it the largest placebo-controlled trial on psychedelics to-date. All psychological outcomes improved significantly from baseline to after the 4 weeks long dose period for the microdose group; however, the placebo group also improved and no significant between-groups differences were observed. Acute (emotional state, drug intensity, mood, energy, and creativity) and post-acute (anxiety) scales showed small, but significant microdose vs. placebo differences; however, these results can be explained by participants breaking blind. The findings suggest that anecdotal benefits of microdosing can be explained by the placebo effect.
Overview
The claims and statistics of this paper haven’t been checked yet.
Run the check — free, no account needed. It reads the open-access text and checks the sources it cites.
Integrity signals
Registry
Cites
Statistics
Figures
Verification
Claims the paper makes
The claims and statistics of this paper haven’t been checked yet.
Run the check — free, no account needed. It reads the open-access text and checks the sources it cites.
Claims other papers make about this one
Each is checked against this paper’s own text: does it say what the citing paper says it does?
The source backs part of the claim, not all of it — or backs it for a different population, condition or comparison.
In the citing paper
“Szigeti et al. (2021) and Marschall et al. (2021) found no differences in anxiety between microdosing and placebo groups.”
From Psychedelic Microdosing, Mindfulness, and Anxiety: A Cross-Sectional Mediation Study (2023) · cites this paper as Szigeti et al. (2021)
Experimental — accuracy not yet measuredThe cited source says what the claim attributes to it.
In the citing paper
“therapeutic benefit of low doses of psychedelics remains to be demonstrated in a well-controlled clinical study”
From Psychedelics and Other Psychoplastogens for Treating Mental Illness. (2021) · cites this paper as [244]
The cited source says what the claim attributes to it.
In the citing paper
“the data on human psychedelic microdosing are equivocal”
From Psychedelics and Other Psychoplastogens for Treating Mental Illness. (2021) · cites this paper as [244]
The cited source says what the claim attributes to it.
In the citing paper
“and another prospective study investigating a general population sample could not attribute changes to MD solely (18).”
From Trait mindfulness and personality characteristics in a microdosing ADHD sample: a naturalistic prospective survey study (2023) · cites this paper as [18]
Self-check
Percentages, sums and reported differences re-computed from the paper’s own numbers.
The self-check needs the paper’s full text.
Citations
Cites
Development and validation of brief measures of positive and negative affect: The PANAS scales.
Watson, D., Clark, L. A., & Tellegen, A. (1988) · Journal of Personality and Social Psychology · doi:10.1037/0022-3514.54.6.1063 · Cited by 32,433
The satisfaction with life scale
Diener, E., Emmons, R. A., Larsen, R. J., & Griffin, S. (1985) · Journal of Personality Assessment · doi:10.1207/s15327752jpa4901_13 · Cited by 31,768
The structure of psychological well-being revisited.
Ryff, C. D., & Keyes, C. L. M. (1995) · Journal of Personality and Social Psychology · doi:10.1037//0022-3514.69.4.719 · Cited by 10,285
An Introduction to the Five‐Factor Model and Its Applications
McCrae, R. R., & John, O. P. (1992) · Journal of Personality · doi:10.1111/j.1467-6494.1992.tb00970.x · Cited by 6,835
The Warwick-Edinburgh Mental Well-being Scale (WEMWBS): development and UK validation
Tennant, R., Hiller, L., Fishwick, R., Platt, S., Joseph, S., Weich, S., Parkinson, J., Secker, J., & Stewart-Brown, S. (2007) · Health and Quality of Life Outcomes · doi:10.1186/1477-7525-5-63 · Cited by 5,031
Rush, A. J., Trivedi, M. H., Ibrahim, H. M., Carmody, T. J., Arnow, B., Klein, D. N., Markowitz, J. C., Ninan, P. T., Kornstein, S., Manber, R., et al. (2003) · Biological Psychiatry · doi:10.1016/s0006-3223(02)01866-8 · Cited by 3,829
Four ways five factors are basic
Costa, P. T., & McCrae, R. R. (1992) · Personality and Individual Differences · doi:10.1016/0191-8869(92)90236-i · Cited by 3,594
State-Trait Anxiety Inventory for Adults
Spielberger, C. D. (2012) · PsycTESTS Dataset · doi:10.1037/t06496-000 · Cited by 3,479
Psychometric properties of the credibility/expectancy questionnaire
Devilly, G. J., & Borkovec, T. D. (2000) · Journal of Behavior Therapy and Experimental Psychiatry · doi:10.1016/s0005-7916(00)00012-4 · Cited by 2,295
A new dawn for citizen science
SILVERTOWN, J. W. (2009) · Trends in Ecology & Evolution · doi:10.1016/j.tree.2009.03.017 · Cited by 2,199
Research works printed but not linked: 1
- Fadiman J, Krob S. 2017. Microdosing: the phenomenon, research results, and startling surprises. Lecture Presented at the Psychedelic Science 2017 Conference.
Cited by
Sorted by citations
Aday, J. S., Heifets, B. D., Pratscher, S. D., Bradley, E., Rosen, R., & Woolley, J. D. (2022) · Psychopharmacology · doi:10.1007/s00213-022-06123-7 · Cited by 237
Pharmacological, neural, and psychological mechanisms underlying psychedelics: A critical review
van Elk, M., & Yaden, D. B. (2022) · Neuroscience & Biobehavioral Reviews · doi:10.1016/j.neubiorev.2022.104793 · Cited by 221
Psychedelics and Other Psychoplastogens for Treating Mental Illness.
Vargas, M. V., Meyer, R., Avanes, A. A., Rus, M., & Olson, D. E. (2021) · Frontiers in Psychiatry · doi:10.3389/fpsyt.2021.727117 · Cited by 166
Microdosing with psilocybin mushrooms: a double-blind placebo-controlled study
Cavanna, F., Muller, S. L., de la Fuente, L. A., Zamberlán, F., Palmucci, M., Janeckova, L., Kuchař, M., Pallavicini, C., & Tagliazucchi, E. (2022) · Translational Psychiatry · doi:10.1038/s41398-022-02039-0 · Cited by 157
Therapeutic effect of psilocybin in addiction: A systematic review
van der Meer, P. B., Fuentes, J. J., Kaptein, A. A., Schoones, J. W., de Waal, M. M., Goudriaan, A. E., Kramers, K., Schellekens, A., Somers, M., Bossong, M. G., et al. (2023) · Frontiers in Psychiatry · doi:10.3389/fpsyt.2023.1134454 · Cited by 127
Metadata
- Authors
- Szigeti, B., Kartner, L., Blemings, A., Rosas, F., Feilding, A., Nutt, D. J., Carhart-Harris, R. L., & Erritzoe, D.
- Affiliations
- Imperial College London (GB)
- Centre for Psychedelic Research, Imperial College London, London, United Kingdom
- Beckley Foundation (GB)
- Corresponding author
- Szigeti, Balázs
- Venue
- eLife
- Publisher
- eLife Sciences Publications, Ltd
- Published
- 2021-03-02
- Volume
- 10
- ISSN
- 2050-084X (ISSN-L)
- PMC
- PMC7925122
- OpenAlex
- W3134377893
- Cited by
- 192
- References
- 46
- Citations by year
- 2026: 24 · 2025: 31 · 2024: 34 · 2023: 35 · 2022: 45 · 2021: 22
- FWCI
- 23.19
- Type
- journal article
- Language
- en
- Open access
- gold
- doi.org
- Licence
- Locations
- eLife (publishedVersion, cc-by)
- PubMed Central (publishedVersion, cc-by)
- PubMed (publishedVersion)
- Sussex Research Online (University of Sussex) (submittedVersion, cc-by)
- DOAJ (DOAJ: Directory of Open Access Journals) (submittedVersion, cc-by-sa)
- eScholarship (California Digital Library) (submittedVersion, cc-by)
- Figshare (submittedVersion, cc-by)
- Spiral (Imperial College London) (submittedVersion, cc-by)
- Funders
- National Institute for Health and Care Research (ACF-2013-21-501, CL-2017-21-004)
- Academy of Medical Sciences (SGL019\1063)
- Topics
- Social Sciences › Psychology › Clinical Psychology › Psychedelics and Drug Studies
- Life Sciences › Neuroscience › Cognitive Neuroscience › Pain Management and Placebo Effect
- Social Sciences › Psychology › Social Psychology › Paranormal Experiences and Beliefs
- Keywords
- psychedelic microdosing, placebo effect, citizen science, subjective well-being, mood, anxiety, creativity, emotional state
- MeSH terms
- Citizen Science, Adult, Affect, Cognition, Creativity, Dose-Response Relationship, Drug, Emotions, Female, Hallucinogens, Humans, Male, Placebo Effect
About these checks
Registry, retraction, Cites and statistics results are computed, not judged, with one exception: a printed reference that no index lists is read once by a model before it counts as a citation error. Claims are extracted by a model and kept only when their quote appears verbatim in the text; each cited source is then checked, with a model’s help, for whether it says what the claim relies on. Those verdicts can be wrong — read the claim’s quote and the cited source before relying on one.
Statistics and arithmetic are recomputed, not judged.
Confidence bands are shown only for fields calibrated on our annotated test set. None is calibrated yet, so no band is shown.
What counts as a claim ›How we measure confidence ›How we check this ›
Are you an author, or do you see a problem with this page? Request a review
