

The DOI matches its Crossref record; 10 of the 10 references it cites were found in a registry or an index.
Pervasive duplication of tumor suppressors in Afrotherians during the evolution of large bodies and reduced cancer risk
Published version of a preprint
Abstract
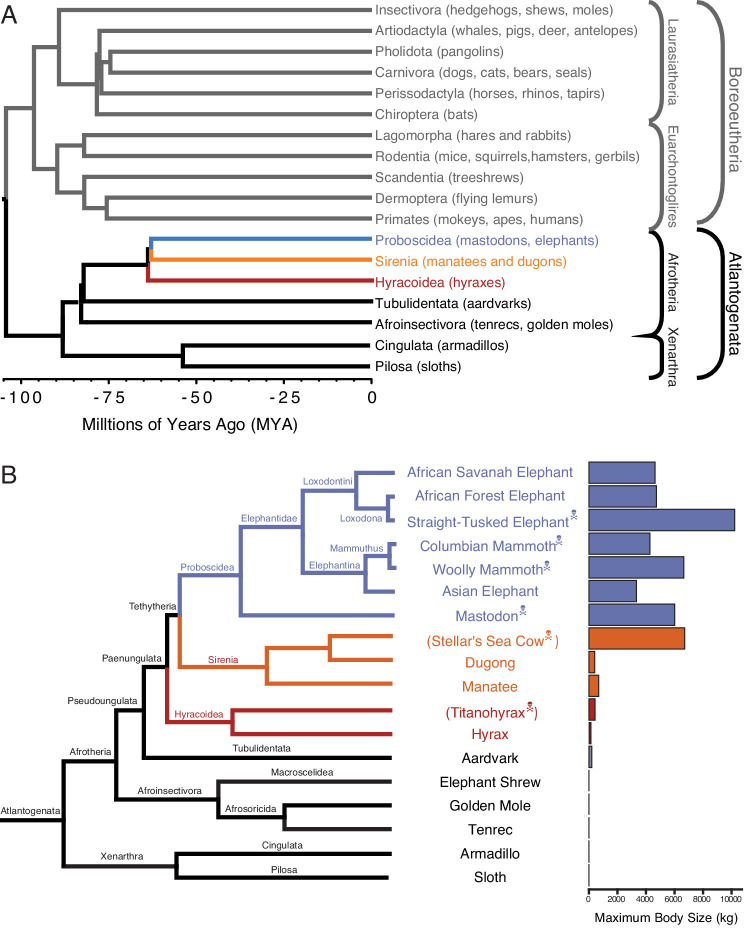
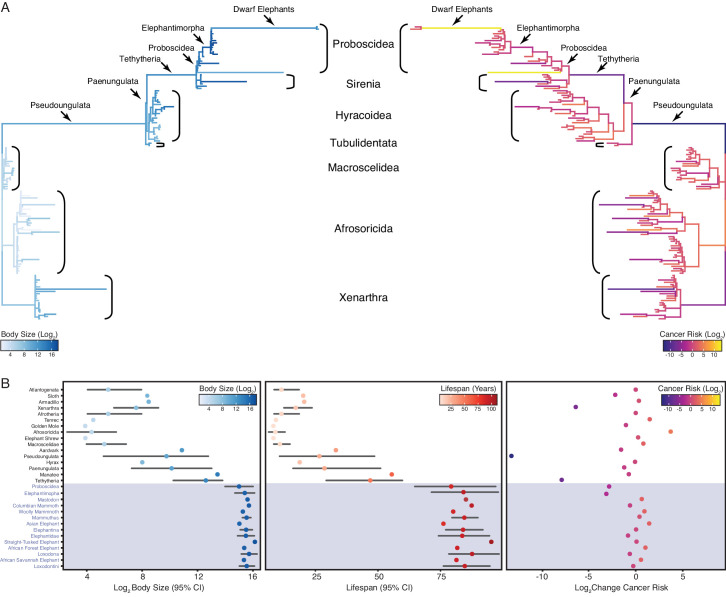
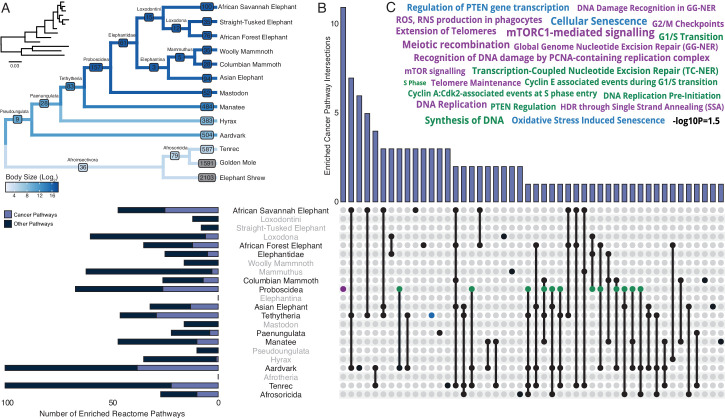
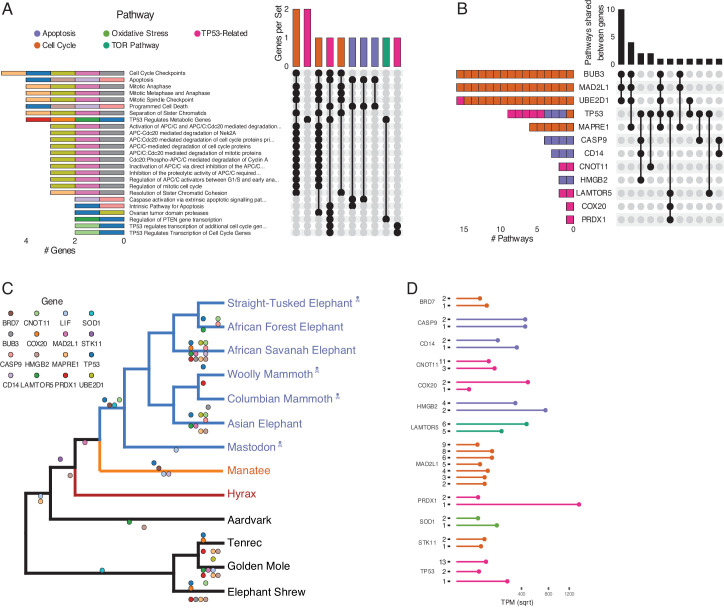
The risk of developing cancer is correlated with body size and lifespan within species. Between species, however, there is no correlation between cancer and either body size or lifespan, indicating that large, long-lived species have evolved enhanced cancer protection mechanisms. Elephants and their relatives (Proboscideans) are a particularly interesting lineage for the exploration of mechanisms underlying the evolution of augmented cancer resistance because they evolved large bodies recently within a clade of smaller-bodied species (Afrotherians). Here, we explore the contribution of gene duplication to body size and cancer risk in Afrotherians. Unexpectedly, we found that tumor suppressor duplication was pervasive in Afrotherian genomes, rather than restricted to Proboscideans. Proboscideans, however, have duplicates in unique pathways that may underlie some aspects of their remarkable anti-cancer cell biology. These data suggest that duplication of tumor suppressor genes facilitated the evolution of increased body size by compensating for decreasing intrinsic cancer risk.
Overview
The claims and statistics of this paper haven’t been checked yet.
Run the check — free, no account needed. It reads the open-access text and checks the sources it cites.
Integrity signals
Registry
Cites
Statistics
Figures
Verification
Claims the paper makes
The claims and statistics of this paper haven’t been checked yet.
Run the check — free, no account needed. It reads the open-access text and checks the sources it cites.
Claims other papers make about this one
Each is checked against this paper’s own text: does it say what the citing paper says it does?
The cited source says what the claim attributes to it.
In the citing paper
“Altogether, the weak correlation between body mass and somatic mutation rates after correction for lifespan suggests that the evolution of larger body sizes may have relied on alternative or additional strategies to limit cancer risk, as has been speculated24,42 (Supplementary Note 2).”
From Somatic mutation rates scale with lifespan across mammals (2022) · cites this paper as [42]
Self-check
Percentages, sums and reported differences re-computed from the paper’s own numbers.
The self-check needs the paper’s full text.
Citations
Cites
Wickham, H., Averick, M., Bryan, J., Chang, W., McGowan, L., François, R., Grolemund, G., Hayes, A., Henry, L., Hester, J., et al. (2019) · Journal of Open Source Software · doi:10.21105/joss.01686 · Cited by 22,138
ModelFinder: fast model selection for accurate phylogenetic estimates
Kalyaanamoorthy, S., Minh, B. Q., Wong, T. K. F., von Haeseler, A., & Jermiin, L. S. (2017) · Nature Methods · doi:10.1038/nmeth.4285 · Cited by 18,449
Phylogenies and the Comparative Method
Felsenstein, J. (1985) · The American Naturalist · doi:10.1086/284325 · Cited by 9,793
Enrichr: interactive and collaborative HTML5 gene list enrichment analysis tool
Chen, E. Y., Tan, C. M., Kou, Y., Duan, Q., Wang, Z., Meirelles, G. V., Clark, N. R., & Ma’ayan, A. (2013) · BMC Bioinformatics · doi:10.1186/1471-2105-14-128 · Cited by 7,814
The delayed rise of present-day mammals
Bininda-Emonds, O. R. P., Cardillo, M., Jones, K. E., MacPhee, R. D. E., Beck, R. M. D., Grenyer, R., Price, S. A., Vos, R. A., Gittleman, J. L., & Purvis, A. (2007) · Nature · doi:10.1038/nature05634 · Cited by 2,082
p53 mutant mice that display early ageing-associated phenotypes
Tyner, S. D., Venkatachalam, S., Choi, J., Jones, S., Ghebranious, N., Igelmann, H., Lu, X., Soron, G., Cooper, B., Brayton, C., et al. (2002) · Nature · doi:10.1038/415045a · Cited by 1,459
A high-resolution map of human evolutionary constraint using 29 mammals
Broad Institute Sequencing Platform and Whole Genome Assembly Team, Lindblad-Toh, K., Baylor College of Medicine Human Genome Sequencing Center Sequencing Team, Genome Institute at Washington University, Garber, M., Zuk, O., Lin, M. F., Parker, B. J., Washietl, S., Kheradpour, P., et al. (2011) · Nature · doi:10.1038/nature10530 · Cited by 1,108
Gomes, N. M. V., Ryder, O. A., Houck, M. L., Charter, S. J., Walker, W., Forsyth, N. R., Austad, S. N., Venditti, C., Pagel, M., Shay, J. W., et al. (2011) · Aging Cell · doi:10.1111/j.1474-9726.2011.00718.x · Cited by 464
Assessing the gene space in draft genomes
Parra, G., Bradnam, K., Ning, Z., Keane, T., & Korf, I. (2009) · Nucleic Acids Research · doi:10.1093/nar/gkn916 · Cited by 395
Eastman, J. M., Alfaro, M. E., Joyce, P., Hipp, A. L., & Harmon, L. J. (2011) · Evolution · doi:10.1111/j.1558-5646.2011.01401.x · Cited by 240
Research works printed but not linked: 86
- Abegglen, 2015, Potential mechanisms for Cancer resistance in elephants and comparative cellular response to DNA damage in humans, Jama, 314, 1850, 10.1001/jama.2015.13134 · DOI · Paper page
- Alfaro, 2009, Nine exceptional radiations plus high turnover explain species diversity in jawed vertebrates, PNAS, 106, 13410, 10.1073/pnas.0811087106 · DOI
- Altenhoff, 2009, Phylogenetic and functional assessment of orthologs inference projects and methods, PLOS Computational Biology, 5, 10.1371/journal.pcbi.1000262 · DOI
- Armitage, 1985, Multistage models of carcinogenesis, Environmental Health Perspectives, 63, 195, 10.1289/ehp.8563195 · DOI
- Armitage, 2004, The age distribution of Cancer and a multi-stage theory of carcinogenesis, British Journal of Cancer, 91, 1983, 10.1038/sj.bjc.6602297 · DOI
- Ashur-Fabian, 2004, Evolution of p53 in hypoxia-stressed Spalax mimics human tumor mutation, PNAS, 101, 12236, 10.1073/pnas.0404998101 · DOI
- Bininda-Emonds, 2008, Erratum: the delayed rise of present-day mammals, Nature, 456, 10.1038/nature07347 · DOI
- Boddy, 2020, Lifetime Cancer prevalence and life history traits in mammals, Evolution, Medicine, and Public Health, 2020, 187, 10.1093/emph/eoaa015 · DOI
- Burrows, 2010, Polybromo-associated BRG1-associated factor components BRD7 and BAF180 are critical regulators of p53 required for induction of replicative senescence, PNAS, 107, 14280, 10.1073/pnas.1009559107 · DOI
- Caulin, 2015, Solutions to Peto's paradox revealed by mathematical modelling and cross-species cancer gene analysis, Philosophical Transactions of the Royal Society B: Biological Sciences, 370, 10.1098/rstb.2014.0222 · DOI
- Caulin, 2011, Peto's Paradox: evolution's prescription for cancer prevention, Trends in Ecology & Evolution, 26, 175, 10.1016/j.tree.2011.01.002 · DOI
- Criscuolo, 2010, BMGE (Block mapping and gathering with entropy): a new software for selection of phylogenetic informative regions from multiple sequence alignments, BMC Evolutionary Biology, 10, 10.1186/1471-2148-10-210 · DOI
- Dobson, 2013, Breed-Predispositions to Cancer in pedigree dogs, ISRN Veterinary Science, 2013, 1, 10.1155/2013/941275 · DOI
- Doherty, 2016, Has gene duplication impacted the evolution of eutherian longevity?, Aging Cell, 15, 978, 10.1111/acel.12503 · DOI
- Dorn, 1968, Survey of animal neoplasms in alameda and contra costa counties, California. II. Cancer morbidity in dogs and cats from alameda county, Journal of the National Cancer Institute, 40, 307
- Drost, 2010, BRD7 is a candidate tumour suppressor gene required for p53 function, Nature Cell Biology, 12, 380, 10.1038/ncb2038 · DOI
- Dudchenko, 2017, De novo assembly of the aedes aegypti genome using Hi-C yields chromosome-length scaffolds, Science, 356, 92, 10.1126/science.aal3327 · DOI
- Elliot, 2014, Inferring ancestral states without assuming neutrality or gradualism using a stable model of continuous character evolution, BMC Evolutionary Biology, 14, 10.1186/s12862-014-0226-8 · DOI · Paper page
- Foote, 2015, Convergent evolution of the genomes of marine mammals, Nature Genetics, 47, 272, 10.1038/ng.3198 · DOI
- Francis, 1981, The relationship of DNA excision repair of ultraviolet-induced lesions to the maximum life span of mammals, Mechanisms of Ageing and Development, 16, 181, 10.1016/0047-6374(81)90094-4 · DOI
- Fukuda, 2016, Expression of human cell cycle regulators in the primary cell line of the african savannah elephant (loxodonta africana) increases proliferation until senescence, but does not induce immortalization, In Vitro Cellular & Developmental Biology - Animal, 52, 20, 10.1007/s11626-015-9943-6 · DOI
- García-Cao, 2002, "Super p53" mice exhibit enhanced DNA damage response, are tumor resistant and age normally, The EMBO Journal, 21, 6225, 10.1093/emboj/cdf595 · DOI · Paper page
- Gorbunova, 2012, Cancer resistance in the blind mole rat is mediated by concerted necrotic cell death mechanism, PNAS, 109, 19392, 10.1073/pnas.1217211109 · DOI
- Harmon, 2008, GEIGER: investigating evolutionary radiations, Bioinformatics, 24, 129, 10.1093/bioinformatics/btm538 · DOI
- Hart, 1974, Correlation between deoxyribonucleic acid excision-repair and life-span in a number of mammalian species, PNAS, 71, 2169, 10.1073/pnas.71.6.2169 · DOI · Paper page
- Hoang, 2018, UFBoot2: improving the ultrafast bootstrap approximation, Molecular Biology and Evolution, 35, 518, 10.1093/molbev/msx281 · DOI · Paper page
- Jassal, 2020, The reactome pathway knowledgebase, Nucleic Acids Research, 48, D498, 10.1093/nar/gkz1031 · DOI
- Katoh, 2013, MAFFT multiple sequence alignment software version 7: improvements in performance and usability, Molecular Biology and Evolution, 30, 772, 10.1093/molbev/mst010 · DOI · Paper page
- Katzourakis, 2014, Larger mammalian body size leads to lower retroviral activity, PLOS Pathogens, 10, 10.1371/journal.ppat.1004214 · DOI
- Kent, 2002, BLAT--the BLAST-like alignment tool, Genome Research, 12, 656, 10.1101/gr.229202 · DOI · Paper page
- Kim, 2015, HISAT: a fast spliced aligner with low memory requirements, Nature Methods, 12, 357, 10.1038/nmeth.3317 · DOI · Paper page
- Larramendi, 2015, Shoulder height, body mass, and shape of proboscideans, Acta Palaeontologica Polonica, 61, 10.4202/app.00136.2014 · DOI
- Launonen, 2005, Mutations in the human LKB1/STK11 gene, Human Mutation, 26, 291, 10.1002/humu.20222 · DOI
- Lefort, 2015, FastME 2.0: a comprehensive, accurate, and fast Distance-Based phylogeny inference program, Molecular Biology and Evolution, 32, 2798, 10.1093/molbev/msv150 · DOI
- Lemoine, 2019, Ngphylogeny.fr: new generation phylogenetic services for non-specialists, Nucleic Acids Research, 47, W260, 10.1093/nar/gkz303 · DOI
- Leroi, 2003, Cancer selection, Nature Reviews Cancer, 3, 226, 10.1038/nrc1016 · DOI
- Liang, 2013, AMPK: a contextual oncogene or tumor suppressor?, Cancer Research, 73, 2929, 10.1158/0008-5472.CAN-12-3876 · DOI
- Liao, 2019, WebGestalt 2019: gene set analysis toolkit with revamped UIs and APIs, Nucleic Acids Research, 47, W199, 10.1093/nar/gkz401 · DOI · Paper page
- Lucena, 2011, A retrospective study of 586 tumours in brazilian cattle, Journal of Comparative Pathology, 145, 20, 10.1016/j.jcpa.2010.11.002 · DOI
- Martins, 1997, Phylogenies and the comparative method: a general approach to incorporating phylogenetic information into the analysis of interspecific data, The American Naturalist, 149, 646, 10.1086/286013 · DOI
- Million Women Study collaborators, 2011, Height and Cancer incidence in the million women study: prospective cohort, and meta-analysis of prospective studies of height and total Cancer risk, The Lancet Oncology, 12, 785, 10.1016/S1470-2045(11)70154-1 · DOI
- Minh, 2020, IQ-TREE 2: new models and efficient methods for phylogenetic inference in the genomic era, Molecular Biology and Evolution, 37, 1530, 10.1093/molbev/msaa015 · DOI · Paper page
- Nagy, 2007, Why don't all whales have Cancer? A novel hypothesis resolving Peto's paradox, Integrative and Comparative Biology, 47, 317, 10.1093/icb/icm062 · DOI
- Nishimura, 2017, gVolante for standardizing completeness assessment of genome and transcriptome assemblies, Bioinformatics, 33, 3635, 10.1093/bioinformatics/btx445 · DOI
- Nunney, 1999, Lineage selection and the evolution of multistage carcinogenesis, Proceedings of the Royal Society of London. Series B: Biological Sciences, 266, 493, 10.1098/rspb.1999.0664 · DOI
- Nunney, 2018, Size matters: height, cell number and a person's risk of cancer, Proceedings of the Royal Society B: Biological Sciences, 285, 10.1098/rspb.2018.1743 · DOI
- O Leary, 2013, The placental mammal ancestor and the post-K-Pg radiation of placentals, Science, 339, 662, 10.1126/science.1229237 · DOI
- O Leary, 2013, Response to comment on "The placental mammal ancestor and the post-K-Pg radiation of placentals", Science, 341, 10.1126/science.1238162 · DOI
- Palkopoulou, 2015, Complete genomes reveal signatures of demographic and genetic declines in the woolly mammoth, Current Biology, 25, 1395, 10.1016/j.cub.2015.04.007 · DOI · Paper page
- Palkopoulou, 2018, A comprehensive genomic history of extinct and living elephants, PNAS, 115, E2566, 10.1073/pnas.1720554115 · DOI
- Paradis, 2019, Ape 5.0: an environment for modern phylogenetics and evolutionary analyses in R, Bioinformatics, 35, 526, 10.1093/bioinformatics/bty633 · DOI
- Pennell, 2014, Geiger v2.0: an expanded suite of methods for fitting macroevolutionary models to phylogenetic trees, Bioinformatics, 30, 2216, 10.1093/bioinformatics/btu181 · DOI
- Pertea, 2015, StringTie enables improved reconstruction of a transcriptome from RNA-seq reads, Nature Biotechnology, 33, 290, 10.1038/nbt.3122 · DOI
- Pertea, 2016, Transcript-level expression analysis of RNA-seq experiments with HISAT, StringTie and ballgown, Nature Protocols, 11, 1650, 10.1038/nprot.2016.095 · DOI
- Peto, 1975, Cancer and ageing in mice and men, British Journal of Cancer, 32, 411, 10.1038/bjc.1975.242 · DOI · Paper page
- Peto, 2015, Quantitative implications of the approximate irrelevance of mammalian body size and lifespan to lifelong Cancer risk, Philosophical Transactions of the Royal Society B: Biological Sciences, 370, 10.1098/rstb.2015.0198 · DOI
- Puttick, 2015, Fossils and living taxa agree on patterns of body mass evolution: a case study with afrotheria, Proceedings of the Royal Society B: Biological Sciences, 282, 10.1098/rspb.2015.2023 · DOI
- Qian, 2014, Genomic evidence for adaptation by gene duplication, Genome Research, 24, 1356, 10.1101/gr.172098.114 · DOI
- Rastogi, 2005, Subfunctionalization of duplicated genes as a transition state to neofunctionalization, BMC Evolutionary Biology, 5, 10.1186/1471-2148-5-28 · DOI
- Salichos, 2011, Evaluating ortholog prediction algorithms in a yeast model clade, PLOS ONE, 6, 10.1371/journal.pone.0018755 · DOI
- Savage, 2007, Scaling of number, size, and metabolic rate of cells with body size in mammals, PNAS, 104, 4718, 10.1073/pnas.0611235104 · DOI
- Scheffer, 1972, The weight of the steller sea cow, Journal of Mammalogy, 53, 912, 10.2307/1379236 · DOI
- Schrempf, 2019, Polymorphism-Aware species trees with advanced mutation models, bootstrap, and rate heterogeneity, Molecular Biology and Evolution, 36, 1294, 10.1093/molbev/msz043 · DOI
- Schwartz, 1995, Body-Size diversity and community structure of fossil hyracoids, Journal of Mammalogy, 76, 1088, 10.2307/1382601 · DOI
- Seluanov, 2008, Distinct tumor suppressor mechanisms evolve in rodent species that differ in size and lifespan, Aging Cell, 7, 813, 10.1111/j.1474-9726.2008.00431.x · DOI
- Sievert, 2020, Interactive Web-Based Data Visualization with R, Plotly, and Shiny, 10.1201/9780429447273 · DOI
- Slater, 2012, Fitting models of continuous trait evolution to incompletely sampled comparative data using approximate bayesian computation, Evolution, 66, 752, 10.1111/j.1558-5646.2011.01474.x · DOI
- Soubrier, 2012, The influence of rate heterogeneity among sites on the time dependence of molecular rates, Molecular Biology and Evolution, 29, 3345, 10.1093/molbev/mss140 · DOI
- Springer, 2013, Technical comment on "The placental mammal ancestor and the post-K-Pg radiation of placentals", Science, 341, 613.2, 10.1126/science.1238025 · DOI
- Stoltzfus, 1999, On the possibility of constructive neutral evolution, Journal of Molecular Evolution, 49, 169, 10.1007/PL00006540 · DOI
- Sulak, 2016, TP53 copy number expansion is associated with the evolution of increased body size and an enhanced DNA damage response in elephants, eLife, 5, 10.7554/eLife.11994 · DOI
- Tacutu, 2013, Human ageing genomic resources: integrated databases and tools for the biology and genetics of ageing, Nucleic Acids Research, 41, D1027, 10.1093/nar/gks1155 · DOI
- The UniProt Consortium, 2017, UniProt: the universal protein knowledgebase, Nucleic Acids Research, 45, D158, 10.1093/nar/gkw1099 · DOI · Paper page
- Tian, 2013, High-molecular-mass hyaluronan mediates the Cancer resistance of the naked mole rat, Nature, 499, 346, 10.1038/nature12234 · DOI
- Tollis, 2020, Elephant genomes reveal insights into differences in disease defense mechanisms between species, 10.1101/2020.05.29.124396 · DOI
- Vazquez, 2018, A zombie LIF gene in elephants is upregulated by TP53 to induce apoptosis in response to DNA damage, Cell Reports, 24, 1765, 10.1016/j.celrep.2018.07.042 · DOI
- Vazquez JM, Lynch VJ. 2021. Pervasive duplication of tumor suppressors in Afrotherians during the evolution of large bodies and reduced cancer risk. Software Heritage. swh:1:rev:6bc68ac31ef148131480710e50b0b75d06077db2. https://archive.softwareheritage.org/swh:1:dir:ae8a48052c5d5e4e3757e45dc5d632d07c443e3b;origin=https://github.com/docmanny/atlantogenataGeneDuplication;visit=swh:1:snp:d095eb620de426a079259bc6c9f6e8ebd57daf06;anchor=swh:1:rev:6bc68ac31ef148131480710e50b0b75d06077db2/.
- Wang, 2018, Modeling site heterogeneity with posterior mean site frequency profiles accelerates accurate phylogenomic estimation, Systematic Biology, 67, 216, 10.1093/sysbio/syx068 · DOI · Paper page
- Wang, 2020, Treeio: an R package for phylogenetic tree input and output with richly annotated and associated data, Molecular Biology and Evolution, 37, 599, 10.1093/molbev/msz240 · DOI
- Wickham, 2016, Ggplot2: Elegant Graphics for Data Analysis, 10.1007/978-3-319-24277-4 · DOI
- Xie, 2016, Bookdown: Authoring Books and Technical Documents with R Markdown, 10.1201/9781315204963 · DOI
- Yang, 1995, A new method of inference of ancestral nucleotide and amino acid sequences, Genetics, 141, 1641, 10.1093/genetics/141.4.1641 · DOI
- Yu, 2017, Ggtree : an r package for visualization and annotation of phylogenetic trees with their covariates and other associated data, Methods in Ecology and Evolution, 8, 28, 10.1111/2041-210X.12628 · DOI
- Yu, 2018, Two methods for mapping and visualizing associated data on phylogeny using Ggtree, Molecular Biology and Evolution, 35, 3041, 10.1093/molbev/msy194 · DOI
- Yu G. 2020e. Treeio: Base Classes and Functions for Phylogenetic Tree Input and Output. https://rdrr.io/bioc/treeio/.
- Yu, 2020, Using ggtree to Visualize Data on Tree‐Like Structures, Current Protocols in Bioinformatics, 69, 10.1002/cpbi.96 · DOI
Cited by
Sorted by citations
Somatic mutation rates scale with lifespan across mammals
Cagan, A., Baez-Ortega, A., Brzozowska, N., Abascal, F., Coorens, T. H. H., Sanders, M. A., Lawson, A. R. J., Harvey, L. M. R., Bhosle, S., Jones, D., et al. (2022) · Nature · doi:10.1038/s41586-022-04618-z · Cited by 481
Metadata
- Authors
- Vazquez, J. M., & Lynch, V. J.
- Venue
- eLife
- Publisher
- eLife Sciences Publications, Ltd
- Published
- 2021-01-29
- Volume
- 10
- ISSN
- 2050-084X
- PMC
- PMC7952090
- Cited by
- 61
- References
- 10
- Language
- en
- Licence
- Funders
- University of Chicago
About these checks
Registry, retraction, Cites and statistics results are computed, not judged, with one exception: a printed reference that no index lists is read once by a model before it counts as a citation error. Claims are extracted by a model and kept only when their quote appears verbatim in the text; each cited source is then checked, with a model’s help, for whether it says what the claim relies on. Those verdicts can be wrong — read the claim’s quote and the cited source before relying on one.
Statistics and arithmetic are recomputed, not judged.
Confidence bands are shown only for fields calibrated on our annotated test set. None is calibrated yet, so no band is shown.
What counts as a claim ›How we measure confidence ›How we check this ›
Are you an author, or do you see a problem with this page? Request a review
How to cite
Cite CoChat for the checks on this page, and the paper for its own findings.
- This page
- CoChat. (2026). Citation check: Pervasive duplication of tumor suppressors in Afrotherians during the evolution of large bodies and reduced cancer risk. https://app.cochat.ai/papers/10.7554/elife.65041
- The paper
- Vazquez, J. M., & Lynch, V. J. (2021). Pervasive duplication of tumor suppressors in Afrotherians during the evolution of large bodies and reduced cancer risk. eLife. https://doi.org/10.7554/elife.65041
