

The DOI matches its Crossref record; 111 of the 111 references it cites were found in a registry or an index.
Hidden GPCR structural transitions addressed by multiple walker supervised molecular dynamics (mwSuMD)
Open accessPublished version of a preprint
Abstract
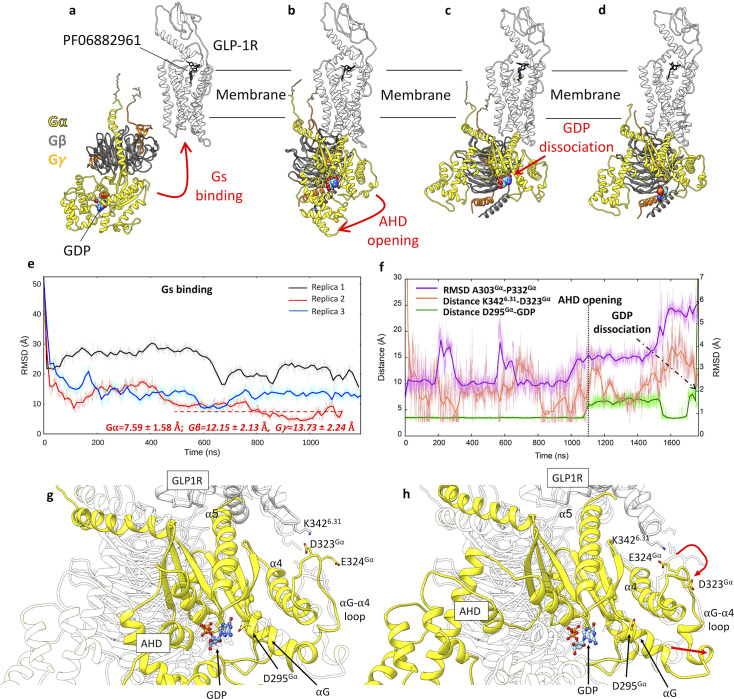
The structural basis for the pharmacology of human G protein-coupled receptors (GPCRs), the most abundant membrane proteins and the target of about 35% of approved drugs, is still a matter of intense study. What makes GPCRs challenging to study is the inherent flexibility and the metastable nature of interaction with extra- and intracellular partners that drive their effects. Here, we present a molecular dynamics (MD) adaptive sampling algorithm, namely multiple walker supervised molecular dynamics (mwSuMD), to address complex structural transitions involving GPCRs without energy input. We first report the binding and unbinding of the vasopressin peptide from its receptor V 2 . Successively, we present the complete transition of the glucagon-like peptide-1 receptor (GLP-1R) from inactive to active, agonist and G s -bound state, and the guanosine diphosphate (GDP) release from G s . To our knowledge, this is the first time the whole sequence of events leading from an inactive GPCR to the GDP release is simulated without any energy bias. We demonstrate that mwSuMD can address complex binding processes intrinsically linked to protein dynamics out of reach of classic MD.
Overview
The claims and statistics of this paper haven’t been checked yet.
Run the check — free, no account needed. It reads the open-access text and checks the sources it cites.
Integrity signals
Registry
Cites
Statistics
Figures
Verification
Claims the paper makes
The claims and statistics of this paper haven’t been checked yet.
Run the check — free, no account needed. It reads the open-access text and checks the sources it cites.
Self-check
Percentages, sums and reported differences re-computed from the paper’s own numbers.
The self-check needs the paper’s full text.
Citations
Cites
VMD: visual molecular dynamics
Humphrey, W., Dalke, A., & Schulten, K. (1996) · Journal of Molecular Graphics · doi:10.1016/0263-7855(96)00018-5 · Cited by 66,952
UCSF Chimera—A visualization system for exploratory research and analysis
Pettersen, E. F., Goddard, T. D., Huang, C. C., Couch, G. S., Greenblatt, D. M., Meng, E. C., & Ferrin, T. E. (2004) · Journal of Computational Chemistry · doi:10.1002/jcc.20084 · Cited by 45,828
Highly accurate protein structure prediction with AlphaFold
Jumper, J., Evans, R., Pritzel, A., Green, T., Figurnov, M., Ronneberger, O., Tunyasuvunakool, K., Bates, R., Žídek, A., Potapenko, A., et al. (2021) · Nature · doi:10.1038/s41586-021-03819-2 · Cited by 43,764
Comparison of simple potential functions for simulating liquid water
Jorgensen, W. L., Chandrasekhar, J., Madura, J. D., Impey, R. W., & Klein, M. L. (1983) · The Journal of Chemical Physics · doi:10.1063/1.445869 · Cited by 41,298
Berman, H. M. (2000) · Nucleic Acids Research · doi:10.1093/nar/28.1.235 · Cited by 40,196
Molecular dynamics with coupling to an external bath
Berendsen, H. J. C., Postma, J. P. M., van Gunsteren, W. F., DiNola, A., & Haak, J. R. (1984) · The Journal of Chemical Physics · doi:10.1063/1.448118 · Cited by 30,700
A smooth particle mesh Ewald method
Essmann, U., Perera, L., Berkowitz, M. L., Darden, T., Lee, H., & Pedersen, L. G. (1995) · The Journal of Chemical Physics · doi:10.1063/1.470117 · Cited by 22,514
Scalable molecular dynamics with NAMD
Phillips, J. C., Braun, R., Wang, W., Gumbart, J., Tajkhorshid, E., Villa, E., Chipot, C., Skeel, R. D., Kalé, L., & Schulten, K. (2005) · Journal of Computational Chemistry · doi:10.1002/jcc.20289 · Cited by 16,914
GROMACS: A message-passing parallel molecular dynamics implementation
Berendsen, H. J. C., van der Spoel, D., & van Drunen, R. (1995) · Computer Physics Communications · doi:10.1016/0010-4655(95)00042-e · Cited by 10,488
CHARMM‐GUI: A web‐based graphical user interface for CHARMM
Jo, S., Kim, T., Iyer, V. G., & Im, W. (2008) · Journal of Computational Chemistry · doi:10.1002/jcc.20945 · Cited by 9,284
CHARMM36m: an improved force field for folded and intrinsically disordered proteins
Huang, J., Rauscher, S., Nawrocki, G., Ran, T., Feig, M., de Groot, B. L., Grubmüller, H., & MacKerell, A. D. (2016) · Nature Methods · doi:10.1038/nmeth.4067 · Cited by 7,334
MDAnalysis: A toolkit for the analysis of molecular dynamics simulations
Michaud‐Agrawal, N., Denning, E. J., Woolf, T. B., & Beckstein, O. (2011) · Journal of Computational Chemistry · doi:10.1002/jcc.21787 · Cited by 4,694
MMPBSA.py : An Efficient Program for End-State Free Energy Calculations
Miller, B. R., McGee, T. D., Swails, J., Homeyer, N., Gohlke, H., & Roitberg, A. E. (2012) · Journal of Chemical Theory and Computation · doi:10.1021/ct300418h · Cited by 4,664
CHARMM36 all-atom additive protein force field: Validation based on comparison to NMR data
Huang, J., & MacKerell, A. D. (2013) · Journal of Computational Chemistry · doi:10.1002/jcc.23354 · Cited by 4,554
Replica-exchange molecular dynamics method for protein folding
Sugita, Y., & Okamoto, Y. (1999) · Chemical Physics Letters · doi:10.1016/s0009-2614(99)01123-9 · Cited by 4,499
PROPKA3: Consistent Treatment of Internal and Surface Residues in Empirical p K a Predictions
Olsson, M. H. M., Søndergaard, C. R., Rostkowski, M., & Jensen, J. H. (2011) · Journal of Chemical Theory and Computation · doi:10.1021/ct100578z · Cited by 4,425
Molecular Dynamics Simulation for All
Hollingsworth, S. A., & Dror, R. O. (2018) · Neuron · doi:10.1016/j.neuron.2018.08.011 · Cited by 3,576
PDB2PQR: an automated pipeline for the setup of Poisson-Boltzmann electrostatics calculations
Dolinsky, T. J., Nielsen, J. E., McCammon, J. A., & Baker, N. (2004) · Nucleic Acids Research · doi:10.1093/nar/gkh381 · Cited by 3,517
Crystal structure of the β2 adrenergic receptor–Gs protein complex
Rasmussen, S. G. F., DeVree, B. T., Zou, Y., Kruse, A. C., Chung, K. Y., Kobilka, T. S., Thian, F. S., Chae, P. S., Pardon, E., Calinski, D., et al. (2011) · Nature · doi:10.1038/nature10361 · Cited by 3,009
Ballesteros, J. A., & Weinstein, H. (1995) · Methods in neurosciences · doi:10.1016/s1043-9471(05)80049-7 · Cited by 3,001
OpenMM 7: Rapid development of high performance algorithms for molecular dynamics
Eastman, P., Swails, J., Chodera, J. D., McGibbon, R. T., Zhao, Y., Beauchamp, K. A., Wang, L.-P., Simmonett, A. C., Harrigan, M. P., Stern, C. D., et al. (2017) · PLOS Computational Biology · doi:10.1371/journal.pcbi.1005659 · Cited by 2,748
Wang, E., Sun, H., Wang, J., Wang, Z., Liu, H., Zhang, J. Z. H., & Hou, T. (2019) · Chemical Reviews · doi:10.1021/acs.chemrev.9b00055 · Cited by 2,376
MDTraj: A Modern Open Library for the Analysis of Molecular Dynamics Trajectories
McGibbon, R. T., Beauchamp, K. A., Harrigan, M. P., Klein, C., Swails, J. M., Hernández, C. X., Schwantes, C. R., Wang, L.-P., Lane, T. J., & Pande, V. S. (2015) · Biophysical Journal · doi:10.1016/j.bpj.2015.08.015 · Cited by 2,373
Automation of the CHARMM General Force Field (CGenFF) I: Bond Perception and Atom Typing
Vanommeslaeghe, K., & MacKerell, A. D. (2012) · Journal of Chemical Information and Modeling · doi:10.1021/ci300363c · Cited by 2,208
Vanommeslaeghe, K., Raman, E. P., & MacKerell, A. D. (2012) · Journal of Chemical Information and Modeling · doi:10.1021/ci3003649 · Cited by 1,784
Modeller: Generation and Refinement of Homology-Based Protein Structure Models
Fiser, A., & Šali, A. (2003) · Methods in enzymology on CD-ROM/Methods in enzymology · doi:10.1016/s0076-6879(03)74020-8 · Cited by 1,708
Accelerated molecular dynamics: A promising and efficient simulation method for biomolecules
Hamelberg, D., Mongan, J., & McCammon, J. A. (2004) · The Journal of Chemical Physics · doi:10.1063/1.1755656 · Cited by 1,536
Molecular dynamics simulations and drug discovery
Durrant, J. D., & McCammon, J. A. (2011) · BMC Biology · doi:10.1186/1741-7007-9-71 · Cited by 1,493
G Protein-Coupled Receptors as Targets for Approved Drugs: How Many Targets and How Many Drugs?
Sriram, K., & Insel, P. A. (2018) · Molecular Pharmacology · doi:10.1124/mol.117.111062 · Cited by 1,258
Loncharich, R. J., Brooks, B. R., & Pastor, R. W. (1992) · Biopolymers · doi:10.1002/bip.360320508 · Cited by 1,197
OPM: Orientations of Proteins in Membranes database
Lomize, M. A., Lomize, A. L., Pogozheva, I. D., & Mosberg, H. I. (2006) · Bioinformatics · doi:10.1093/bioinformatics/btk023 · Cited by 1,180
GPCRdb: an information system for G protein-coupled receptors
Ísberg, V., Mordalski, S., Munk, C., Rataj, K., Harpsøe, K., Hauser, A. S., Vroling, B., Bojarski, A. J., Vriend, G., & Gloriam, D. E. I. (2015) · Nucleic Acids Research · doi:10.1093/nar/gkv1178 · Cited by 1,082
ACEMD: Accelerating Biomolecular Dynamics in the Microsecond Time Scale
Harvey, M. J., Giupponi, G., & Fabritiis, G. D. (2009) · Journal of Chemical Theory and Computation · doi:10.1021/ct9000685 · Cited by 918
Markov State Models: From an Art to a Science
Husic, B. E., & Pande, V. S. (2018) · Journal of the American Chemical Society · doi:10.1021/jacs.7b12191 · Cited by 898
Gaussian Accelerated Molecular Dynamics: Unconstrained Enhanced Sampling and Free Energy Calculation
Miao, Y., Feher, V. A., & McCammon, J. A. (2015) · Journal of Chemical Theory and Computation · doi:10.1021/acs.jctc.5b00436 · Cited by 867
Yu, W.-B., He, X., Vanommeslaeghe, K., & MacKerell, A. D. (2012) · Journal of Computational Chemistry · doi:10.1002/jcc.23067 · Cited by 846
Using metadynamics to explore complex free-energy landscapes
Bussi, G., & Laio, A. (2020) · Nature Reviews Physics · doi:10.1038/s42254-020-0153-0 · Cited by 732
Rapid parameterization of small molecules using the force field toolkit
Mayne, C. G., Saam, J., Schulten, K. J., Tajkhorshid, E., & Gumbart, J. C. (2013) · Journal of Computational Chemistry · doi:10.1002/jcc.23422 · Cited by 518
Adrenaline-activated structure of β2-adrenoceptor stabilized by an engineered nanobody
Ring, A. M., Manglik, A., Kruse, A. C., Enos, M. D., Weis, W. I., García, K. C., & Kobilka, B. K. (2013) · Nature · doi:10.1038/nature12572 · Cited by 500
Regulation, signaling, and physiological functions of G-Proteins
Syrovatkina, V., Alegre, K. O., Dey, R., & Huang, X.-Y. (2016) · Journal of Molecular Biology · doi:10.1016/j.jmb.2016.08.002 · Cited by 498
Selectivity determinants of GPCR–G-protein binding
Flock, T., Hauser, A. S., Lund, N., Gloriam, D. E., Balaji, S., & Babu, M. M. (2017) · Nature · doi:10.1038/nature22070 · Cited by 384
Universal allosteric mechanism for Gα activation by GPCRs
Flock, T., Ravarani, C. N. J., Sun, D., Venkatakrishnan, A., Kayikci, M., Tate, C. G., Veprintsev, D. B., & Babu, M. M. (2015) · Nature · doi:10.1038/nature14663 · Cited by 364
The GRAFS classification system of G-protein coupled receptors in comparative perspective
Schiöth, H. B., & Fredriksson, R. (2005) · General and Comparative Endocrinology · doi:10.1016/j.ygcen.2004.12.018 · Cited by 351
Lipid modifications of G proteins: alpha subunits are palmitoylated.
Linder, M. E., Middleton, P., Hepler, J. R., Taussig, R., Gilman, A. G., & Mumby, S. M. (1993) · Proceedings of the National Academy of Sciences · doi:10.1073/pnas.90.8.3675 · Cited by 349
Single-molecule analysis of ligand efficacy in β2AR–G-protein activation
Gregorio, G. G., Masureel, M., Hilger, D., Terry, D. S., Juette, M. F., Zhao, H. C., Zhou, Z., Perez‐Aguilar, J. M., Hauge, M., Mathiasen, S., et al. (2017) · Nature · doi:10.1038/nature22354 · Cited by 347
Birnbaumer, M. (2000) · Trends in Endocrinology and Metabolism · doi:10.1016/s1043-2760(00)00304-0 · Cited by 343
Weighted Ensemble Simulation: Review of Methodology, Applications, and Software
Zuckerman, D. M., & Chong, L. T. (2017) · Annual Review of Biophysics · doi:10.1146/annurev-biophys-070816-033834 · Cited by 341
Structural basis for nucleotide exchange in heterotrimeric G proteins
Dror, R. O., Mildorf, T. J., Hilger, D., Manglik, A., Borhani, D. W., Arlow, D. H., Philippsen, A., Villanueva, N., Yang, Z., Lerch, M. T., et al. (2015) · Science · doi:10.1126/science.aaa5264 · Cited by 285
Wootten, D. L., Simms, J., Miller, L. J., Christopoulos, A., & Sexton, P. M. (2013) · Proceedings of the National Academy of Sciences · doi:10.1073/pnas.1221585110 · Cited by 255
Differential GLP-1R Binding and Activation by Peptide and Non-peptide Agonists
Zhang, X., Belousoff, M. J., Zhao, P., Kooistra, A. J., Truong, T. T., Ang, S. Y., Underwood, C. R., Egebjerg, T., Šenel, P., Stewart, G. D., et al. (2020) · Molecular Cell · doi:10.1016/j.molcel.2020.09.020 · Cited by 233
Structural basis for GLP-1 receptor activation by LY3502970, an orally active nonpeptide agonist
Kawai, T., Sun, B., Yoshino, H., Feng, D., Suzuki, Y., Fukazawa, M., Nagao, S., Wainscott, D. B., Showalter, A. D., Droz, B. A., et al. (2020) · Proceedings of the National Academy of Sciences · doi:10.1073/pnas.2014879117 · Cited by 231
The IUPHAR/BPS Guide to PHARMACOLOGY in 2024
Harding, S. D., Armstrong, J. F., Faccenda, E., Southan, C., Alexander, S. P. H., Davenport, A. P., Spedding, M., & Davies, J. A. (2024) · Nucleic Acids Research · doi:10.1093/nar/gkad944 · Cited by 226
Assembly of a GPCR-G Protein Complex
Du, Y., Duc, N. M., Rasmussen, S. G. F., Hilger, D., Kubiak, X., Wang, L., Bohon, J., Kim, H. R., Wegrecki, M., Asuru, A., et al. (2019) · Cell · doi:10.1016/j.cell.2019.04.022 · Cited by 216
Woods, R. J., & Chappelle, R. (2000) · Journal of Molecular Structure THEOCHEM · doi:10.1016/s0166-1280(00)00487-5 · Cited by 211
Dynamic Docking: A Paradigm Shift in Computational Drug Discovery
Gioia, D., Bertazzo, M., Recanatini, M., Masetti, M., & Cavalli, A. (2017) · Molecules · doi:10.3390/molecules22112029 · Cited by 208
de Mendoza, A., Sebé-Pedrós, A., & Ruiz‐Trillo, I. (2014) · Genome Biology and Evolution · doi:10.1093/gbe/evu038 · Cited by 202
Activation of the GLP-1 receptor by a non-peptidic agonist
Zhao, P., Liang, Y.-L., Belousoff, M. J., Deganutti, G., Fletcher, M. M., Willard, F. S., Bell, M. G., Christe, M. E., Sloop, K. W., Inoue, A., et al. (2020) · Nature · doi:10.1038/s41586-019-1902-z · Cited by 176
Self-citationStructural Insights into the Process of GPCR-G Protein Complex Formation
Liu, X., Xu, X., Hilger, D., Aschauer, P., Tiemann, J. K. S., Du, Y., Liu, H., Hirata, K., Sun, X., Guixà-González, R., et al. (2019) · Cell · doi:10.1016/j.cell.2019.04.021 · Cited by 166
Sabbadin, D., & Moro, S. (2014) · Journal of Chemical Information and Modeling · doi:10.1021/ci400766b · Cited by 158
Self-citationTan, L., Yan, W., McCorvy, J. D., & Cheng, J. (2018) · Journal of Medicinal Chemistry · doi:10.1021/acs.jmedchem.8b00435 · Cited by 147
Full-length human GLP-1 receptor structure without orthosteric ligands
Wu, F., Yang, L., Hang, K., Laursen, M., Wu, L., Han, G. W., Ren, Q., Roed, N. K., Lin, G., Hanson, M. A., et al. (2020) · Nature Communications · doi:10.1038/s41467-020-14934-5 · Cited by 140
Docking small ligands in flexible binding sites
Apostolakis, J., Plückthun, A., & Caflisch, A. (1998) · Journal of Computational Chemistry · doi:10.1002/(sici)1096-987x(19980115)19:1 · Cited by 132
Mechanism of the G-protein mimetic nanobody binding to a muscarinic G-protein-coupled receptor
Miao, Y., & McCammon, J. A. (2018) · Proceedings of the National Academy of Sciences · doi:10.1073/pnas.1800756115 · Cited by 126
Rules of Engagement: GPCRs and G Proteins
Glukhova, A., Draper-Joyce, C. J., Sunahara, R. K., Christopoulos, A., Wootten, D. L., & Sexton, P. M. (2018) · ACS Pharmacology & Translational Science · doi:10.1021/acsptsci.8b00026 · Cited by 123
Vasopressin and disorders of water balance: the physiology and pathophysiology of vasopressin
Ball, S. G. (2007) · Annals of Clinical Biochemistry: International Journal of Laboratory Medicine · doi:10.1258/000456307781646030 · Cited by 110
WExplore: Hierarchical Exploration of High-Dimensional Spaces Using the Weighted Ensemble Algorithm
Dickson, A., & Brooks, C. L. (2014) · The Journal of Physical Chemistry B · doi:10.1021/jp411479c · Cited by 102
Cuzzolin, A., Sturlese, M., Deganutti, G., Salmaso, V., Sabbadin, D., Ciancetta, A., & Moro, S. (2016) · Journal of Chemical Information and Modeling · doi:10.1021/acs.jcim.5b00702 · Cited by 98
Self-citationMolecular insights into ago-allosteric modulation of the human glucagon-like peptide-1 receptor
Cong, Z., Chen, L.-N., Ma, H., Zhou, Q., Zou, X., Ye, C., Dai, A., Liu, Q., Huang, W., Sun, X., et al. (2021) · Nature Communications · doi:10.1038/s41467-021-24058-z · Cited by 98
Dynamics of GLP-1R peptide agonist engagement are correlated with kinetics of G protein activation
Deganutti, G., Liang, Y.-L., Zhang, X., Khoshouei, M., Clydesdale, L., Belousoff, M. J., Venugopal, H., Truong, T. T., Glukhova, A., Keller, A. N., et al. (2022) · Nature Communications · doi:10.1038/s41467-021-27760-0 · Cited by 95
Self-citationThe pathway of ligand entry from the membrane bilayer to a lipid G protein-coupled receptor
Stanley, N., Pardo, L., & Fabritiis, G. D. (2016) · Scientific Reports · doi:10.1038/srep22639 · Cited by 94
Liang, Y.-L., Belousoff, M. J., Fletcher, M. M., Zhang, X., Khoshouei, M., Deganutti, G., Koole, C., Furness, S. G. B., Miller, L. J., Hay, D. L., et al. (2020) · ACS Pharmacology & Translational Science · doi:10.1021/acsptsci.9b00080 · Cited by 90
Self-citationEnergy Landscapes Reveal Agonist Control of G Protein-Coupled Receptor Activation via Microswitches
Fleetwood, O., Matricon, P. G., Carlsson, J., & Delemotte, L. (2020) · Biochemistry · doi:10.1021/acs.biochem.9b00842 · Cited by 87
Evolving cryo-EM structural approaches for GPCR drug discovery
Zhang, X., Johnson, R. M., Drulyte, I., Yu, L., Kotecha, A., Danev, R., Wootten, D. L., Sexton, P. M., & Belousoff, M. J. (2021) · Structure · doi:10.1016/j.str.2021.04.008 · Cited by 81
MEMBRANE PACKING PROBLEMS: A SHORT REVIEW ON COMPUTATIONAL MEMBRANE MODELING METHODS AND TOOLS
Sommer, B. (2013) · Computational and Structural Biotechnology Journal · doi:10.5936/csbj.201302014 · Cited by 80
Molecular Signature for Receptor Engagement in the Metabolic Peptide Hormone Amylin
Bower, R. L., Yule, L. R., Rees, T. A., Deganutti, G., Hendrikse, E. R., Harris, P. W. R., Kowalczyk, R., Ridgway, Z. M., Wong, A. G., Swierkula, K., et al. (2018) · ACS Pharmacology & Translational Science · doi:10.1021/acsptsci.8b00002 · Cited by 80
Self-citationStructural perspective of class B1 GPCR signaling
Cong, Z., Liang, Y.-L., Zhou, Q., Darbalaei, S., Zhao, F., Feng, W., Zhao, L., Xu, H. E., Yang, D., & Wang, M. (2022) · Trends in Pharmacological Sciences · doi:10.1016/j.tips.2022.01.002 · Cited by 78
A combined activation mechanism for the glucagon receptor
Mattedi, G., Acosta‐Gutiérrez, S., Clark, T., & Gervasio, F. L. (2020) · Proceedings of the National Academy of Sciences · doi:10.1073/pnas.1921851117 · Cited by 77
Guo, D. M., Heitman, L. H., & IJzerman, A. P. (2016) · Chemical Reviews · doi:10.1021/acs.chemrev.6b00025 · Cited by 74
Exploring Protein-Peptide Recognition Pathways Using a Supervised Molecular Dynamics Approach
Salmaso, V., Sturlese, M., Cuzzolin, A., & Moro, S. (2017) · Structure · doi:10.1016/j.str.2017.02.009 · Cited by 71
Self-citationWootten, D. L., Reynolds, C. A., Koole, C., Smith, K. J., Mobarec, J. C., Simms, J., Quon, T., Coudrat, T., Furness, S. G. B., Miller, L. J., et al. (2015) · Molecular Pharmacology · doi:10.1124/mol.115.101246 · Cited by 66
Self-citationSupervised molecular dynamics for exploring the druggability of the SARS-CoV-2 spike protein
Deganutti, G., Prischi, F., & Reynolds, C. A. (2020) · Journal of Computer-Aided Molecular Design · doi:10.1007/s10822-020-00356-4 · Cited by 63
Self-citationWall, M. J., Hill, E., Huckstepp, R. T. R., Barkan, K., Deganutti, G., Leuenberger, M., Preti, B., Winfield, I. J., Carvalho, S., Suchankova, A., et al. (2022) · Nature Communications · doi:10.1038/s41467-022-31652-2 · Cited by 62
Self-citationStructural insights into the activation of GLP-1R by a small molecule agonist
Ma, H., Huang, W., Wang, X., Zhao, L., Jiang, Y., Liu, F., Guo, W., Sun, X., Zhong, W., Yuan, D., et al. (2020) · Cell Research · doi:10.1038/s41422-020-0384-8 · Cited by 61
Structure and dynamics of the active Gs-coupled human secretin receptor
Dong, M., Deganutti, G., Piper, S. J., Liang, Y.-L., Khoshouei, M., Belousoff, M. J., Harikumar, K. G., Reynolds, C. A., Glukhova, A., Furness, S. G. B., et al. (2020) · Nature Communications · doi:10.1038/s41467-020-17791-4 · Cited by 60
Self-citationStructural and functional diversity among agonist-bound states of the GLP-1 receptor
Cary, B. P., Deganutti, G., Zhao, P., Truong, T. T., Piper, S. J., Liu, X., Belousoff, M. J., Danev, R., Sexton, P. M., Wootten, D. L., et al. (2021) · Nature Chemical Biology · doi:10.1038/s41589-021-00945-w · Cited by 59
Self-citationMolecular basis of ligand recognition and activation of human V2 vasopressin receptor
Zhou, F., Ye, C., Ma, X., Yin, W., Croll, T. I., Zhou, Q., He, X., Zhang, X., Yang, D., Wang, P., et al. (2021) · Cell Research · doi:10.1038/s41422-021-00480-2 · Cited by 58
Simulation of spontaneous G protein activation reveals a new intermediate driving GDP unbinding
Sun, X., Singh, S., Blumer, K., & Bowman, G. R. (2018) · eLife · doi:10.7554/elife.38465 · Cited by 57
Kokh, D. B., Kaufmann, T. L., Kister, B., & Wade, R. C. (2019) · Frontiers in Molecular Biosciences · doi:10.3389/fmolb.2019.00036 · Cited by 54
The Role of Target Binding Kinetics in Drug Discovery
Guo, D. M., Heitman, L. H., & IJzerman, A. P. (2015) · ChemMedChem · doi:10.1002/cmdc.201500310 · Cited by 53
Simulations meet machine learning in structural biology
Pérez, A., Martínez-Rosell, G., & Fabritiis, G. D. (2018) · Current Opinion in Structural Biology · doi:10.1016/j.sbi.2018.02.004 · Cited by 51
Cong, Z., Zhou, Q., Li, Y., Chen, L.-N., Zhang, Z.-C., Liang, A., Liu, Q., Wu, X., Dai, A., Xia, T., et al. (2022) · Proceedings of the National Academy of Sciences · doi:10.1073/pnas.2200155119 · Cited by 43
How a G Protein Binds a Membrane
Zhang, Z., Melia, T. J., He, F., Yuan, C., McGough, A. M., Schmid, M. F., & Wensel, T. G. (2004) · Journal of Biological Chemistry · doi:10.1074/jbc.m403404200 · Cited by 39
Mechanistic insights into G-protein coupling with an agonist-bound G-protein-coupled receptor
Batebi, H., Pérez-Hernández, G., Rahman, S. N., Lan, B., Kamprad, A., Shi, M., Speck, D., Tiemann, J. K. S., Guixà-González, R., Reinhardt, F., et al. (2024) · Nature Structural & Molecular Biology · doi:10.1038/s41594-024-01334-2 · Cited by 38
A Supervised Molecular Dynamics Approach to Unbiased Ligand–Protein Unbinding
Deganutti, G., Moro, S., & Reynolds, C. A. (2020) · Journal of Chemical Information and Modeling · doi:10.1021/acs.jcim.9b01094 · Cited by 36
Self-citationKaya, A. İ., Lokits, A. D., Gilbert, J. A., Iverson, T. M., Meiler, J., & Hamm, H. E. (2016) · Journal of Biological Chemistry · doi:10.1074/jbc.m116.745513 · Cited by 34
Lovera, S., Cuzzolin, A., Kelm, S., Fabritiis, G. D., & Sands, Z. A. (2019) · Scientific Reports · doi:10.1038/s41598-019-50752-6 · Cited by 34
Estimation of Kinetic and Thermodynamic Ligand-Binding Parameters Using Computational Strategies
Deganutti, G., & Moro, S. (2017) · Future Medicinal Chemistry · doi:10.4155/fmc-2016-0224 · Cited by 32
Self-citationThe full activation mechanism of the adenosine A 1 receptor revealed by GaMD and Su-GaMD simulations
Li, Y., Sun, J., Li, D., & Lin, J. (2022) · Proceedings of the National Academy of Sciences · doi:10.1073/pnas.2203702119 · Cited by 32
Bokoch, M. P., Jo, H., Valcourt, J. R., Srinivasan, Y., Pan, A. C., Capponi, S., Grabe, M., Dror, R. O., Shaw, D. E., DeGrado, W. F., et al. (2018) · Biochemistry · doi:10.1021/acs.biochem.8b00577 · Cited by 31
The dynamics of agonist-β2-adrenergic receptor activation induced by binding of GDP-bound Gs protein
Mafi, A., Kim, S., & Goddard, W. A. (2023) · Nature Chemistry · doi:10.1038/s41557-023-01238-6 · Cited by 28
D’Amore, V. M., Conflitti, P., Marinelli, L., & Limongelli, V. (2024) · Chem · doi:10.1016/j.chempr.2024.08.004 · Cited by 27
Kinetic model of GPCR-G protein interactions reveals allokairic modulation of signaling
Culhane, K. J., Gupte, T. M., Madhugiri, I., Gadgil, C. J., & Sivaramakrishnan, S. (2022) · Nature Communications · doi:10.1038/s41467-022-28789-5 · Cited by 26
Conformational switch that induces GDP release from Gi
Ham, D., Ahn, D., Ashim, J., Cho, Y., Kim, H. R., Yu, W., & Chung, K. Y. (2021) · Journal of Structural Biology · doi:10.1016/j.jsb.2020.107694 · Cited by 24
Yuan, S., Xia, L., Wang, C., Wu, F., Zhang, B., Pan, C., Fan, Z., Lei, X., Stevens, R. C., Šali, A., et al. (2023) · ACS Central Science · doi:10.1021/acscentsci.3c00063 · Cited by 21
Ortíz, A. P. D. A., Vreede, J., & Ensing, B. (2019) · Methods in molecular biology · doi:10.1007/978-1-4939-9608-7_11 · Cited by 19
Deciphering the Agonist Binding Mechanism to the Adenosine A1 Receptor
Deganutti, G., Barkan, K., Preti, B., Leuenberger, M., Wall, M. J., Frenguelli, B. G., Lochner, M., Ladds, G., & Reynolds, C. A. (2021) · ACS Pharmacology & Translational Science · doi:10.1021/acsptsci.0c00195 · Cited by 19
Self-citationGγ and Gα Identity Dictate a G-Protein Heterotrimer Plasma Membrane Targeting
Mystek, P., Rysiewicz, B., Gregrowicz, J., Dziedzicka‐Wasylewska, M., & Polit, A. (2019) · Cells · doi:10.3390/cells8101246 · Cited by 18
Multisite Model of Allosterism for the Adenosine A1 Receptor
Deganutti, G., Barkan, K., Ladds, G., & Reynolds, C. A. (2021) · Journal of Chemical Information and Modeling · doi:10.1021/acs.jcim.0c01331 · Cited by 18
Self-citationAddressing free fatty acid receptor 1 (FFAR1) activation using supervised molecular dynamics
Atanasio, S., Deganutti, G., & Reynolds, C. A. (2020) · Journal of Computer-Aided Molecular Design · doi:10.1007/s10822-020-00338-6 · Cited by 17
Self-citationNew dimension indices for the characterization of the solvent-accessible surface
Torrens, F., S�nchez-Mar�n, J., & Nebot‐Gil, I. (2001) · Journal of Computational Chemistry · doi:10.1002/1096-987x(20010415)22:5 · Cited by 16
Exploring Ligand Binding to Calcitonin Gene-Related Peptide Receptors
Deganutti, G., Atanasio, S., Rujan, R., Sexton, P. M., Wootten, D. L., & Reynolds, C. A. (2021) · Frontiers in Molecular Biosciences · doi:10.3389/fmolb.2021.720561 · Cited by 14
Self-citation
Research works printed but not linked: 1
- Pipitò L. 2025. mwSuMD - Molecular Dynamics Supervision Tool. Software Heritage. swh:1:rev:b5cd2dacea7b003df96ee88a34919d87b937b744. https://archive.softwareheritage.org/swh:1:dir:3a780e7322852c01cf6ca71a61a2b161b5ccda6c;origin=https://github.com/pipitoludovico/mwSuMD_multiEngine;visit=swh:1:snp:17cec8ea7b03cfd8e5c4cfddc542c49b3796d350;anchor=swh:1:rev:b5cd2dacea7b003df96ee88a34919d87b937b744.
Metadata
- Authors
- Deganutti, G., Pipito, L., Rujan, R. M., Weizmann, T., Griffin, P., Ciancetta, A., Moro, S., & Reynolds, C. A.
- Affiliations
- Coventry University (GB)
- Centre for Health and Life Sciences, Coventry University
- University of Ferrara (IT)
- University of Padua (IT)
- University of Essex (GB)
- Corresponding author
- Deganutti, Giuseppe
- Reynolds, Christopher Arthur
- ORCID
- Venue
- eLife
- Publisher
- eLife Sciences Publications, Ltd
- Published
- 2025-04-30
- Volume
- 13
- ISSN
- 2050-084X (ISSN-L)
- PMC
- PMC12043319
- OpenAlex
- W4396889854
- Cited by
- 7
- References
- 111
- Citations by year
- 2026: 4 · 2025: 3
- Type
- posted content
- Language
- en
- Open access
- gold
- doi.org
- Licence
- Locations
- eLife (publishedVersion, cc-by)
- PubMed Central (publishedVersion, cc-by)
- PubMed (publishedVersion)
- Pure (Coventry University) (publishedVersion, cc-by)
- DOAJ (DOAJ: Directory of Open Access Journals) (submittedVersion, cc-by-sa)
- Funders
- Biotechnology and Biological Sciences Research Council (BB/W016974/1)
- Diabetes UK (BDA 20/0006307)
- Topics
- Life Sciences › Biochemistry, Genetics and Molecular Biology › Molecular Biology › Receptor Mechanisms and Signaling
- Life Sciences › Biochemistry, Genetics and Molecular Biology › Molecular Biology › Protein Structure and Dynamics
- Life Sciences › Pharmacology, Toxicology and Pharmaceutics › Drug Discovery › Computational Drug Discovery Methods
- Keywords
- G protein-coupled receptors, adaptive sampling, structural phase transition, V2 receptor, GLP-1 receptor, receptor activation, Gs protein, GDP release, receptor-G protein coupling, metastable states
- MeSH terms
- Glucagon-Like Peptide-1 Receptor, Algorithms, Humans, Protein Binding, Protein Conformation, Vasopressins, Receptors, Vasopressin, Receptors, G-Protein-Coupled, Molecular Dynamics Simulation
About these checks
Registry, retraction, Cites and statistics results are computed, not judged, with one exception: a printed reference that no index lists is read once by a model before it counts as a citation error. Claims are extracted by a model and kept only when their quote appears verbatim in the text; each cited source is then checked, with a model’s help, for whether it says what the claim relies on. Those verdicts can be wrong — read the claim’s quote and the cited source before relying on one.
Statistics and arithmetic are recomputed, not judged.
Confidence bands are shown only for fields calibrated on our annotated test set. None is calibrated yet, so no band is shown.
What counts as a claim ›How we measure confidence ›How we check this ›
Are you an author, or do you see a problem with this page? Request a review
Data sources
Bibliographic data: Semantic Scholar, OpenAlex, Crossref.
Contains information from the Semantic Scholar Academic Graph Datasets, made available under the ODC Attribution License (ODC-BY 1.0).
Semantic Scholar’s data is described in: Kinney, R., et al. (2023). The Semantic Scholar Open Data Platform. arXiv:2301.10140.
