Cited by 6RNA Interference and Gene DeliveryChromosomal and Genetic VariationsEpigenetics and DNA Methylation

The DOI matches its Crossref record; 117 of the 117 references it cites were found in a registry or an index.

Intergenerational transport of double-stranded RNA in C. elegans can limit heritable epigenetic changes

Open access
Shugarts Devanapally, Nathan M, Sathya, Aishwarya, Yi, Andrew L, Chan, Winnie M, Marre, Julia A, Jose, Antony M·2025·eLife

Published version of a preprint

Abstract

RNAs in circulation carry sequence-specific regulatory information between cells in plant, animal, and host-pathogen systems. Such RNA can cross generational boundaries, as evidenced by somatic double-stranded RNA (dsRNA) in the nematode Caenorhabditis elegans silencing genes of matching sequence in progeny. Here we dissect the intergenerational path taken by dsRNA from parental circulation and discover that cytosolic import through the dsRNA importer SID-1 in the parental germline and/or developing progeny varies with developmental time and dsRNA substrates. Loss of SID-1 enhances initiation of heritable RNA silencing within the germline and causes changes in the expression of the s id-1 - d ependent g ene sdg-1 that last for more than 100 generations after restoration of SID-1. The SDG-1 protein is enriched in perinuclear germ granules required for heritable RNA silencing but is expressed from a retrotransposon targeted by such silencing. This auto-inhibitory loop suggests how retrotransposons could persist by hosting genes that regulate their own silencing.

Overview

The claims and statistics of this paper haven’t been checked yet.

Run the check — free, no account needed. It reads the open-access text and checks the sources it cites.

A few free checks a day · papers already verified open instantly · results are public

Integrity signals

Registry

Crossref · 10.7554/elife.99149.3

Cites

117 of 117 references verified0 citation errors · 0 not checkable

Statistics

Figures

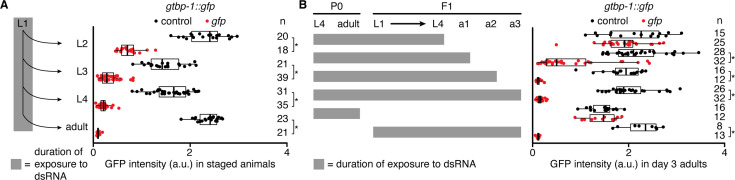
Figure 1. Gene silencing by ingested dsRNA during larval development can fail to persist into adulthood. Silencing in the germline was measured after exposure of gtbp-1::gfp animals to bacteria expressing dsRNA by imaging separate cohorts at indicated stages (A) or day 3 of adulthood (B). (A and B), left Schematics depicting stages and durations of exposure to dsRNA. (A and B), right GFP intensity (a.u.) in gtbp-1::gfp animals quantified in germ cells (larvae) or eggs in utero (adults) (A) or in day 3 adult (a3) animals (B) after exposure to control dsRNA (black) or gfp-dsRNA (red). The numbers of animals scored at each stage (n) are indicated. Asterisks indicate p<0.05 with Bonferroni correction using Mann-Whitney U test for two-sided comparisons between animals exposed to control dsRNA or gfp-dsRNA. Also see Figure 1—figure supplement 1.
Figure 1. Gene silencing by ingested dsRNA during larval development can fail to persist into adulthood. Silencing in the germline was measured after exposure of gtbp-1::gfp animals to bacteria expressing dsRNA by imaging separate cohorts at indicated stages (A) or day 3 of adulthood (B). (A and B), left Schematics depicting stages and durations of exposure to dsRNA. (A and B), right GFP intensity (a.u.) in gtbp-1::gfp animals quantified in germ cells (larvae) or eggs in utero (adults) (A) or in day 3 adult (a3) animals (B) after exposure to control dsRNA (black) or gfp-dsRNA (red). The numbers of animals scored at each stage (n) are indicated. Asterisks indicate p<0.05 with Bonferroni correction using Mann-Whitney U test for two-sided comparisons between animals exposed to control dsRNA or gfp-dsRNA. Also see Figure 1—figure supplement 1.CC BY · PubMed Central
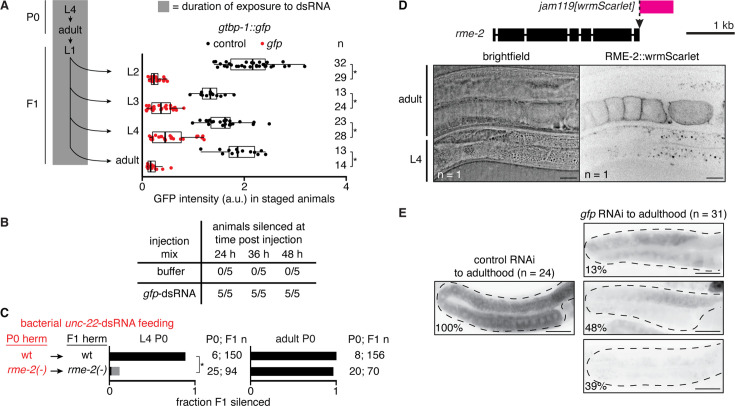
Figure 1—figure supplement 1. Uptake of dsRNA into the proximal germline by RME-2 is required for silencing during early adulthood. (A) left Schematic depicting continuous exposure of gtbp-1::gfp P0 animals, starting at the L4 stage, and their F1 progeny to bacteria expressing dsRNA, followed by imaging of animals at the indicated stages. (right) Quantification of GTBP-1::GFP intensity (arbitrary units, a.u.) in representative germ cells (larvae) or embryos in utero (adults) of F1 animals at indicated stages after P0 and F1 exposure to control dsRNA (dark grey) or gfp-dsRNA (red). Numbers of animals scored at each stage (n) are indicated. Asterisks indicate P<0.05 with Bonferroni correction using Mann-Whitney U test for two-sided comparisons between animals exposed to control dsRNA or gfp-dsRNA. (B) Silencing of gtbp-1::gfp in germlines injected with duplex buffer (buffer) or in vitro transcribed gfp-dsRNA in duplex buffer during the first day of adulthood and scored for silencing 24, 36, and 48 h post injection. The numbers of animals out of 5 injected with each injection mix that exhibited silencing of both gonad arms are indicated for each time point. Animals injected with buffer never exhibited silencing in either gonad arm. (C) Hermaphrodite animals of the L4 stage (left) or young adult stage (24 hr post L4, right) of the indicated genotypes were fed unc-22-dsRNA expressed in bacteria for 24 hr (red). Hermaphrodite self-progeny of fed animals were scored for unc-22 silencing (strong, black; weak, grey). Numbers of fed P0 parents and scored F1 progeny (P0; F1 n) are as indicated. Asterisk indicates p<0.05 with Bonferroni correction using χ2 test. Previously generated rme-2(-) animals were used in this assay (DH1390). (D) Expression of RME-2. (top) Schematic showing insertion of wrmScarlet (rme-2(jam119[wrmScarlet])) at the rme-2 locus. Scale bar, 1 kb. (bottom) Brightfield and fluorescence images of a rme-2(jam119[wrmScarlet]) L4-stage and adult animal (n=1 confocal plane). Scale bars, 20 μm. (E) Representative fluorescence images of GTBP-1::GFP (black) in the germlines (dashed outline) of day 3 gtbp-1::gfp adult animals after P0 and F1 ingestion of control dsRNA (left) or gfp-dsRNA (right) up to the first day of adulthood. Numbers of animals imaged (n) and the percentages of animals exhibiting the depicted expression patterns are shown. Scale bars, 50 μm.
Figure 1—figure supplement 1. Uptake of dsRNA into the proximal germline by RME-2 is required for silencing during early adulthood. (A) left Schematic depicting continuous exposure of gtbp-1::gfp P0 animals, starting at the L4 stage, and their F1 progeny to bacteria expressing dsRNA, followed by imaging of animals at the indicated stages. (right) Quantification of GTBP-1::GFP intensity (arbitrary units, a.u.) in representative germ cells (larvae) or embryos in utero (adults) of F1 animals at indicated stages after P0 and F1 exposure to control dsRNA (dark grey) or gfp-dsRNA (red). Numbers of animals scored at each stage (n) are indicated. Asterisks indicate P<0.05 with Bonferroni correction using Mann-Whitney U test for two-sided comparisons between animals exposed to control dsRNA or gfp-dsRNA. (B) Silencing of gtbp-1::gfp in germlines injected with duplex buffer (buffer) or in vitro transcribed gfp-dsRNA in duplex buffer during the first day of adulthood and scored for silencing 24, 36, and 48 h post injection. The numbers of animals out of 5 injected with each injection mix that exhibited silencing of both gonad arms are indicated for each time point. Animals injected with buffer never exhibited silencing in either gonad arm. (C) Hermaphrodite animals of the L4 stage (left) or young adult stage (24 hr post L4, right) of the indicated genotypes were fed unc-22-dsRNA expressed in bacteria for 24 hr (red). Hermaphrodite self-progeny of fed animals were scored for unc-22 silencing (strong, black; weak, grey). Numbers of fed P0 parents and scored F1 progeny (P0; F1 n) are as indicated. Asterisk indicates p<0.05 with Bonferroni correction using χ2 test. Previously generated rme-2(-) animals were used in this assay (DH1390). (D) Expression of RME-2. (top) Schematic showing insertion of wrmScarlet (rme-2(jam119[wrmScarlet])) at the rme-2 locus. Scale bar, 1 kb. (bottom) Brightfield and fluorescence images of a rme-2(jam119[wrmScarlet]) L4-stage and adult animal (n=1 confocal plane). Scale bars, 20 μm. (E) Representative fluorescence images of GTBP-1::GFP (black) in the germlines (dashed outline) of day 3 gtbp-1::gfp adult animals after P0 and F1 ingestion of control dsRNA (left) or gfp-dsRNA (right) up to the first day of adulthood. Numbers of animals imaged (n) and the percentages of animals exhibiting the depicted expression patterns are shown. Scale bars, 50 μm.CC BY · PubMed Central
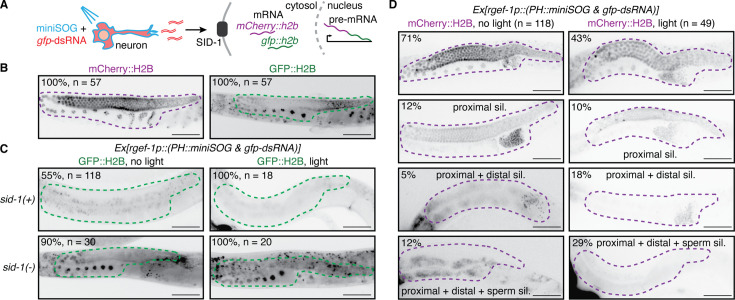
Figure 2. Oxidative damage of neurons enhances gene silencing by neuronal dsRNA in the adult germline. (A) Schematic illustrating exposure to blue light of animals expressing a singlet oxygen generator (miniSOG) and gfp-dsRNA in neurons, and subsequent release of dsRNA. Such extracellular dsRNA is expected to enter the cytosol of the germline through the dsRNA importer SID-1 and silence gfp::h2b mRNA from a two-gene operon that expresses mCherry::h2b and gfp::h2b as part of a single pre-mRNA. (B–D) Images of single gonad arms in adult animals with the two-gene operon (mex-5p::mCherry::h2b::gfp::h2b) showing fluorescence (black) of mCherry::H2B (magenta outline) or of GFP::H2B (green outline). Punctate autofluorescence from the intestine can also be seen. Numbers of animals assayed (n) and percentages of adult animals with the depicted expression patterns are indicated. Scale bars, 50 μm. (B) mCherry::H2B fluorescence is seen throughout the germline (left) and GFP::H2B fluorescence is seen in the oocytes and in the distal gonad (right). (C) GFP::H2B fluorescence in sid-1(+) and sid-1(-) animals expressing membrane-localized miniSOG (PH::miniSOG) and gfp-dsRNA driven by a neuronal promoter (rgef-1p) from a multi-copy transgene (Ex, jamEx214) without (left) or with (right) exposure to blue light at 48 hr post L4-stage of parent. (D) mCherry::H2B fluorescence in sid-1(+) animals with the transgene Ex. Silencing of mCherry is enhanced in the distal gonad (third row) and sperm (fourth row) after exposing animals to blue light at 48 hr and 54 hr post L4-stage of parent. By region, silencing after exposure to light (right) in the proximal germline (57%=10 + 18+29)>distal germline (47%=18 + 29)>sperm (29%). Also see Figure 2—figure supplements 1 and 2.
Figure 2. Oxidative damage of neurons enhances gene silencing by neuronal dsRNA in the adult germline. (A) Schematic illustrating exposure to blue light of animals expressing a singlet oxygen generator (miniSOG) and gfp-dsRNA in neurons, and subsequent release of dsRNA. Such extracellular dsRNA is expected to enter the cytosol of the germline through the dsRNA importer SID-1 and silence gfp::h2b mRNA from a two-gene operon that expresses mCherry::h2b and gfp::h2b as part of a single pre-mRNA. (B–D) Images of single gonad arms in adult animals with the two-gene operon (mex-5p::mCherry::h2b::gfp::h2b) showing fluorescence (black) of mCherry::H2B (magenta outline) or of GFP::H2B (green outline). Punctate autofluorescence from the intestine can also be seen. Numbers of animals assayed (n) and percentages of adult animals with the depicted expression patterns are indicated. Scale bars, 50 μm. (B) mCherry::H2B fluorescence is seen throughout the germline (left) and GFP::H2B fluorescence is seen in the oocytes and in the distal gonad (right). (C) GFP::H2B fluorescence in sid-1(+) and sid-1(-) animals expressing membrane-localized miniSOG (PH::miniSOG) and gfp-dsRNA driven by a neuronal promoter (rgef-1p) from a multi-copy transgene (Ex, jamEx214) without (left) or with (right) exposure to blue light at 48 hr post L4-stage of parent. (D) mCherry::H2B fluorescence in sid-1(+) animals with the transgene Ex. Silencing of mCherry is enhanced in the distal gonad (third row) and sperm (fourth row) after exposing animals to blue light at 48 hr and 54 hr post L4-stage of parent. By region, silencing after exposure to light (right) in the proximal germline (57%=10 + 18+29)>distal germline (47%=18 + 29)>sperm (29%). Also see Figure 2—figure supplements 1 and 2.CC BY · PubMed Central
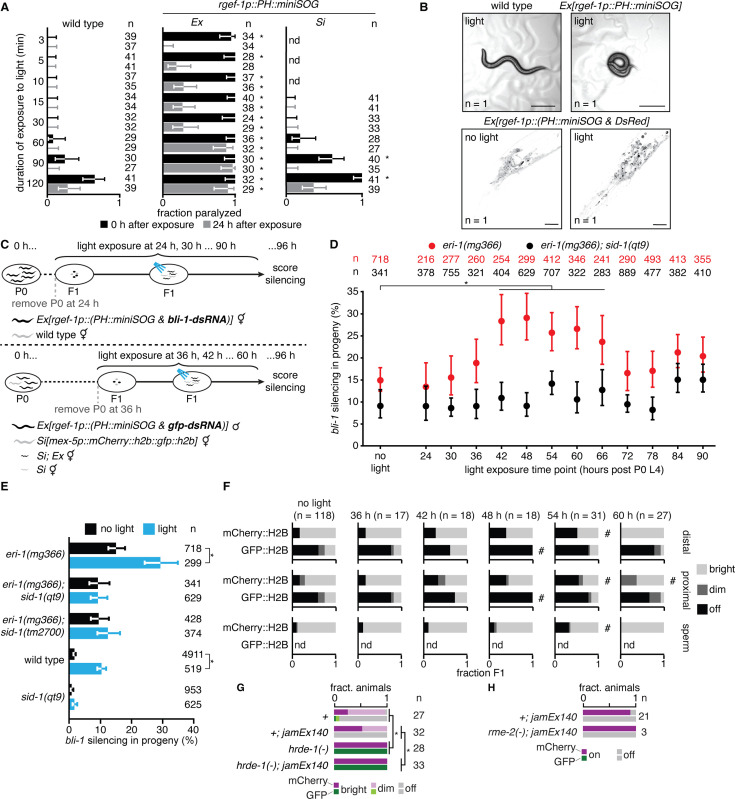
Figure 2—figure supplement 1. Timed release of neuronal dsRNA by oxidative damage in neurons reveals period of enhanced gene silencing in the soma and germline. (A) Wild-type animals (left) and animals expressing membrane-tethered mini singlet oxygen generator protein (PH::miniSOG) from an extrachromosomal array (Ex, middle) or a single-copy transgene (Si, right) under a pan-neuronal promoter (rgef-1p) were exposed to blue light for different durations (minutes) and animals were scored for paralysis immediately after exposure (0 hr, black) and 24 hr later (24 hr, grey). (B) Functional and anatomical evidence for oxidative damage in neurons. (top) Widefield images of animals without (left) and with (right) Ex[rgef-1p::PH::miniSOG] after 5 min of blue light exposure. Animals paralyzed in (A) often appear coiled (right), likely indicative of a defect in neuronal signaling. Scale bar, 100 μm. (bottom) Confocal fluorescence images of neurons in the head region of animals with Ex[rgef-1p::(PH::miniSOG & DsRed)] without (left) and with (right) 30 minutes of blue light exposure showing light-induced changes (black, DsRed fluorescence). Scale bar, 20 μm. (C) Schematic of assay for measuring the impact of oxidative damage in neurons at different times during development on silencing by neuronal dsRNA. For measuring silencing in the hypodermis (top) or germline (bottom), cohorts of animals with Ex[rgef-1p::(PH::miniSOG & bli-1-dsRNA)] (top), or Ex[rgef-1p::(PH::miniSOG & gfp-dsRNA)] obtained by mating males with the array and hermaphrodites with Si[mex-5p::mCherry::h2b::gfp::h2b] (bottom) were exposed to blue light as indicated and scored for bli-1 silencing (top) or imaged (bottom) as stage-matched adults (at ~96 hr after the fourth larval stage of parent animals). (D) Percentages of eri-1(mg366) (red) or eri-1(mg366); sid-1(qt9) (black) animals silenced when assayed as described in (C, top). Silencing in the absence of exposure to blue light (no light) was also measured for comparison. (E) Percentages of stage-matched animals of the indicated genetic backgrounds with Ex[rgef-1p::(PH::miniSOG & bli-1-dsRNA)] that show bli-1 silencing without (black) or with (blue) a 1 hr exposure to blue light 48 hr after the fourth larval stage of parent animals. The 48 hr time point from (D) is replotted to facilitate comparison. (F) Fractions of animals exhibiting bright (light grey), dim (dark grey) or not detectable (black) mCherry::H2B or GFP::H2B fluorescence in the distal gonad (top), proximal gonad (middle) or sperm (bottom) when assayed as described in (C, bottom). Silencing in the absence of exposure to blue light (no light) was used as the reference. Numbers of animals scored (n), measurements that were not done (nd), significant differences using two-tailed Wilson’s estimates for single proportion compared to wild type (asterisks in A) or no light condition (asterisks in D and E) or χ2 test compared to no light condition (hashes in (F); p<0.05 with Bonferroni correction), and error bars (95% CI) are indicated. (G and H) Animals homozygous (G) or hemizygous (H) for the mex-5p::mCherry::h2b::gfp::h2b transgene (Figure 2) with or without neuronal gfp-dsRNA (jamEx140) were scored for expression of mCherry and GFP (bright, dim, off) in otherwise wild-type (+), hrde-1(-) (G) or rme-2(-) (H) backgrounds. Animals in (G) also have a dpy-2(e8) mutation linked to the mex-5p::mCherry::h2b::gfp::h2b transgene. Fraction silenced in wild-type animals (+) in (G) were calculated with n=31 for GFP and n=27 for mCherry. Asterisks indicates p<0.05 using χ2 test with Bonferroni correction.
Figure 2—figure supplement 1. Timed release of neuronal dsRNA by oxidative damage in neurons reveals period of enhanced gene silencing in the soma and germline. (A) Wild-type animals (left) and animals expressing membrane-tethered mini singlet oxygen generator protein (PH::miniSOG) from an extrachromosomal array (Ex, middle) or a single-copy transgene (Si, right) under a pan-neuronal promoter (rgef-1p) were exposed to blue light for different durations (minutes) and animals were scored for paralysis immediately after exposure (0 hr, black) and 24 hr later (24 hr, grey). (B) Functional and anatomical evidence for oxidative damage in neurons. (top) Widefield images of animals without (left) and with (right) Ex[rgef-1p::PH::miniSOG] after 5 min of blue light exposure. Animals paralyzed in (A) often appear coiled (right), likely indicative of a defect in neuronal signaling. Scale bar, 100 μm. (bottom) Confocal fluorescence images of neurons in the head region of animals with Ex[rgef-1p::(PH::miniSOG & DsRed)] without (left) and with (right) 30 minutes of blue light exposure showing light-induced changes (black, DsRed fluorescence). Scale bar, 20 μm. (C) Schematic of assay for measuring the impact of oxidative damage in neurons at different times during development on silencing by neuronal dsRNA. For measuring silencing in the hypodermis (top) or germline (bottom), cohorts of animals with Ex[rgef-1p::(PH::miniSOG & bli-1-dsRNA)] (top), or Ex[rgef-1p::(PH::miniSOG & gfp-dsRNA)] obtained by mating males with the array and hermaphrodites with Si[mex-5p::mCherry::h2b::gfp::h2b] (bottom) were exposed to blue light as indicated and scored for bli-1 silencing (top) or imaged (bottom) as stage-matched adults (at ~96 hr after the fourth larval stage of parent animals). (D) Percentages of eri-1(mg366) (red) or eri-1(mg366); sid-1(qt9) (black) animals silenced when assayed as described in (C, top). Silencing in the absence of exposure to blue light (no light) was also measured for comparison. (E) Percentages of stage-matched animals of the indicated genetic backgrounds with Ex[rgef-1p::(PH::miniSOG & bli-1-dsRNA)] that show bli-1 silencing without (black) or with (blue) a 1 hr exposure to blue light 48 hr after the fourth larval stage of parent animals. The 48 hr time point from (D) is replotted to facilitate comparison. (F) Fractions of animals exhibiting bright (light grey), dim (dark grey) or not detectable (black) mCherry::H2B or GFP::H2B fluorescence in the distal gonad (top), proximal gonad (middle) or sperm (bottom) when assayed as described in (C, bottom). Silencing in the absence of exposure to blue light (no light) was used as the reference. Numbers of animals scored (n), measurements that were not done (nd), significant differences using two-tailed Wilson’s estimates for single proportion compared to wild type (asterisks in A) or no light condition (asterisks in D and E) or χ2 test compared to no light condition (hashes in (F); p<0.05 with Bonferroni correction), and error bars (95% CI) are indicated. (G and H) Animals homozygous (G) or hemizygous (H) for the mex-5p::mCherry::h2b::gfp::h2b transgene (Figure 2) with or without neuronal gfp-dsRNA (jamEx140) were scored for expression of mCherry and GFP (bright, dim, off) in otherwise wild-type (+), hrde-1(-) (G) or rme-2(-) (H) backgrounds. Animals in (G) also have a dpy-2(e8) mutation linked to the mex-5p::mCherry::h2b::gfp::h2b transgene. Fraction silenced in wild-type animals (+) in (G) were calculated with n=31 for GFP and n=27 for mCherry. Asterisks indicates p<0.05 using χ2 test with Bonferroni correction.CC BY · PubMed Central
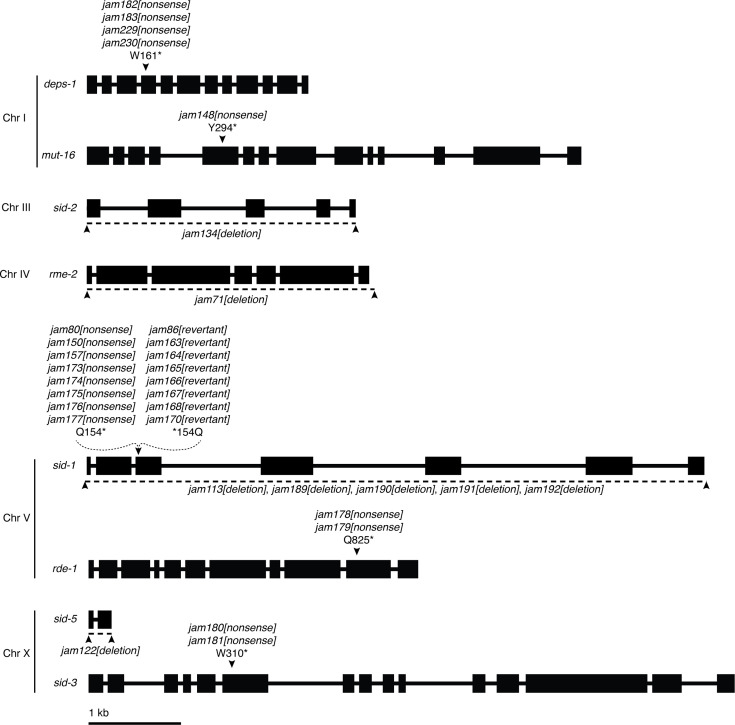
Figure 2—figure supplement 2. Schematics depicting mutations generated in this study. Structures (boxes, exons; lines, introns) and chromosomal locations of genes with mutations generated using Cas9-mediated genome editing. Nonsense mutations (e.g. jam182[nonsense]) with associated amino acid changes (e.g. W161* for tryptophan at position 161 to stop) are indicated with black arrowheads and deletions of coding regions (e.g. jam134[deletion]) are indicated with a dashed line (deleted region) and flanking black arrowheads. Scale bar, 1 kb.
Figure 2—figure supplement 2. Schematics depicting mutations generated in this study. Structures (boxes, exons; lines, introns) and chromosomal locations of genes with mutations generated using Cas9-mediated genome editing. Nonsense mutations (e.g. jam182[nonsense]) with associated amino acid changes (e.g. W161* for tryptophan at position 161 to stop) are indicated with black arrowheads and deletions of coding regions (e.g. jam134[deletion]) are indicated with a dashed line (deleted region) and flanking black arrowheads. Scale bar, 1 kb.CC BY · PubMed Central
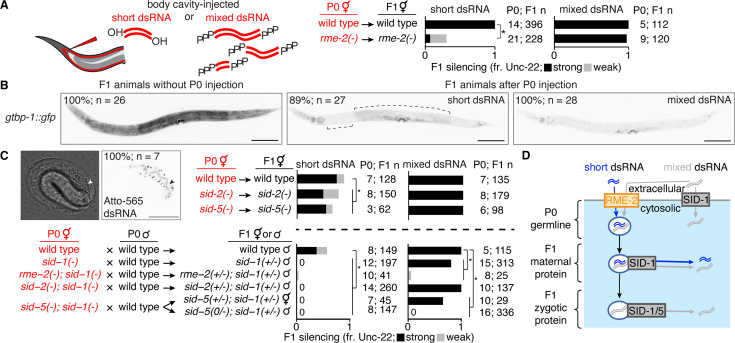
Figure 3. Transport of dsRNA from parental circulation to progeny occurs through two routes with distinct substrate selectivity. (A) Hermaphrodite animals of indicated genotypes (in red) were injected in the body cavity with 50 bp unc-22-dsRNA synthesized with a 5’-OH (short dsRNA, left bars) or unc-22-dsRNA with a 5’ triphosphate transcribed from a ~1.1 kb template (mixed dsRNA, right bars). Hermaphrodite self-progeny of injected animals were scored for unc-22 silencing (fr. Unc-22: strong, black; weak, grey). Numbers of injected parents and scored progeny (P0; F1 n) are indicated. Also see Figure 3—figure supplements 1 and 2. (B) Fluorescence images of progeny from animals with a gfp tag of the ubiquitously expressed gene gtbp-1 (gtbp-1::gfp) that were not injected (left), injected with 50 bp gfp-dsRNA (short dsRNA injection, middle), or injected with dsRNA transcribed from an ~730 bp template (mixed dsRNA injection, right). Complete silencing is not observed in neurons or in the developing vulva; brackets indicate additional regions with dim GFP fluorescence. Numbers of animals assayed (n) and percentages of L4-staged animals with the depicted expression patterns are indicated. Scale bar, 100 μm. Also see Figure 3—figure supplement 2. (C) Requirements for intergenerational transport of extracellular dsRNA. (top left) Differential Interference Contrast (DIC) and fluorescence images of a developing embryo from an animal injected in the body cavity with 50 bp dsRNA of the same sequence as in (B) and labeled at the 5’ end of the antisense strand with Atto-565. Accumulation within the intestinal lumen (arrowhead), number of embryos imaged (n), and percentage of embryos with depicted pattern of fluorescence are indicated. Scale bar, 20 μm. (top right and bottom) Hermaphrodite animals of the indicated genotypes were injected with short dsRNA (left bars) or mixed dsRNA (right bars) and self-progeny (top right) or cross progeny after mating with wild-type males (bottom) were analyzed as in (A). Cases of no observable silencing are indicated with ‘0’. (D) Schematic summarizing requirements for transport of dsRNA from parental circulation to developing progeny. See text for details. Asterisks in (A) and (C) indicate p<0.05 with Bonferroni correction using χ2 test.
Figure 3. Transport of dsRNA from parental circulation to progeny occurs through two routes with distinct substrate selectivity. (A) Hermaphrodite animals of indicated genotypes (in red) were injected in the body cavity with 50 bp unc-22-dsRNA synthesized with a 5’-OH (short dsRNA, left bars) or unc-22-dsRNA with a 5’ triphosphate transcribed from a ~1.1 kb template (mixed dsRNA, right bars). Hermaphrodite self-progeny of injected animals were scored for unc-22 silencing (fr. Unc-22: strong, black; weak, grey). Numbers of injected parents and scored progeny (P0; F1 n) are indicated. Also see Figure 3—figure supplements 1 and 2. (B) Fluorescence images of progeny from animals with a gfp tag of the ubiquitously expressed gene gtbp-1 (gtbp-1::gfp) that were not injected (left), injected with 50 bp gfp-dsRNA (short dsRNA injection, middle), or injected with dsRNA transcribed from an ~730 bp template (mixed dsRNA injection, right). Complete silencing is not observed in neurons or in the developing vulva; brackets indicate additional regions with dim GFP fluorescence. Numbers of animals assayed (n) and percentages of L4-staged animals with the depicted expression patterns are indicated. Scale bar, 100 μm. Also see Figure 3—figure supplement 2. (C) Requirements for intergenerational transport of extracellular dsRNA. (top left) Differential Interference Contrast (DIC) and fluorescence images of a developing embryo from an animal injected in the body cavity with 50 bp dsRNA of the same sequence as in (B) and labeled at the 5’ end of the antisense strand with Atto-565. Accumulation within the intestinal lumen (arrowhead), number of embryos imaged (n), and percentage of embryos with depicted pattern of fluorescence are indicated. Scale bar, 20 μm. (top right and bottom) Hermaphrodite animals of the indicated genotypes were injected with short dsRNA (left bars) or mixed dsRNA (right bars) and self-progeny (top right) or cross progeny after mating with wild-type males (bottom) were analyzed as in (A). Cases of no observable silencing are indicated with ‘0’. (D) Schematic summarizing requirements for transport of dsRNA from parental circulation to developing progeny. See text for details. Asterisks in (A) and (C) indicate p<0.05 with Bonferroni correction using χ2 test.CC BY · PubMed Central
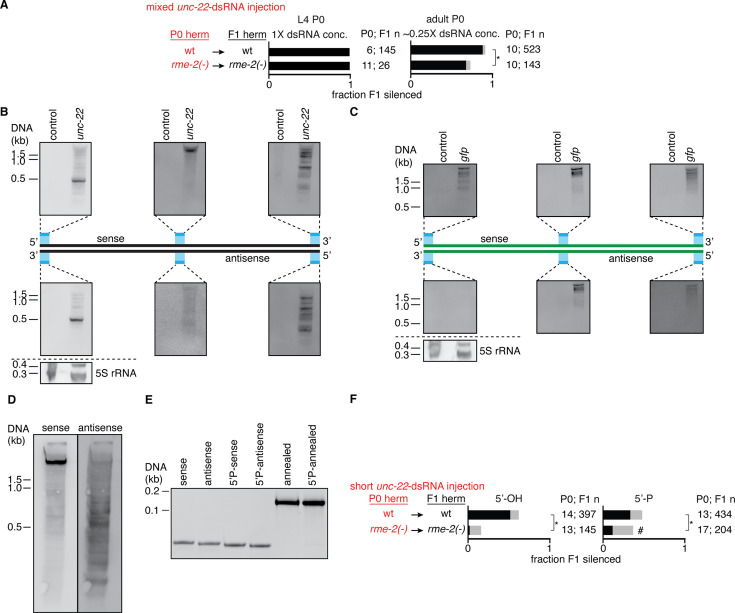
Figure 3—figure supplement 1. Requirement of RME-2 for silencing in progeny by dsRNA injected into parents depends on concentration, length, and 5’ modification of dsRNA. (A) Hermaphrodite animals of indicated genotypes were injected in the body cavity with unc-22-dsRNA (red font) and uninjected F1 progeny were scored for unc-22 silencing (strong, black; weak, grey). Numbers of injected P0 parents and scored F1 progeny (P0; F1 n) are as indicated. (left) L4-staged hermaphrodites were injected with transcribed unc-22-dsRNA at the same concentration as in Figure 3A (1X). (right) Young adult-staged hermaphrodites were injected with transcribed unc-22-dsRNA at ~0.25X of concentration in Figure 3A. (B and C) Northern blots of bacterial unc-22-dsRNA (unc-22, B) or gfp-dsRNA (gfp, C) separated alongside empty vector control RNA using fully-denaturing formaldehyde polyacrylamide gel electrophoresis (FDF-PAGE) (Harris et al., 2015). 40-nt digoxigenin (DIG)-labeled oligonucleotides (in blue) were used to probe the 5’ end, middle and 3’ end of the sense (top) and antisense (bottom) strands of the unc-22 (B) and gfp (C) sequences present in the bacterial vectors. A 1 kb DNA ladder was used as a size reference and 5S rRNA was probed as a control for equal loading of total RNA. (D) Northern blot of unc-22-dsRNA transcribed from a ~1.1 kb template, separated using FDF-PAGE as in (B) and (C), and probed using 40-nt DIG-labeled oligonucleotides complementary to the sense (left) or antisense (right) strands of the unc-22 gene. (E) Polyacrylamide gel stained with ethidium bromide showing 50-nt single-stranded (sense, antisense, 5’P-sense, 5’P-antisense) and 50 bp double-stranded unc-22-RNA (annealed, 5’P-annealed). A 100 bp DNA ladder was run alongside for rough size estimation. 5’-phosphate (5’P) was added using a polynucleotide kinase. (F) Young adult-staged hermaphrodites were injected in the body cavity with short unc-22-dsRNA with 5’-OH (left) or with 5’-phosphate added using a polynucleotide kinase (right) and self-progeny were scored as in (A). Newly generated rme-2(-) animals (AMJ1131) were used in (A) and (F). Comparisons with p<0.05 after Bonferroni correction using χ2 test between genotypes within conditions (asterisks in A and F) or between conditions in rme-2(-) animals (hash in F) are indicated.
Figure 3—figure supplement 1. Requirement of RME-2 for silencing in progeny by dsRNA injected into parents depends on concentration, length, and 5’ modification of dsRNA. (A) Hermaphrodite animals of indicated genotypes were injected in the body cavity with unc-22-dsRNA (red font) and uninjected F1 progeny were scored for unc-22 silencing (strong, black; weak, grey). Numbers of injected P0 parents and scored F1 progeny (P0; F1 n) are as indicated. (left) L4-staged hermaphrodites were injected with transcribed unc-22-dsRNA at the same concentration as in Figure 3A (1X). (right) Young adult-staged hermaphrodites were injected with transcribed unc-22-dsRNA at ~0.25X of concentration in Figure 3A. (B and C) Northern blots of bacterial unc-22-dsRNA (unc-22, B) or gfp-dsRNA (gfp, C) separated alongside empty vector control RNA using fully-denaturing formaldehyde polyacrylamide gel electrophoresis (FDF-PAGE) (Harris et al., 2015). 40-nt digoxigenin (DIG)-labeled oligonucleotides (in blue) were used to probe the 5’ end, middle and 3’ end of the sense (top) and antisense (bottom) strands of the unc-22 (B) and gfp (C) sequences present in the bacterial vectors. A 1 kb DNA ladder was used as a size reference and 5S rRNA was probed as a control for equal loading of total RNA. (D) Northern blot of unc-22-dsRNA transcribed from a ~1.1 kb template, separated using FDF-PAGE as in (B) and (C), and probed using 40-nt DIG-labeled oligonucleotides complementary to the sense (left) or antisense (right) strands of the unc-22 gene. (E) Polyacrylamide gel stained with ethidium bromide showing 50-nt single-stranded (sense, antisense, 5’P-sense, 5’P-antisense) and 50 bp double-stranded unc-22-RNA (annealed, 5’P-annealed). A 100 bp DNA ladder was run alongside for rough size estimation. 5’-phosphate (5’P) was added using a polynucleotide kinase. (F) Young adult-staged hermaphrodites were injected in the body cavity with short unc-22-dsRNA with 5’-OH (left) or with 5’-phosphate added using a polynucleotide kinase (right) and self-progeny were scored as in (A). Newly generated rme-2(-) animals (AMJ1131) were used in (A) and (F). Comparisons with p<0.05 after Bonferroni correction using χ2 test between genotypes within conditions (asterisks in A and F) or between conditions in rme-2(-) animals (hash in F) are indicated.CC BY · PubMed Central
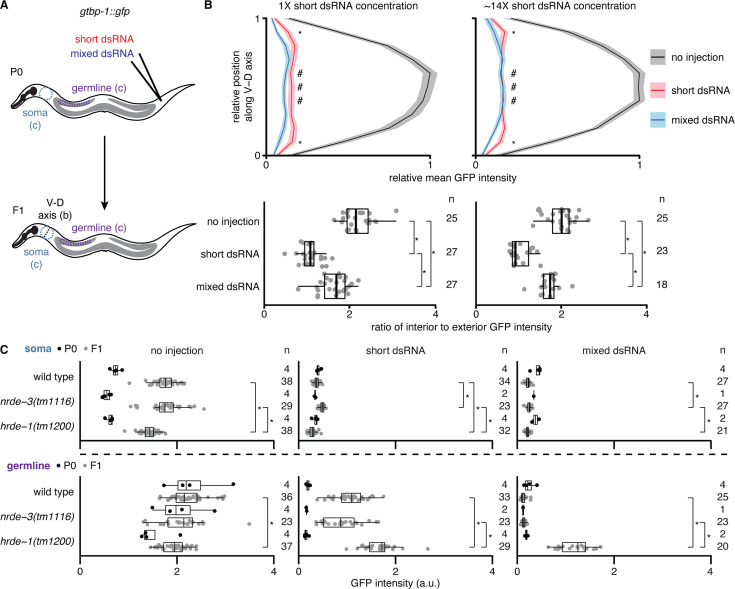
Figure 3—figure supplement 2. Extent of silencing in progeny by short or mixed dsRNA injected into parental circulation varies between tissues but has similar nuclear Argonaute requirements. (A–C) GTBP-1::GFP fluorescence from the ubiquitously expressed gene gtbp-1::gfp in the F1 progeny of uninjected P0 animals (no injection) or of P0 animals injected into the body cavity with synthetic 50 bp gfp-dsRNA (short dsRNA) or gfp-dsRNA transcribed from an ~730 bp DNA template (mixed dsRNA) was analyzed. The expression of gtbp-1::gfp is dimmer in P0 animals (imaged as adults) than in F1 animals (imaged as L4s) because of developmental variation in the expression – therefore comparisons are only appropriate during the same generation and not across generations. (A) Schematic illustrating injection site and scoring scheme. For the soma, a region between the pharynx and anterior gonad arm within a circle (blue, data in C) or along a ventral to dorsal (V–D) axis (black, data in B) was quantified. For the germline, a gonadal region that excluded the intestine (purple, data in C) was quantified. (B) Quantification of F1 progeny after injection of two different concentrations of short dsRNA (1X, 350 ng/μl, left; ~14X, 4977 ng/μl, right) into the body cavity of P0 animals. (top) The relative mean intensity profile of fluorescence along the V-D axis for progeny of uninjected animals (black), animals injected with short dsRNA (red), or animals injected with mixed dsRNA (blue). Shaded bands indicate 95% CI. (bottom) Ratios of mean intensities within interior points (hashes in top) to those of the exterior points (asterisks in top) are depicted for each imaged animal. (C) Quantification of P0 (black) and F1 (grey) wild-type, nrde-3(tm1116) or hrde-1(tm1200) animals. Regions within the soma and the germline were quantified as indicated in (A). The numbers of P0 and F1 animals quantified (P0; F1 n) are indicated. For each genotype, F1 progeny after no injection, short dsRNA injection, or mixed dsRNA injection into P0 animals showed significantly different fluorescence values from each other (p<0.05 after Bonferroni correction using Mann-Whitney U test for two-sided comparisons). Similarly significant differences between treatments across genotypes are indicated (asterisks).
Figure 3—figure supplement 2. Extent of silencing in progeny by short or mixed dsRNA injected into parental circulation varies between tissues but has similar nuclear Argonaute requirements. (A–C) GTBP-1::GFP fluorescence from the ubiquitously expressed gene gtbp-1::gfp in the F1 progeny of uninjected P0 animals (no injection) or of P0 animals injected into the body cavity with synthetic 50 bp gfp-dsRNA (short dsRNA) or gfp-dsRNA transcribed from an ~730 bp DNA template (mixed dsRNA) was analyzed. The expression of gtbp-1::gfp is dimmer in P0 animals (imaged as adults) than in F1 animals (imaged as L4s) because of developmental variation in the expression – therefore comparisons are only appropriate during the same generation and not across generations. (A) Schematic illustrating injection site and scoring scheme. For the soma, a region between the pharynx and anterior gonad arm within a circle (blue, data in C) or along a ventral to dorsal (V–D) axis (black, data in B) was quantified. For the germline, a gonadal region that excluded the intestine (purple, data in C) was quantified. (B) Quantification of F1 progeny after injection of two different concentrations of short dsRNA (1X, 350 ng/μl, left; ~14X, 4977 ng/μl, right) into the body cavity of P0 animals. (top) The relative mean intensity profile of fluorescence along the V-D axis for progeny of uninjected animals (black), animals injected with short dsRNA (red), or animals injected with mixed dsRNA (blue). Shaded bands indicate 95% CI. (bottom) Ratios of mean intensities within interior points (hashes in top) to those of the exterior points (asterisks in top) are depicted for each imaged animal. (C) Quantification of P0 (black) and F1 (grey) wild-type, nrde-3(tm1116) or hrde-1(tm1200) animals. Regions within the soma and the germline were quantified as indicated in (A). The numbers of P0 and F1 animals quantified (P0; F1 n) are indicated. For each genotype, F1 progeny after no injection, short dsRNA injection, or mixed dsRNA injection into P0 animals showed significantly different fluorescence values from each other (p<0.05 after Bonferroni correction using Mann-Whitney U test for two-sided comparisons). Similarly significant differences between treatments across genotypes are indicated (asterisks).CC BY · PubMed Central
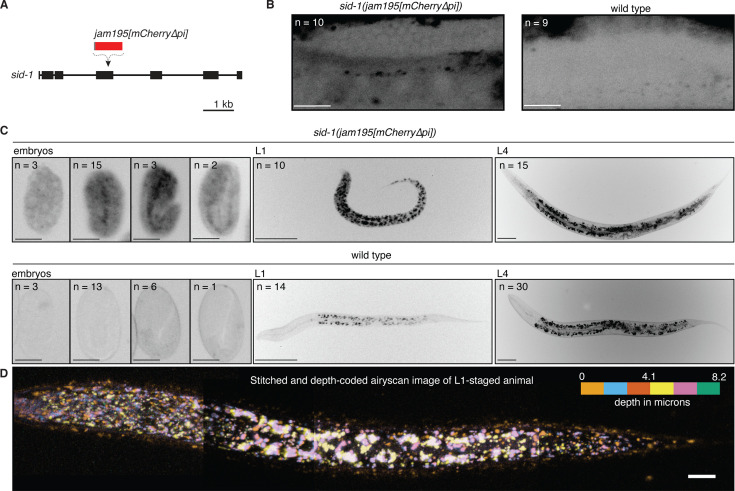
Figure 4. The expression pattern of SID-1 varies during development. (A) Schematic depicting insertion of mCherry sequence that lacks piRNA binding sites (jam195[mCherry∆pi]; Zhang et al., 2018; Devanapally et al., 2021) into the sid-1 gene using Cas9-mediated genome editing. (B and C) Representative images showing fluorescence from SID-1::mCherry (black) in (B) the adult gonad arm, (C, left) developing embryos, (C, middle) L1-stage animals, or (C, right) L4-stage animals with sid-1(jam195[mCherry∆pi]) compared to autofluorescence in wild-type animals of the same stages. Numbers (n) of each stage imaged are indicated (100% of animals exhibited the depicted expression patterns). For animals imaged in (B), the distal germline was obstructed by the intestine in 1/10 sid-1(jam195[mCherry∆pi]) and 5/9 wild-type animals. (D) Airyscan image of an L1-staged animal assembled by stitching four different Z-stacks after depth-coding and taking maximum projections, illustrating the expression of SID-1::mCherry throughout the animal. Scale bar for adult gonad arms in (B) and embryos in (C), 20 μm; scale bar for larvae in (C), 50 μm and in (D), 10 μm. Also see Technical comments on ‘Making a sid-1 translational reporter’ in Materials and methods.
Figure 4. The expression pattern of SID-1 varies during development. (A) Schematic depicting insertion of mCherry sequence that lacks piRNA binding sites (jam195[mCherry∆pi]; Zhang et al., 2018; Devanapally et al., 2021) into the sid-1 gene using Cas9-mediated genome editing. (B and C) Representative images showing fluorescence from SID-1::mCherry (black) in (B) the adult gonad arm, (C, left) developing embryos, (C, middle) L1-stage animals, or (C, right) L4-stage animals with sid-1(jam195[mCherry∆pi]) compared to autofluorescence in wild-type animals of the same stages. Numbers (n) of each stage imaged are indicated (100% of animals exhibited the depicted expression patterns). For animals imaged in (B), the distal germline was obstructed by the intestine in 1/10 sid-1(jam195[mCherry∆pi]) and 5/9 wild-type animals. (D) Airyscan image of an L1-staged animal assembled by stitching four different Z-stacks after depth-coding and taking maximum projections, illustrating the expression of SID-1::mCherry throughout the animal. Scale bar for adult gonad arms in (B) and embryos in (C), 20 μm; scale bar for larvae in (C), 50 μm and in (D), 10 μm. Also see Technical comments on ‘Making a sid-1 translational reporter’ in Materials and methods.CC BY · PubMed Central
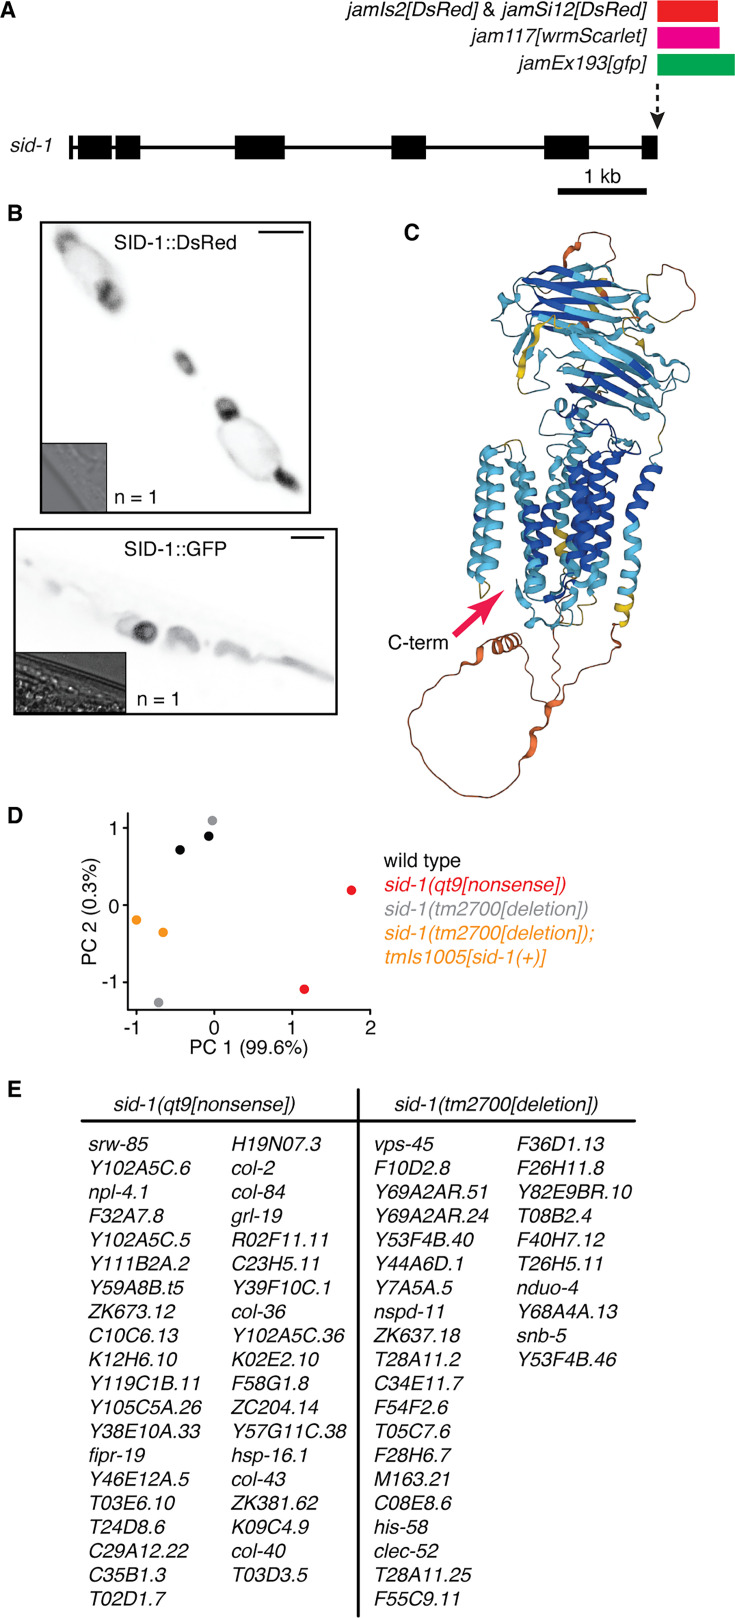
Figure 4—figure supplement 1. Unsuccessful attempts to functionally tag SID-1 and to identify SID-1-dependent genes. (A) Schematic illustrating the tagging of sid-1 (box, exon; line, intron) at the 3’ end to generate fusion proteins with fluorophores (GFP, DsRed, or wrmScarlet) tagged at the C-terminus. (B) Images showing subcellularly localized fluorescence (black) from SID-1::DsRed (top) and SID-1::GFP (bottom) within muscle cells when expressed from multicopy transgenes. Scale bar = 10 µm and insets show brightfield images. (C) Structure of SID-1 predicted by AlphaFold shaded based on pLDDT scores (blue/cyan, high; yellow/orange, low). Red arrow indicates the C-terminus. (D) Principal component analysis of RNA-seq experiment comparing transcriptomes from wild-type, sid-1(qt9[nonsense]), sid-1(tm2700[deletion]), and sid-1(tm2700[deletion]); tmIs1005[sid-1(+)] animals. (E) List of sid-1-dependent genes identified by comparing polyA+ RNA from sid-1(qt9[nonsense]) animals with wild-type animals (left) and by comparing sid-1(tm2700[deletion]) animals with sid-1(tm2700[deletion]); tmIs1005[sid-1(+)] animals (right).
Figure 4—figure supplement 1. Unsuccessful attempts to functionally tag SID-1 and to identify SID-1-dependent genes. (A) Schematic illustrating the tagging of sid-1 (box, exon; line, intron) at the 3’ end to generate fusion proteins with fluorophores (GFP, DsRed, or wrmScarlet) tagged at the C-terminus. (B) Images showing subcellularly localized fluorescence (black) from SID-1::DsRed (top) and SID-1::GFP (bottom) within muscle cells when expressed from multicopy transgenes. Scale bar = 10 µm and insets show brightfield images. (C) Structure of SID-1 predicted by AlphaFold shaded based on pLDDT scores (blue/cyan, high; yellow/orange, low). Red arrow indicates the C-terminus. (D) Principal component analysis of RNA-seq experiment comparing transcriptomes from wild-type, sid-1(qt9[nonsense]), sid-1(tm2700[deletion]), and sid-1(tm2700[deletion]); tmIs1005[sid-1(+)] animals. (E) List of sid-1-dependent genes identified by comparing polyA+ RNA from sid-1(qt9[nonsense]) animals with wild-type animals (left) and by comparing sid-1(tm2700[deletion]) animals with sid-1(tm2700[deletion]); tmIs1005[sid-1(+)] animals (right).CC BY · PubMed Central
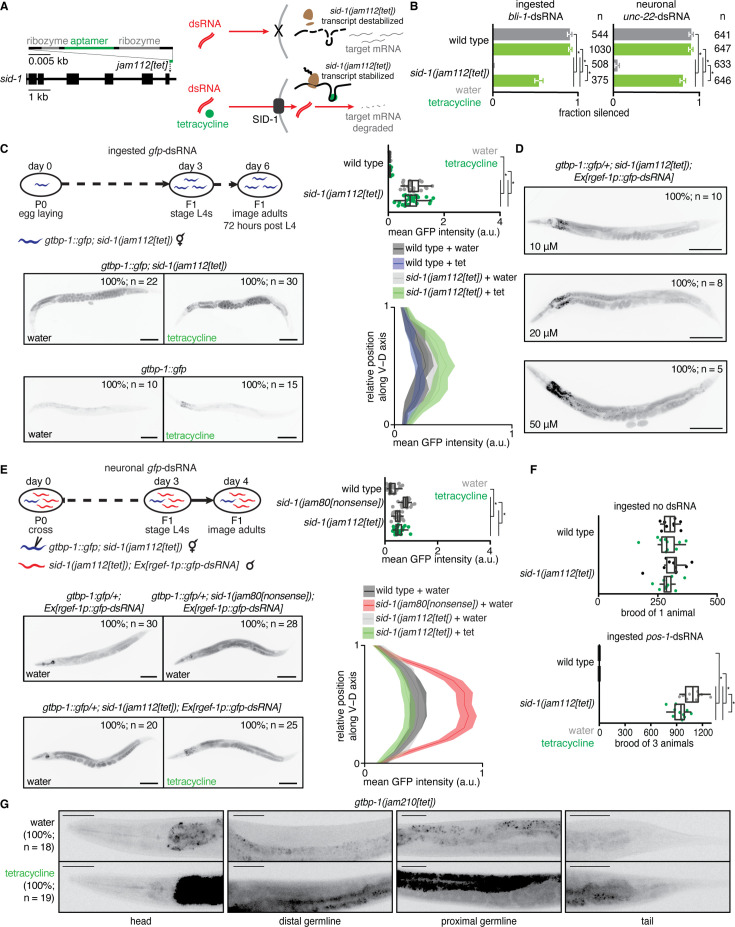
Figure 4—figure supplement 2. Tetracycline-induced functional rescue of sid-1 expression is evident in somatic tissues but not within the germline. (A) Schematic illustrating a cell expressing sid-1 transcript with a tetracycline aptazyme (Wurmthaler et al., 2019) inserted into the sid-1 3’UTR (left) in the presence (bottom right) or absence (top right) of tetracycline. Tetracycline stabilizes sid-1 transcripts by inhibiting ribozyme-based cleavage in the 3’UTR and thereby allows for the expression of SID-1 protein and dsRNA import. (B) Fraction of wild-type or sid-1(jam112[tet]) animals silenced after ingestion of bli-1-dsRNA (left) or expression of neuronal unc-22-dsRNA (right) in the presence of water (grey bars) or 10 μM tetracycline (green bars). Numbers of animals scored for silencing (n) are depicted. (C) The extent of gfp silencing in gtbp-1::gfp; sid-1(jam112[tet]) day 3 adult animals after ingestion of gfp-dsRNA in the presence of water or 10 μM tetracycline. A schematic illustrating the experimental design (top left), representative images of animals from each condition with numbers of animals imaged (n) and percentages of animals represented (bottom left), and quantification of representative germline (top right) and somatic (bottom right) GTBP-1::GFP intensity (a.u.) are depicted. Mean germline GFP intensity was measured in representative regions of the posterior germline and somatic GFP intensity was measured along a dorsal to ventral axis in the tail region (shaded region represents 95% CI) to avoid increased autofluorescence in the intestines of animals exposed to tetracycline. Scale bars, 100 μm. (D) Representative images of gtbp-1::gfp; sid-1(jam112[tet]) F1 day 1 adult animals after P0 and F1 ingestion of gfp-dsRNA until day 1 of F1 adulthood in the presence of different concentrations of tetracycline (10 μM, 20 μM, 50 μM). Higher concentrations of tetracycline did not enhance silencing in gtbp-1::gfp; sid-1(jam112[tet]) animals. Scale bar, 100 μm. (E) The extent of gfp silencing in cross progeny of gtbp-1::gfp; sid-1(jam112[tet]) hermaphrodites injected with water or 10 μM tetracycline and sid-1(jam112[tet]); Ex[rgef-1p::gfp-dsRNA] males in the presence of water or 10 μM tetracycline. A schematic illustrating the experimental design including injection of gtbp-1::gfp; sid-1(jam112[tet]) hermaphrodites with water or 10 μM tetracycline (top left), representative images of animals with the Ex[rgef-1p::gfp-dsRNA] array from each condition with numbers of animals imaged (n) and percentages of animals represented (bottom left), and quantification of representative germline (top right) and somatic (bottom right) GFP intensity (a.u.) as in (C) are depicted. Scale bar, 100 μm. (F) Total brood of wild-type or sid-1(jam112[tet]) animals after culturing on OP50 E. coli or pos-1-dsRNA bacteria in the presence of water or 10 μM tetracycline. Silencing by pos-1-dsRNA typically results in inviable embryos (wild type, bottom), but culturing sid-1(jam112[tet]) with 10 μM tetracycline and pos-1-dsRNA only resulted in a minor decrease in brood size (sid-1(jam112[tet]), bottom). This decrease was not observed when sid-1(jam112[tet]) animals were cultured on 10 μM tetracycline plates in the absence of pos-1-dsRNA (top, brood of 1 animal; bottom, brood of 3 animals). (G) Representative fluorescence images of GTBP-1::GFP (black) in the heads, distal germlines, proximal germlines, and tails of gtbp-1::gfp animals with a tetracycline-aptazyme sequence inserted into the gtbp-1::gfp 3’UTR (gtbp-1(jam210[tet])) after culturing with water or 10 μM tetracycline. The numbers of animals imaged (n) and the percentages of animals with the represented expression patterns are depicted. An increase in GTBP-1::GFP intensity was observed in the soma and germline, but increased fluorescence in the intestine could not be distinguished from increased autofluorescence caused by culturing with 10 μM tetracycline. Scale bar, 50 μm.
Figure 4—figure supplement 2. Tetracycline-induced functional rescue of sid-1 expression is evident in somatic tissues but not within the germline. (A) Schematic illustrating a cell expressing sid-1 transcript with a tetracycline aptazyme (Wurmthaler et al., 2019) inserted into the sid-1 3’UTR (left) in the presence (bottom right) or absence (top right) of tetracycline. Tetracycline stabilizes sid-1 transcripts by inhibiting ribozyme-based cleavage in the 3’UTR and thereby allows for the expression of SID-1 protein and dsRNA import. (B) Fraction of wild-type or sid-1(jam112[tet]) animals silenced after ingestion of bli-1-dsRNA (left) or expression of neuronal unc-22-dsRNA (right) in the presence of water (grey bars) or 10 μM tetracycline (green bars). Numbers of animals scored for silencing (n) are depicted. (C) The extent of gfp silencing in gtbp-1::gfp; sid-1(jam112[tet]) day 3 adult animals after ingestion of gfp-dsRNA in the presence of water or 10 μM tetracycline. A schematic illustrating the experimental design (top left), representative images of animals from each condition with numbers of animals imaged (n) and percentages of animals represented (bottom left), and quantification of representative germline (top right) and somatic (bottom right) GTBP-1::GFP intensity (a.u.) are depicted. Mean germline GFP intensity was measured in representative regions of the posterior germline and somatic GFP intensity was measured along a dorsal to ventral axis in the tail region (shaded region represents 95% CI) to avoid increased autofluorescence in the intestines of animals exposed to tetracycline. Scale bars, 100 μm. (D) Representative images of gtbp-1::gfp; sid-1(jam112[tet]) F1 day 1 adult animals after P0 and F1 ingestion of gfp-dsRNA until day 1 of F1 adulthood in the presence of different concentrations of tetracycline (10 μM, 20 μM, 50 μM). Higher concentrations of tetracycline did not enhance silencing in gtbp-1::gfp; sid-1(jam112[tet]) animals. Scale bar, 100 μm. (E) The extent of gfp silencing in cross progeny of gtbp-1::gfp; sid-1(jam112[tet]) hermaphrodites injected with water or 10 μM tetracycline and sid-1(jam112[tet]); Ex[rgef-1p::gfp-dsRNA] males in the presence of water or 10 μM tetracycline. A schematic illustrating the experimental design including injection of gtbp-1::gfp; sid-1(jam112[tet]) hermaphrodites with water or 10 μM tetracycline (top left), representative images of animals with the Ex[rgef-1p::gfp-dsRNA] array from each condition with numbers of animals imaged (n) and percentages of animals represented (bottom left), and quantification of representative germline (top right) and somatic (bottom right) GFP intensity (a.u.) as in (C) are depicted. Scale bar, 100 μm. (F) Total brood of wild-type or sid-1(jam112[tet]) animals after culturing on OP50 E. coli or pos-1-dsRNA bacteria in the presence of water or 10 μM tetracycline. Silencing by pos-1-dsRNA typically results in inviable embryos (wild type, bottom), but culturing sid-1(jam112[tet]) with 10 μM tetracycline and pos-1-dsRNA only resulted in a minor decrease in brood size (sid-1(jam112[tet]), bottom). This decrease was not observed when sid-1(jam112[tet]) animals were cultured on 10 μM tetracycline plates in the absence of pos-1-dsRNA (top, brood of 1 animal; bottom, brood of 3 animals). (G) Representative fluorescence images of GTBP-1::GFP (black) in the heads, distal germlines, proximal germlines, and tails of gtbp-1::gfp animals with a tetracycline-aptazyme sequence inserted into the gtbp-1::gfp 3’UTR (gtbp-1(jam210[tet])) after culturing with water or 10 μM tetracycline. The numbers of animals imaged (n) and the percentages of animals with the represented expression patterns are depicted. An increase in GTBP-1::GFP intensity was observed in the soma and germline, but increased fluorescence in the intestine could not be distinguished from increased autofluorescence caused by culturing with 10 μM tetracycline. Scale bar, 50 μm.CC BY · PubMed Central
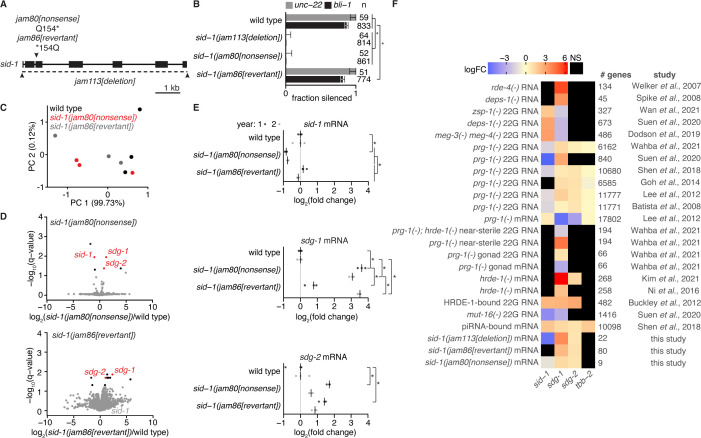
Figure 5. Ancestral loss of SID-1 causes transgenerational changes in the mRNA levels of two germline genes that are subject to RNA regulation. (A) Schematic of modifications at the sid-1 gene generated using Cas9-mediated genome editing. Deletion of the entire coding sequence (jam113[deletion]), a nonsense mutation (jam80[nonsense]), and its reversion to wild-type sequence (jam86[revertant]) are depicted. (B) Fractions of animals with the indicated genotypes that show silencing in response to unc-22-dsRNA (grey) or bli-1-dsRNA (black). Numbers of animals scored (n), significant differences using two-tailed test with Wilson’s estimates for single proportions (asterisks, P<0.05 with Bonferroni correction) and 95% CI (error bars) are indicated. (C) Principal components explaining the variance between wild type (black), sid-1(jam80[nonsense]) (red), and sid-1(jam86[revertant]) (grey) polyA+ RNA samples. Almost all of the variance between samples is explained by PC 1. (D) Volcano plots of changes in the abundance of polyA+ RNA in sid-1(jam80[nonsense]) (top) and sid-1(jam86[revertant]) (bottom) animals compared with wild-type animals (black, q<0.05; red, both q<0.05 and change in the same direction in sid-1(jam80[nonsense]) and sid-1(jam113[deletion]); see Figure 5—figure supplement 1). While sid-1 transcript levels in sid-1(jam86[revertant]) are comparable to that in wild type (grey), sdg-1 (W09B7.2/F07B7.2) and sdg-2 (Y102A5C.36) transcript levels remain elevated in sid-1(jam86[revertant]) (red). (E) Levels of spliced sid-1 (top), sdg-1 (middle) and sdg-2 (bottom) transcripts measured using RT-qPCR. The median of three technical replicates is plotted for each of three biological replicates (bar indicates median) assayed before and after 1 year of passaging animals (year 1, dark grey; year 2, light grey). Asterisks indicate p<0.05 with Bonferroni correction using two-tailed Student’s t-test. (F) Heatmap showing changes in the levels of transcripts (total RNA or mRNA) or antisense small RNAs (22G RNA) from sid-1, sdg-1, sdg-2, and tbb-2 (abundant germline transcript for comparison). Fold changes (expressed as LogFC, indicating log2 for (m)RNA, log10 for piRNA binding, and log10 for 22G RNA) were deduced by integrating reports (study) of 21 experiments that identify subsets of genes as being subject to RNA-mediated regulation within the germline (# genes). These prior studies include comparisons of RNA or 22G RNA from wild-type animals with that from mutant animals (e.g. mut-16(-) 22G RNA), biochemical detection of piRNA binding to transcripts (piRNA-bound mRNA), and biochemical detection of 22G RNA binding to an Argonaute (HRDE-1-bound 22G RNA). ‘NS’ indicates cases where changes, if any, were not significant based on the criteria used in the study. A conservative value of two-fold is assigned to all genes reported as changing >two-fold in Ni et al., 2016.
Figure 5. Ancestral loss of SID-1 causes transgenerational changes in the mRNA levels of two germline genes that are subject to RNA regulation. (A) Schematic of modifications at the sid-1 gene generated using Cas9-mediated genome editing. Deletion of the entire coding sequence (jam113[deletion]), a nonsense mutation (jam80[nonsense]), and its reversion to wild-type sequence (jam86[revertant]) are depicted. (B) Fractions of animals with the indicated genotypes that show silencing in response to unc-22-dsRNA (grey) or bli-1-dsRNA (black). Numbers of animals scored (n), significant differences using two-tailed test with Wilson’s estimates for single proportions (asterisks, P<0.05 with Bonferroni correction) and 95% CI (error bars) are indicated. (C) Principal components explaining the variance between wild type (black), sid-1(jam80[nonsense]) (red), and sid-1(jam86[revertant]) (grey) polyA+ RNA samples. Almost all of the variance between samples is explained by PC 1. (D) Volcano plots of changes in the abundance of polyA+ RNA in sid-1(jam80[nonsense]) (top) and sid-1(jam86[revertant]) (bottom) animals compared with wild-type animals (black, q<0.05; red, both q<0.05 and change in the same direction in sid-1(jam80[nonsense]) and sid-1(jam113[deletion]); see Figure 5—figure supplement 1). While sid-1 transcript levels in sid-1(jam86[revertant]) are comparable to that in wild type (grey), sdg-1 (W09B7.2/F07B7.2) and sdg-2 (Y102A5C.36) transcript levels remain elevated in sid-1(jam86[revertant]) (red). (E) Levels of spliced sid-1 (top), sdg-1 (middle) and sdg-2 (bottom) transcripts measured using RT-qPCR. The median of three technical replicates is plotted for each of three biological replicates (bar indicates median) assayed before and after 1 year of passaging animals (year 1, dark grey; year 2, light grey). Asterisks indicate p<0.05 with Bonferroni correction using two-tailed Student’s t-test. (F) Heatmap showing changes in the levels of transcripts (total RNA or mRNA) or antisense small RNAs (22G RNA) from sid-1, sdg-1, sdg-2, and tbb-2 (abundant germline transcript for comparison). Fold changes (expressed as LogFC, indicating log2 for (m)RNA, log10 for piRNA binding, and log10 for 22G RNA) were deduced by integrating reports (study) of 21 experiments that identify subsets of genes as being subject to RNA-mediated regulation within the germline (# genes). These prior studies include comparisons of RNA or 22G RNA from wild-type animals with that from mutant animals (e.g. mut-16(-) 22G RNA), biochemical detection of piRNA binding to transcripts (piRNA-bound mRNA), and biochemical detection of 22G RNA binding to an Argonaute (HRDE-1-bound 22G RNA). ‘NS’ indicates cases where changes, if any, were not significant based on the criteria used in the study. A conservative value of two-fold is assigned to all genes reported as changing >two-fold in Ni et al., 2016.CC BY · PubMed Central
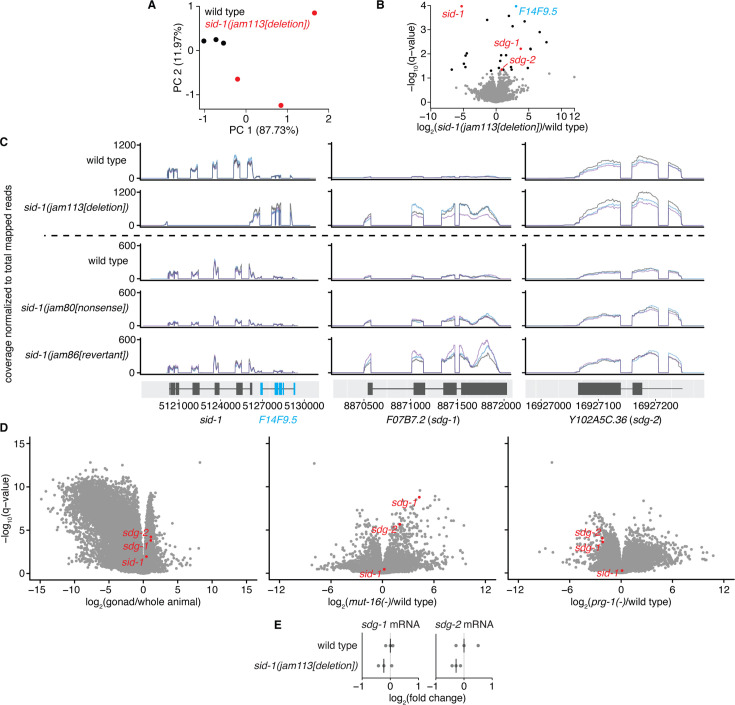
Figure 5—figure supplement 1. Selective disruption of sid-1 followed by restoration to wild type reveals sid-1-dependent transcripts expressed in the germline that show heritable change. (A) Principal components explaining the variance between wild-type (black) and sid-1(jam113[deletion]) (red) animals. (B) Volcano plots of changes in the abundance of polyA+ RNA in sid-1(jam113[deletion]) animals compared with wild-type animals (black, q<0.05; red, q<0.05 and with change in the same direction in sid-1(jam80[nonsense]); see Figure 5D, top). (C) Read coverage in biological triplicate (black, blue and purple) at sid-1 and F14F9.5 (left), W09B7.2/F07B7.2 (sdg-1) (represented by F07B7.2 locus, middle) and Y102A5C.36 (sdg-2) (right) of polyA+ RNA in wild-type and sid-1(jam113[deletion]) animals (top), and in wild-type, sid-1(jam80[nonsense]), and sid-1(jam86[revertant]) animals (bottom) normalized to total mapped reads per sample. Deletion of sid-1 coding sequence caused accumulation of transcripts from F14F9.5 (blue), requiring point mutation (jam80[nonsense]) for selective disruption of sid-1 (see Figure 5). (D) Volcano plots of changes in the abundance of RNA in wild-type gonads vs. whole animals (left), mut-16(-) vs. wild-type animals (middle), and prg-1(-) vs. wild-type animals (right) using data from Reed et al., 2020. sdg-1, sdg-2 and sid-1 transcripts are highlighted (red). (E) Levels of spliced sdg-1 and sdg-2 transcripts in animals of the indicated genotypes measured using RT-qPCR. The median (line) of three technical replicates is plotted for each of three biological replicates. p>0.05 with Bonferroni correction using two-tailed Student’s t-test for wild type to mutant comparisons. Levels of sid-1 transcripts were not detectable in sid-1(jam113[deletion]) animals due to absence of sid-1 coding sequence (data not shown).
Figure 5—figure supplement 1. Selective disruption of sid-1 followed by restoration to wild type reveals sid-1-dependent transcripts expressed in the germline that show heritable change. (A) Principal components explaining the variance between wild-type (black) and sid-1(jam113[deletion]) (red) animals. (B) Volcano plots of changes in the abundance of polyA+ RNA in sid-1(jam113[deletion]) animals compared with wild-type animals (black, q<0.05; red, q<0.05 and with change in the same direction in sid-1(jam80[nonsense]); see Figure 5D, top). (C) Read coverage in biological triplicate (black, blue and purple) at sid-1 and F14F9.5 (left), W09B7.2/F07B7.2 (sdg-1) (represented by F07B7.2 locus, middle) and Y102A5C.36 (sdg-2) (right) of polyA+ RNA in wild-type and sid-1(jam113[deletion]) animals (top), and in wild-type, sid-1(jam80[nonsense]), and sid-1(jam86[revertant]) animals (bottom) normalized to total mapped reads per sample. Deletion of sid-1 coding sequence caused accumulation of transcripts from F14F9.5 (blue), requiring point mutation (jam80[nonsense]) for selective disruption of sid-1 (see Figure 5). (D) Volcano plots of changes in the abundance of RNA in wild-type gonads vs. whole animals (left), mut-16(-) vs. wild-type animals (middle), and prg-1(-) vs. wild-type animals (right) using data from Reed et al., 2020. sdg-1, sdg-2 and sid-1 transcripts are highlighted (red). (E) Levels of spliced sdg-1 and sdg-2 transcripts in animals of the indicated genotypes measured using RT-qPCR. The median (line) of three technical replicates is plotted for each of three biological replicates. p>0.05 with Bonferroni correction using two-tailed Student’s t-test for wild type to mutant comparisons. Levels of sid-1 transcripts were not detectable in sid-1(jam113[deletion]) animals due to absence of sid-1 coding sequence (data not shown).CC BY · PubMed Central
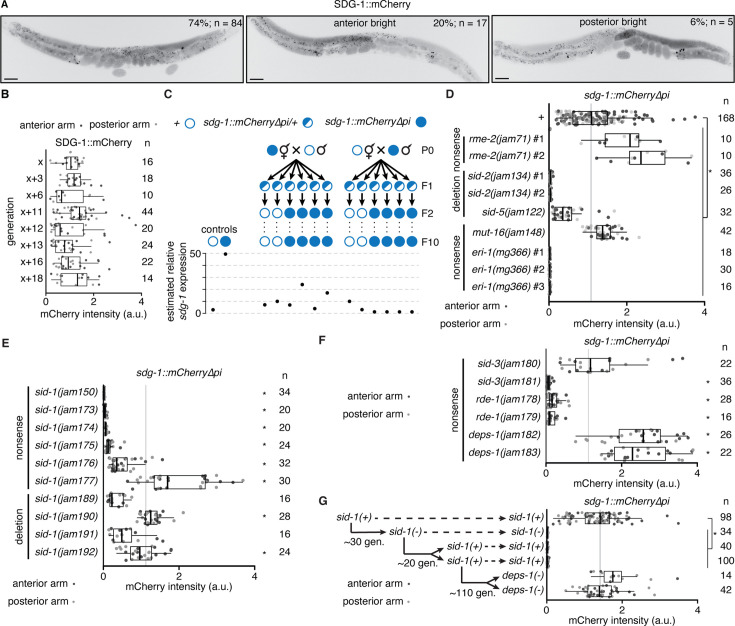
Figure 6. The sdg-1 gene is prone to stochastic changes in gene expression that can become heritable. (A) Representative images showing fluorescence of SDG-1::mCherry (black) in a wild-type background. While most animals showed symmetric expression in the germline (left), animals with >two-fold difference in fluorescence between both gonad arms (bright anterior, middle and bright posterior, right) were also observed. Punctate fluorescence in the intestine likely represents autofluorescence. Scale bar, 50 μm. (B) Quantification of SDG-1::mCherry fluorescence intensity (arbitrary units, a.u.) in adult gonad arms (anterior arm, dark grey; posterior arm, light grey) of sdg-1(jam137[mCherry∆pi]) animals starting in one generation (x) and continuing in successive generations as indicated. Numbers of gonad arms quantified (n) is indicated. Expression in one generation was not significantly different when compared to that in the previous tested generation using Mann-Whitney U test for two-sided comparisons and Bonferroni correction. (C) Lineages and estimated relative sdg-1 expression 10 generations after mating wild-type (open circle) males with sdg-1::mCherry∆pi (filled circle) hermaphrodites and vice versa, and isolating sdg-1(+) or sdg-1::mCherry animals from F1 heterozygotes (half-filled circle). Expression of sdg-1 in the F10 generation was measured by RT-qPCR of sdg-1 mRNA purified from pooled wild-type animals of mixed stages or by quantification of SDG-1::mCherry fluorescence in gonad arms of adult sdg-1::mCherry∆pi animals. Relative levels of sdg-1 mRNA and SDG-1::mCherry fluorescence intensity were converted to units of estimated relative sdg-1 expression (see Materials and methods) for comparison. See Figure 6—figure supplement 2A for raw data. (D–F) Fluorescence intensity measurements (quantified as in B) in adult animals with sdg-1::mCherry∆pi (+) and additionally with mutations in genes introduced through genetic crosses (in regulators of dsRNA import rme-2, sid-2 or sid-5, or in regulators of RNA silencing mut-16 or eri-1) or through genome editing (in regulators of dsRNA import sid-1 or sid-3, or in regulators of RNA silencing rde-1 or deps-1). Asterisks indicate p<0.05 with Bonferroni correction using Mann-Whitney U test for two-sided comparisons between animals with sdg-1::mCherry∆pi (+) and animals with additional mutations. Nonsense mutations (nonsense) or deletion utations (deletion) introduced through genetic crosses (isolate numbers #1, #2, etc. in D) or genome editing (different alleles in E and F) and numbers of gonad arms (n) quantified for each isolate are indicated. Mutations in genes required for dsRNA import or subsequent silencing resulted in fewer animals with asymmetric fluorescence between gonad arms (a combined proportion of 21/197 for sid-1, sid-3, rde-1 and deps-1 mutants versus 22/84 for wild type, p=0.0009 using two-tailed test with Wilson’s estimates for single proportions). Animals with at least one gonad arm brighter than the dimmest wild-type gonad arm in (A) and with asymmetric gonad arms were found in different genotypes (anterior bright: sid-1(-) – 5/122, sid-3(-) – 1/29, rde-1(-) – 2/22, deps-1(-) – 4/24, and posterior bright: sid-1(-) – 6/122, rde-1(-) – 2/22, deps-1(-) – 1/24). (G) Fluorescence intensity measurements as in (B) of animals with sdg-1::mCherry∆pi that show loss of fluorescence when a nonsense mutation is introduced in sid-1 using genome editing ~30 generations (gen.) later remain changed despite reversion of sid-1 nonsense mutation to wild-type sequence after ~20 additional generations. Subsequent mutation of deps-1 after another ~110 generations restored SDG-1::mCherry fluorescence to wild-type levels. Also see Figure 6—figure supplements 1 and 2.
Figure 6. The sdg-1 gene is prone to stochastic changes in gene expression that can become heritable. (A) Representative images showing fluorescence of SDG-1::mCherry (black) in a wild-type background. While most animals showed symmetric expression in the germline (left), animals with >two-fold difference in fluorescence between both gonad arms (bright anterior, middle and bright posterior, right) were also observed. Punctate fluorescence in the intestine likely represents autofluorescence. Scale bar, 50 μm. (B) Quantification of SDG-1::mCherry fluorescence intensity (arbitrary units, a.u.) in adult gonad arms (anterior arm, dark grey; posterior arm, light grey) of sdg-1(jam137[mCherry∆pi]) animals starting in one generation (x) and continuing in successive generations as indicated. Numbers of gonad arms quantified (n) is indicated. Expression in one generation was not significantly different when compared to that in the previous tested generation using Mann-Whitney U test for two-sided comparisons and Bonferroni correction. (C) Lineages and estimated relative sdg-1 expression 10 generations after mating wild-type (open circle) males with sdg-1::mCherry∆pi (filled circle) hermaphrodites and vice versa, and isolating sdg-1(+) or sdg-1::mCherry animals from F1 heterozygotes (half-filled circle). Expression of sdg-1 in the F10 generation was measured by RT-qPCR of sdg-1 mRNA purified from pooled wild-type animals of mixed stages or by quantification of SDG-1::mCherry fluorescence in gonad arms of adult sdg-1::mCherry∆pi animals. Relative levels of sdg-1 mRNA and SDG-1::mCherry fluorescence intensity were converted to units of estimated relative sdg-1 expression (see Materials and methods) for comparison. See Figure 6—figure supplement 2A for raw data. (D–F) Fluorescence intensity measurements (quantified as in B) in adult animals with sdg-1::mCherry∆pi (+) and additionally with mutations in genes introduced through genetic crosses (in regulators of dsRNA import rme-2, sid-2 or sid-5, or in regulators of RNA silencing mut-16 or eri-1) or through genome editing (in regulators of dsRNA import sid-1 or sid-3, or in regulators of RNA silencing rde-1 or deps-1). Asterisks indicate p<0.05 with Bonferroni correction using Mann-Whitney U test for two-sided comparisons between animals with sdg-1::mCherry∆pi (+) and animals with additional mutations. Nonsense mutations (nonsense) or deletion utations (deletion) introduced through genetic crosses (isolate numbers #1, #2, etc. in D) or genome editing (different alleles in E and F) and numbers of gonad arms (n) quantified for each isolate are indicated. Mutations in genes required for dsRNA import or subsequent silencing resulted in fewer animals with asymmetric fluorescence between gonad arms (a combined proportion of 21/197 for sid-1, sid-3, rde-1 and deps-1 mutants versus 22/84 for wild type, p=0.0009 using two-tailed test with Wilson’s estimates for single proportions). Animals with at least one gonad arm brighter than the dimmest wild-type gonad arm in (A) and with asymmetric gonad arms were found in different genotypes (anterior bright: sid-1(-) – 5/122, sid-3(-) – 1/29, rde-1(-) – 2/22, deps-1(-) – 4/24, and posterior bright: sid-1(-) – 6/122, rde-1(-) – 2/22, deps-1(-) – 1/24). (G) Fluorescence intensity measurements as in (B) of animals with sdg-1::mCherry∆pi that show loss of fluorescence when a nonsense mutation is introduced in sid-1 using genome editing ~30 generations (gen.) later remain changed despite reversion of sid-1 nonsense mutation to wild-type sequence after ~20 additional generations. Subsequent mutation of deps-1 after another ~110 generations restored SDG-1::mCherry fluorescence to wild-type levels. Also see Figure 6—figure supplements 1 and 2.CC BY · PubMed Central
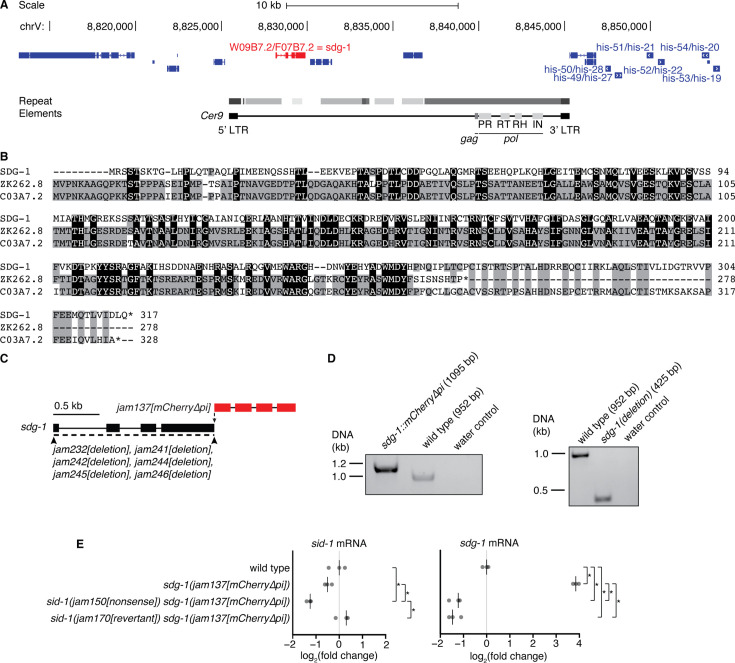
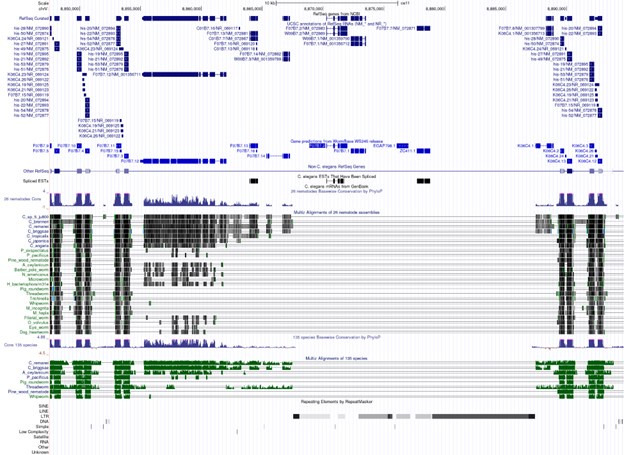
Figure 6—figure supplement 1. The sid-1-dependent gene sdg-1 is expressed from two identical loci (W09B7.2/F07B7.2) and loss of its expression in sid-1(nonsense) animals fails to recover in sid-1(revertant) animals. (A) Schematic adapted from UCSC Genome Browser (Perez et al., 2025) depicting W09B7.2/F07B7.2 (red) located within a repeated ~40 kb locus on chromosome V (8813207–8854700 depicted; duplicate locus at 8855302–8896495) that includes many histone genes (dark blue; duplicate genes also depicted). W09B7.2/F07B7.2 are located within full-length Cer9 retrotransposons with repeated regions in grey (darker color indicates fewer repeat element-associated mismatches/insertions/deletions). Loci encoding gag and pol elements (PR: protease, RT: reverse transcriptase, RH: RNaseH, IN: integrase) within Cer9 are depicted. (B) Alignment of the SDG-1 protein sequence encoded by W09B7.2/F07B7.2 and the paralogs ZK262.8 and C03A7.2 with conserved residues between two (grey) or three (black) proteins highlighted. (C) Schematic depicting insertion of mCherry sequence that lacks piRNA binding sites (Zhang et al., 2018; Devanapally et al., 2021) at the 3’ end of sdg-1(jam137[mCherry∆pi]), as well as deletion of the sdg-1 coding sequence (jam232, jam241, jam242, jam244, jam245, and jam246). (D) Genotyping gels showing insertion of mCherry∆pi sequences (1095 bp) (left) or deletion of sdg-1 coding sequences (425 bp) (right) at both loci of sdg-1. Absence of wild-type bands in either case confirm genome editing of both copies. (E) Levels of spliced sid-1 (left) and sdg-1 (right) transcripts in wild-type animals and sdg-1(jam137[mCherry∆pi]) animals with a wild-type (+), sid-1(jam150[nonsense]) or sid-1(jam169[revertant]) background measured using RT-qPCR. The median of three technical replicates is plotted for each of three biological replicates (bar indicates median). Asterisks indicate p<0.05 with Bonferroni correction using two-tailed Student’s t-test.
Figure 6—figure supplement 1. The sid-1-dependent gene sdg-1 is expressed from two identical loci (W09B7.2/F07B7.2) and loss of its expression in sid-1(nonsense) animals fails to recover in sid-1(revertant) animals. (A) Schematic adapted from UCSC Genome Browser (Perez et al., 2025) depicting W09B7.2/F07B7.2 (red) located within a repeated ~40 kb locus on chromosome V (8813207–8854700 depicted; duplicate locus at 8855302–8896495) that includes many histone genes (dark blue; duplicate genes also depicted). W09B7.2/F07B7.2 are located within full-length Cer9 retrotransposons with repeated regions in grey (darker color indicates fewer repeat element-associated mismatches/insertions/deletions). Loci encoding gag and pol elements (PR: protease, RT: reverse transcriptase, RH: RNaseH, IN: integrase) within Cer9 are depicted. (B) Alignment of the SDG-1 protein sequence encoded by W09B7.2/F07B7.2 and the paralogs ZK262.8 and C03A7.2 with conserved residues between two (grey) or three (black) proteins highlighted. (C) Schematic depicting insertion of mCherry sequence that lacks piRNA binding sites (Zhang et al., 2018; Devanapally et al., 2021) at the 3’ end of sdg-1(jam137[mCherry∆pi]), as well as deletion of the sdg-1 coding sequence (jam232, jam241, jam242, jam244, jam245, and jam246). (D) Genotyping gels showing insertion of mCherry∆pi sequences (1095 bp) (left) or deletion of sdg-1 coding sequences (425 bp) (right) at both loci of sdg-1. Absence of wild-type bands in either case confirm genome editing of both copies. (E) Levels of spliced sid-1 (left) and sdg-1 (right) transcripts in wild-type animals and sdg-1(jam137[mCherry∆pi]) animals with a wild-type (+), sid-1(jam150[nonsense]) or sid-1(jam169[revertant]) background measured using RT-qPCR. The median of three technical replicates is plotted for each of three biological replicates (bar indicates median). Asterisks indicate p<0.05 with Bonferroni correction using two-tailed Student’s t-test.CC BY · PubMed Central
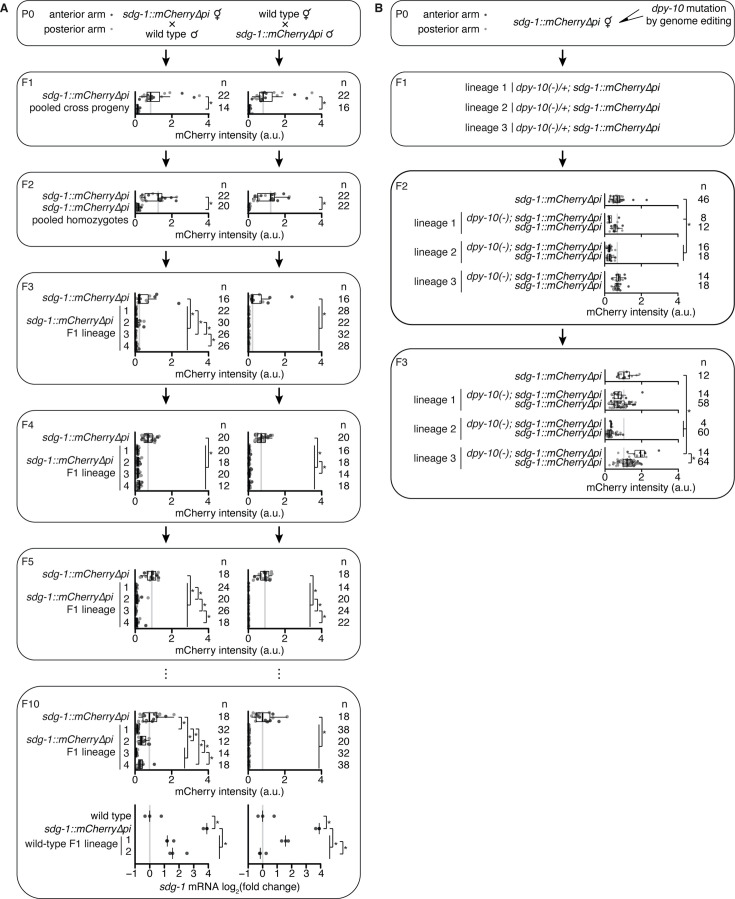
Figure 6—figure supplement 2. Mating but not genome editing can initiate distinct heritable changes in sdg-1 expression. (A) (P0 to F10, top) Quantification of SDG-1::mCherry fluorescence intensity (a.u.) in adult gonad arms (anterior arm, dark grey; posterior arm, light grey) across generations after mating hermaphrodite and male sdg-1(jam137[mCherry∆pi]) animals with male and hermaphrodite wild-type animals, respectively. The generations assayed and numbers of gonad arms quantified (n) are indicated. In F1 and F2, fluorescence intensity values of animals with lineages that were not propagated to F10 but were heterozygous or homozygous sdg-1(jam137[mCherry∆pi]), respectively, were pooled with values of animals with lineages that were propagated to F10. In F3 to F10, top, animals from four different F1 lineages were scored. Fluorescence intensity of animals descending from the self-progeny of P0 sdg-1(jam137[mCherry∆pi]) animals was measured in each generation and is depicted, with the same data plotted for each mating direction for comparison. Asterisk indicates p<0.05 with Bonferroni correction using Mann-Whitney U test for two-sided comparisons. (F10, bottom) Levels of spliced sdg-1 mRNA transcripts in wild-type animals, sdg-1(jam137[mCherry∆pi]) animals and two lineages of wild-type F10 progeny from each cross direction, measured using RT-qPCR. The median of three technical replicates is plotted for each of three biological replicates (bar indicates median). Asterisks indicate p<0.05 with Bonferroni correction using two-tailed Student’s t-test. (B) (P0 and F1) Schematic illustrating mutation of dpy-10 in three P0 lineages of sdg-1(jam137[mCherry∆pi]) animals and subsequent segregation of the dpy-10 mutation. (F2 and F3) Both dpy-10(-) and dpy-10(+) F2 and F3 animals from each of the three P0 lineages were imaged and SDG-1::mCherry intensity was quantified (a.u.) in adult gonad arms (anterior arm, dark grey; posterior arm, light grey). Minor differences in SDG-1::mCherry expression were observed between mutants and nonmutants in some cases, as well as between lineages. The numbers of gonad arms quantified (n) are depicted. Asterisks indicates p<0.05 with Bonferroni correction using Mann-Whitney U test for two-sided comparisons.
Figure 6—figure supplement 2. Mating but not genome editing can initiate distinct heritable changes in sdg-1 expression. (A) (P0 to F10, top) Quantification of SDG-1::mCherry fluorescence intensity (a.u.) in adult gonad arms (anterior arm, dark grey; posterior arm, light grey) across generations after mating hermaphrodite and male sdg-1(jam137[mCherry∆pi]) animals with male and hermaphrodite wild-type animals, respectively. The generations assayed and numbers of gonad arms quantified (n) are indicated. In F1 and F2, fluorescence intensity values of animals with lineages that were not propagated to F10 but were heterozygous or homozygous sdg-1(jam137[mCherry∆pi]), respectively, were pooled with values of animals with lineages that were propagated to F10. In F3 to F10, top, animals from four different F1 lineages were scored. Fluorescence intensity of animals descending from the self-progeny of P0 sdg-1(jam137[mCherry∆pi]) animals was measured in each generation and is depicted, with the same data plotted for each mating direction for comparison. Asterisk indicates p<0.05 with Bonferroni correction using Mann-Whitney U test for two-sided comparisons. (F10, bottom) Levels of spliced sdg-1 mRNA transcripts in wild-type animals, sdg-1(jam137[mCherry∆pi]) animals and two lineages of wild-type F10 progeny from each cross direction, measured using RT-qPCR. The median of three technical replicates is plotted for each of three biological replicates (bar indicates median). Asterisks indicate p<0.05 with Bonferroni correction using two-tailed Student’s t-test. (B) (P0 and F1) Schematic illustrating mutation of dpy-10 in three P0 lineages of sdg-1(jam137[mCherry∆pi]) animals and subsequent segregation of the dpy-10 mutation. (F2 and F3) Both dpy-10(-) and dpy-10(+) F2 and F3 animals from each of the three P0 lineages were imaged and SDG-1::mCherry intensity was quantified (a.u.) in adult gonad arms (anterior arm, dark grey; posterior arm, light grey). Minor differences in SDG-1::mCherry expression were observed between mutants and nonmutants in some cases, as well as between lineages. The numbers of gonad arms quantified (n) are depicted. Asterisks indicates p<0.05 with Bonferroni correction using Mann-Whitney U test for two-sided comparisons.CC BY · PubMed Central
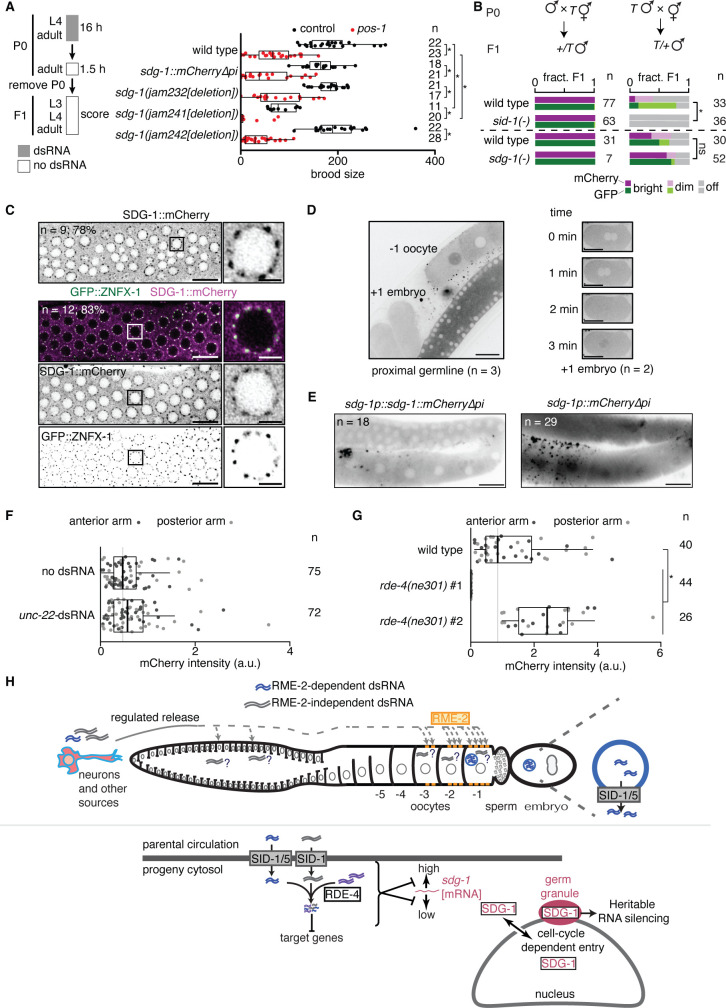
Figure 7. SID-1 modifies RNA regulation within the germline, potentially through sdg-1 and other sid-1-dependent genes. (A) (left) Schematic of assay for sensitive detection of pos-1 silencing by ingested dsRNA. (right) Numbers of developed progeny (> 3rd larval stage) laid by wild-type animals, animals with a deletion (∆) in sdg-1 (jam232, jam241, jam242) or animals with overexpression (sdg-1::mCherry∆pi) of sdg-1 exposed to pos-1 dsRNA (red) or control dsRNA (black) for 16 hr are plotted. Asterisks indicate p<0.05 using Mann-Whitney U test for two-sided comparisons with Bonferroni correction. (B) Cross progeny males that inherited the mex-5p::mCherry::h2b::gfp::h2b transgene (T; Devanapally et al., 2021; also used in Figure 2) from maternal (left) or paternal (right) parents, both of wild-type, sid-1(-), or sdg-1(-) background, were scored for expression of mCherry and GFP (bright, dim, off). Wild-type data for top set (n=77 and n=33) are replotted from Devanapally et al., 2021 for comparison. Dashed line separates independent experiments. Asterisk indicates p<0.05 with Bonferroni correction using χ2 test; n.s. indicates not significant. (C) Representative AiryScan images of the distal germline (left; scale bar, 10 µm) or single germline nuclei (right; scale bar, 2 µm) showing SDG-1::mCherry alone (top) or with GFP::ZNFX-1 (bottom, merge and single channel images). The number of animals imaged (n) and the percentage that show enrichment of SDG-1::mCherry in perinuclear foci are indicated. Sites of SDG-1::mCherry enrichment coincide with GFP::ZNFX-1 localization. Boxes in left mark the nuclei shown in right. (D) Representative images showing entry of SDG-1::mCherry into the nucleus in –1 oocytes (left) and upon pronuclear fusion in early embryos during the time course indicated (right). Numbers of germlines and embryos imaged are indicated. Scale bars, 20 µm. Also see Videos 1–4. (E) Representative image of the hermaphrodite germline in animals with a translational (left) or transcriptional (right) reporter of sdg-1. Scale bar, 20 µm. Apparent extracellular punctae of SDG-1::mCherry and mCherry surrounding the proximal germline requires further study, but could be non-specific because similar localization is observed in animals with other promoters driving mCherry expression, but not GFP expression, in the germline (data not shown). The numbers of animals with the depicted fluorescence pattern are indicated. (F and G) Response of the transcriptional sdg-1 reporter (sdg-1p::mCherry∆pi[sdg-1(∆)]::sdg-1 3' UTR) to the addition of unc-22-dsRNA (F) or loss of rde-4 (G). Quantification and asterisk are as in Figure 6. (H) Models for dsRNA import into the germline (top) and subsequent RNA-mediated regulation of sdg-1 (bottom). See text for details.
Figure 7. SID-1 modifies RNA regulation within the germline, potentially through sdg-1 and other sid-1-dependent genes. (A) (left) Schematic of assay for sensitive detection of pos-1 silencing by ingested dsRNA. (right) Numbers of developed progeny (> 3rd larval stage) laid by wild-type animals, animals with a deletion (∆) in sdg-1 (jam232, jam241, jam242) or animals with overexpression (sdg-1::mCherry∆pi) of sdg-1 exposed to pos-1 dsRNA (red) or control dsRNA (black) for 16 hr are plotted. Asterisks indicate p<0.05 using Mann-Whitney U test for two-sided comparisons with Bonferroni correction. (B) Cross progeny males that inherited the mex-5p::mCherry::h2b::gfp::h2b transgene (T; Devanapally et al., 2021; also used in Figure 2) from maternal (left) or paternal (right) parents, both of wild-type, sid-1(-), or sdg-1(-) background, were scored for expression of mCherry and GFP (bright, dim, off). Wild-type data for top set (n=77 and n=33) are replotted from Devanapally et al., 2021 for comparison. Dashed line separates independent experiments. Asterisk indicates p<0.05 with Bonferroni correction using χ2 test; n.s. indicates not significant. (C) Representative AiryScan images of the distal germline (left; scale bar, 10 µm) or single germline nuclei (right; scale bar, 2 µm) showing SDG-1::mCherry alone (top) or with GFP::ZNFX-1 (bottom, merge and single channel images). The number of animals imaged (n) and the percentage that show enrichment of SDG-1::mCherry in perinuclear foci are indicated. Sites of SDG-1::mCherry enrichment coincide with GFP::ZNFX-1 localization. Boxes in left mark the nuclei shown in right. (D) Representative images showing entry of SDG-1::mCherry into the nucleus in –1 oocytes (left) and upon pronuclear fusion in early embryos during the time course indicated (right). Numbers of germlines and embryos imaged are indicated. Scale bars, 20 µm. Also see Videos 1–4. (E) Representative image of the hermaphrodite germline in animals with a translational (left) or transcriptional (right) reporter of sdg-1. Scale bar, 20 µm. Apparent extracellular punctae of SDG-1::mCherry and mCherry surrounding the proximal germline requires further study, but could be non-specific because similar localization is observed in animals with other promoters driving mCherry expression, but not GFP expression, in the germline (data not shown). The numbers of animals with the depicted fluorescence pattern are indicated. (F and G) Response of the transcriptional sdg-1 reporter (sdg-1p::mCherry∆pi[sdg-1(∆)]::sdg-1 3' UTR) to the addition of unc-22-dsRNA (F) or loss of rde-4 (G). Quantification and asterisk are as in Figure 6. (H) Models for dsRNA import into the germline (top) and subsequent RNA-mediated regulation of sdg-1 (bottom). See text for details.CC BY · PubMed Central
Author response image 1.
Author response image 1. CC BY · PubMed Central

Verification

Claims the paper makes

The claims and statistics of this paper haven’t been checked yet.

Run the check — free, no account needed. It reads the open-access text and checks the sources it cites.

A few free checks a day · papers already verified open instantly · results are public

Self-check

Percentages, sums and reported differences re-computed from the paper’s own numbers.

The self-check needs the paper’s full text.

Citations

Cites

Show all 117 references

Research works printed but not linked: 1

  1. Shugarts N, Yi A, Chan W, Marré JA, Sathya A, Jose AM. 2025. Intergenerational transport of double-stranded RNA in C. elegans can limit heritable epigenetic changes. NCBI Gene Expression Omnibus. https://www.ncbi.nlm.nih.gov/geo/query/acc.cgi?acc=GSE185385. GSE185385.

Cited by

Sorted by citations

Metadata

Authors
Shugarts Devanapally, N. M., Sathya, A., Yi, A. L., Chan, W. M., Marre, J. A., & Jose, A. M.
Affiliations
  • Department of Cell Biology and Molecular Genetics, University of Maryland
  • University of Maryland, College Park (US)
Corresponding author
Jose, Antony M
Venue
eLife
Published
2025-02-04
Volume
13
ISSN
2050-084X (ISSN-L)
OpenAlex
W4407139509
Cited by
6
References
117
Citations by year
2026: 4 · 2025: 1
Type
posted content
Language
en
Open access
Locations
  • eLife (publishedVersion, cc-by)
  • PubMed Central (publishedVersion, cc-by)
  • PubMed (publishedVersion)
  • DOAJ (DOAJ: Directory of Open Access Journals) (submittedVersion, cc-by-sa)
Funders
  • National Institute of General Medical Sciences (R01GM111457, R01GM124356)
  • University of Maryland (UMD CMNS Dean's Matching Award for "Training Program in Cell and Molecular Biology" T32GM080201)
  • National Science Foundation (2120895)
Topics
  • Life Sciences › Biochemistry, Genetics and Molecular Biology › Molecular Biology › RNA Interference and Gene Delivery
  • Life Sciences › Biochemistry, Genetics and Molecular Biology › Genetics › Chromosomal and Genetic Variations
  • Life Sciences › Biochemistry, Genetics and Molecular Biology › Molecular Biology › Epigenetics and DNA Methylation
Keywords
double-stranded RNA, SID-1, SDG 1, germ granules, retrotransposons, epigenetic inheritance, germline, Caenorhabditis elegans
MeSH terms
Animals, Membrane Proteins, RNA, Double-Stranded, Caenorhabditis elegans, Retroelements, Caenorhabditis elegans Proteins, RNA Interference, Epigenesis, Genetic

About these checks

Registry, retraction, Cites and statistics results are computed, not judged, with one exception: a printed reference that no index lists is read once by a model before it counts as a citation error. Claims are extracted by a model and kept only when their quote appears verbatim in the text; each cited source is then checked, with a model’s help, for whether it says what the claim relies on. Those verdicts can be wrong — read the claim’s quote and the cited source before relying on one.

Statistics and arithmetic are recomputed, not judged.

Confidence bands are shown only for fields calibrated on our annotated test set. None is calibrated yet, so no band is shown.

What counts as a claim ›How we measure confidence ›How we check this ›

Are you an author, or do you see a problem with this page? Request a review