

The DOI matches its Crossref record; 3 of the 3 references it cites were found in a registry or an index.
MaxEnt’s parameter configuration and small samples: are we paying attention to recommendations? A systematic review
Published version of a preprint
Abstract
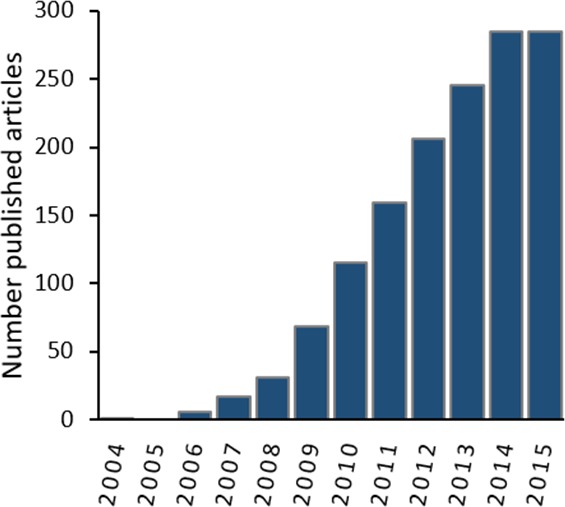
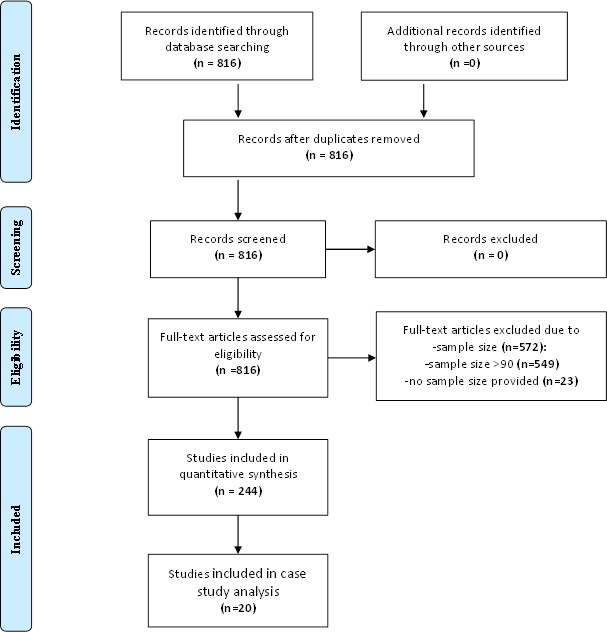
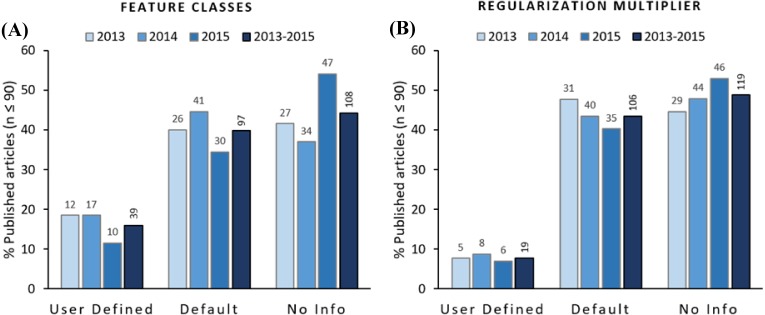
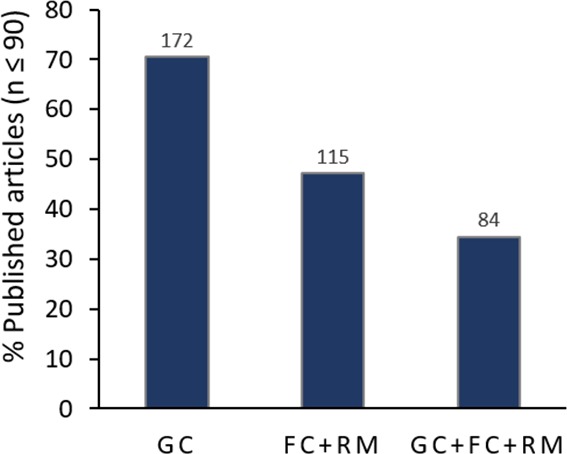
Environmental niche modeling (ENM) is commonly used to develop probabilistic maps of species distribution. Among available ENM techniques, MaxEnt has become one of the most popular tools for modeling species distribution, with hundreds of peer-reviewed articles published each year. MaxEnt’s popularity is mainly due to the use of a graphical interface and automatic parameter configuration capabilities. However, recent studies have shown that using the default automatic configuration may not be always appropriate because it can produce non-optimal models; particularly when dealing with a small number of species presence points. Thus, the recommendation is to evaluate the best potential combination of parameters (feature classes and regularization multiplier) to select the most appropriate model. In this work we reviewed 244 articles published between 2013 and 2015 to assess whether researchers are following recommendations to avoid using the default parameter configuration when dealing with small sample sizes, or if they are using MaxEnt as a “black box tool.” Our results show that in only 16% of analyzed articles authors evaluated best feature classes, in 6.9% evaluated best regularization multipliers, and in a meager 3.7% evaluated simultaneously both parameters before producing the definitive distribution model. We analyzed 20 articles to quantify the potential differences in resulting outputs when using software default parameters instead of the alternative best model. Results from our analysis reveal important differences between the use of default parameters and the best model approach, especially in the total area identified as suitable for the assessed species and the specific areas that are identified as suitable by both modelling approaches. These results are worrying, because publications are potentially reporting over-complex or over-simplistic models that can undermine the applicability of their results. Of particular importance are studies used to inform policy making. Therefore, researchers, practitioners, reviewers and editors need to be very judicious when dealing with MaxEnt, particularly when the modelling process is based on small sample sizes.
Overview
The claims and statistics of this paper haven’t been checked yet.
Run the check — free, no account needed. It reads the open-access text and checks the sources it cites.
Integrity signals
Registry
Cites
Statistics
Figures
Verification
Claims the paper makes
The claims and statistics of this paper haven’t been checked yet.
Run the check — free, no account needed. It reads the open-access text and checks the sources it cites.
Claims other papers make about this one
Each is checked against this paper’s own text: does it say what the citing paper says it does?
The source backs part of the claim, not all of it — or backs it for a different population, condition or comparison.
In the citing paper
“I ran 30 replicates with cross-validation to bring the average of the outputs to a suitable final model (Morales, Fernández & Baca-González 2017; Spiers et al. 2018).”
From A maxent predictive model for hunter-gatherer sites in the southern pampas, argentina (2021) · cites this paper as Morales, Fernández & Baca-González 2017
Experimental — accuracy not yet measured
Self-check
Percentages, sums and reported differences re-computed from the paper’s own numbers.
The self-check needs the paper’s full text.
Citations
Cites
Preferred Reporting Items for Systematic Reviews and Meta-Analyses: the PRISMA statement
Moher, D., Liberati, A., Tetzlaff, J., Altman, D. G., & for the PRISMA Group (2009) · BMJ · doi:10.1136/bmj.b2535 · Cited by 83,823
The art of modelling range-shifting species: The art of modelling range-shifting species
Elith, J., Kearney, M., & Phillips, S. (2010) · Methods in Ecology and Evolution · doi:10.1111/j.2041-210x.2010.00036.x · Cited by 2,813
Warren, D. L., & Seifert, S. N. (2011) · Ecological Applications · doi:10.1890/10-1171.1 · Cited by 2,312
Research works printed but not linked: 47
- Aguiar, 2015, Effect of chronological addition of records to species distribution maps: the case of Tonatia saurophila maresi (Chiroptera, Phyllostomidae) in South America, Austral Ecology, 40, 836, 10.1111/aec.12261 · DOI
- Alamgir, 2015, Modelling spatial distribution of critically endangered Asian elephant and Hoolock gibbon in Bangladesh forest ecosystems under a changing climate, Applied Geography, 60, 10, 10.1016/j.apgeog.2015.03.001 · DOI
- Alfaro-Saiz, 2015, Incorporating bioclimatic and biogeographic data in the construction of species distribution models in order to prioritize searches for new populations of threatened flora, Plant Biosystems, 149, 827, 10.1080/11263504.2014.976289 · DOI
- Amici, 2015, Habitat suitability and landscape structure: a maximum entropy approach in a mediterranean area, Landscape Research, 40, 208, 10.1080/01426397.2013.774329 · DOI
- Anderson, 2011, Species-specific tuning increases robustness to sampling bias in models of species distributions: an implementation with Maxent, Ecological Modelling, 222, 2796, 10.1016/j.ecolmodel.2011.04.011 · DOI
- Bernardes, 2013, Habitat characterization and potential distribution of Tylototriton vietnamensis in northern Vietnam, Journal of Natural History, 47, 1161, 10.1080/00222933.2012.743611 · DOI
- Bouchet, 2015, Drifting baited stereo-videography: a novel sampling tool for surveying pelagic wildlife in offshore marine reserves, Ecosphere, 6, 1, 10.1890/ES14-00174.1 · DOI
- Brambilla, 2013, Modelling distribution and potential overlap between Boreal Owl Aegolius funereus and Black Woodpecker Dryocopus martius: implications for management and monitoring plans, Bird Conservation International, 23, 502, 10.1017/S0959270913000117 · DOI
- Cao, 2013, Using Maxent to model the historic distributions of stonefly species in Illinois streams: the effects of regularization and threshold selections, Ecological Modelling, 259, 30, 10.1016/j.ecolmodel.2013.03.012 · DOI
- Carvalho, 2015, Predicting priority areas for conservation from historical climate modelling: stingless bees from Atlantic Forest hotspot as a case study, Journal of Insect Conservation, 19, 581, 10.1007/s10841-015-9780-7 · DOI
- Ceccarelli, 2015, Global climate change effects on Venezuela’s vulnerability to chagas disease is linked to the geographic distribution of five triatomine species, Journal of Medical Entomology, 52, 1333, 10.1093/jme/tjv119 · DOI
- Chetan, 2014, Delineating ecological boundaries of Hanuman Langur species complex in Peninsular India using MaxEnt modeling approach, PLOS ONE, 9, e87804, 10.1371/journal.pone.0087804 · DOI
- Chłond, 2015, Current and potential geographical distribution of Platymeris biguttatus (Linnaeus, 1767) with description of nymphs, Zoological Studies, 54, 9, 10.1186/s40555-014-0092-5 · DOI
- Chunco, 2013, Predicting environmental suitability for a rare and threatened species (Lao Newt, Laotriton laoensis) using validated species distribution models, PLOS ONE, 8, e59853, 10.1371/journal.pone.0059853 · DOI
- Conflitti, 2015, The speciation continuum: ecological and chromosomal divergence in the Simulium arcticum complex (Diptera: Simuliidae), Biological Journal of the Linnean Society, 115, 13, 10.1111/bij.12480 · DOI
- Crafton, 2015, Modeling invasion risk for coastal marine species utilizing environmental and transport vector data, Hydrobiologia, 746, 349, 10.1007/s10750-014-2027-x · DOI
- De Castro Pena, 2014, Assessing the conservation status of species with limited available data and disjunct distribution, Biological Conservation, 170, 130, 10.1016/j.biocon.2013.12.015 · DOI
- Elith, 2006, Novel methods improve prediction of species’ distributions from occurrence data, Ecography, 29, 129, 10.1111/j.2006.0906-7590.04596.x · DOI · Paper page
- Elith, 2009, Species distribution models: ecological explanation and prediction across space and time, Annual Review of Ecology, Evolution, and Systematics, 40, 677, 10.1146/annurev.ecolsys.110308.120159 · DOI · Paper page
- Fernández, 2016, A spatial multicriteria decision analysis for selecting priority sites for plant species restoration: a case study from the Chilean biodiversity hotspot, Restoration Ecology, 24, 599, 10.1111/rec.12354 · DOI
- Fitzpatrick, 2013, MaxEnt versus MaxLike: empirical comparisons with ant species distributions, Ecosphere, 4, 1, 10.1890/ES13-00066.1 · DOI
- Fois, 2015, A practical method to speed up the discovery of unknown populations using Species Distribution Models, Journal for Nature Conservation, 24, 42, 10.1016/j.jnc.2015.02.001 · DOI
- Gelviz-Gelvez, 2015, Ecological niche modeling under climate change to select shrubs for ecological restoration in Central Mexico, Ecological Engineering, 74, 302, 10.1016/j.ecoleng.2014.09.082 · DOI
- Guisan, 2000, Predictive habitat distribution models in ecology, Ecological Modelling, 135, 147, 10.1016/S0304-3800(00)00354-9 · DOI · Paper page
- Halvorsen, 2015, Opportunities for improved distribution modelling practice via a strict maximum likelihood interpretation of MaxEnt, Ecography, 38, 172, 10.1111/ecog.00565 · DOI
- Hu, 2014, Unveiling the conservation biogeography of a data-deficient endangered bird species under climate change, PLOS ONE, 9, e84529, 10.1371/journal.pone.0084529 · DOI
- Kramer-Schadt, 2013, The importance of correcting for sampling bias in MaxEnt species distribution models, Diversity and Distributions, 19, 1366, 10.1111/ddi.12096 · DOI · Paper page
- Merow, 2013, A practical guide to MaxEnt for modeling species’ distributions: what it does, and why inputs and settings matter, Ecography, 36, 1058, 10.1111/j.1600-0587.2013.07872.x · DOI · Paper page
- Mestre, 2015, Combining distribution modelling and non-invasive genetics to improve range shift forecasting, Ecological Modelling, 297, 171, 10.1016/j.ecolmodel.2014.11.018 · DOI
- Meyer, 2014, Assessing the exposure of lion tamarins (Leontopithecus spp.) to future climate change, American Journal of Primatology, 76, 551, 10.1002/ajp.22247 · DOI
- Miller, 2010, Species distribution modeling, Geography Compass, 4, 490, 10.1111/j.1749-8198.2010.00351.x · DOI
- Mweya, 2013, Predicting distribution of Aedes aegypti and Culex pipiens complex, potential vectors of Rift Valley fever virus in relation to disease epidemics in East Africa, Infection Ecology & Epidemiology, 3, 21748, 10.3402/iee.v3i0.21748 · DOI
- Orr, 2014, Taxonomic utility of niche models in validating species concepts: a case study in Anthophora (Heliophila) (Hymenoptera: Apidae), Zootaxa, 3846, 10.11646/zootaxa.3846.3.5 · DOI
- Palmas-Pérez, 2013, Diversidad y distribución de Marcgraviaceae en México, Revista Mexicana de Biodiversidad, 84, 170, 10.7550/rmb.29666 · DOI
- Pedersen, 2014, Modelling spatial distribution of snails transmitting parasitic worms with importance to human and animal health and analysis of distributional changes in relation to climate, Geospatial Health, 8, 10.4081/gh.2014.23 · DOI
- Phillips, 2006, Maximum entropy modeling of species geographic distributions, Ecological Modelling, 190, 231, 10.1016/j.ecolmodel.2005.03.026 · DOI · Paper page
- Phillips, 2008, Modeling of species distributions with Maxent: new extensions and a comprehensive evaluation, Ecography, 31, 161, 10.1111/j.0906-7590.2008.5203.x · DOI · Paper page
- Radosavljevic, 2014, Making better Maxent models of species distributions: complexity, overfitting and evaluation, Journal of Biogeography, 41, 629, 10.1111/jbi.12227 · DOI · Paper page
- Shcheglovitova, 2013, Estimating optimal complexity for ecological niche models: a jackknife approach for species with small sample sizes, Ecological Modelling, 269, 9, 10.1016/j.ecolmodel.2013.08.011 · DOI
- Simo, 2014, A predictive modeling approach to test distributional uniformity of Uruguayan harvestmen (Arachnida: Opiliones), Zoological Studies, 53, 50, 10.1186/s40555-014-0050-2 · DOI
- Stigall, 2014, Relating environmental change and species stability in Late Ordovician seas, GFF, 136, 249, 10.1080/11035897.2013.852619 · DOI
- Syfert, 2013, The effects of sampling bias and model complexity on the predictive performance of MaxEnt species distribution models, PLOS ONE, 8, e55158, 10.1371/journal.pone.0055158 · DOI
- Urbani, 2015, Maximum entropy modeling of geographic distributions of the flea beetle species endemic in Italy (Coleoptera: Chrysomelidae: Galerucinae: Alticini), Zoologischer Anzeiger, 258, 99, 10.1016/j.jcz.2015.08.002 · DOI
- Velásquez-Tibatá, 2016, Using measurement error models to account for georeferencing error in species distribution models, Ecography, 39, 305, 10.1111/ecog.01205 · DOI
- Vergara, 2015, More on the Mesopotamian-Yungas disjunction in subtropical and temperate Argentina: bioclimatic distribution models of the harvestman Discocyrtus dilatatus (Opiliones: Gonyleptidae), Zoologia (Curitiba), 32, 445, 10.1590/s1984-46702015000600003 · DOI
- Yackulic, 2013, Presence-only modelling using MAXENT: when can we trust the inferences?, Methods in Ecology and Evolution, 4, 236, 10.1111/2041-210x.12004 · DOI
- Yu, 2014, A model-based method to evaluate the ability of nature reserves to protect endangered tree species in the context of climate change, Forest Ecology and Management, 327, 48, 10.1016/j.foreco.2014.04.020 · DOI
Cited by
Sorted by citations
A maxent predictive model for hunter-gatherer sites in the southern pampas, argentina
Rafuse, D. J. (2021) · Open Quaternary · doi:10.5334/oq.97 · Cited by 17
Metadata
- Authors
- Morales, N. S., Fernández, I. C., & Baca-González, V.
- Affiliations
- Department of Biological Sciences, Faculty of Science and Engineering, Macquarie University, Sydney, New South Wales, Australia
- Fundación Ecomabi, Santiago, Región Metropolitana, Chile
- Facultad de Ciencias Biológicas, Universidad Complutense de Madrid, Madrid, Spain
- Venue
- PeerJ
- Publisher
- PeerJ
- Published
- 2017-03-14
- Volume
- 5
- Pages
- e3093
- ISSN
- 2167-8359
- PMC
- PMC5354112
- Cited by
- 464
- References
- 3
- Language
- en
About these checks
Registry, retraction, Cites and statistics results are computed, not judged, with one exception: a printed reference that no index lists is read once by a model before it counts as a citation error. Claims are extracted by a model and kept only when their quote appears verbatim in the text; each cited source is then checked, with a model’s help, for whether it says what the claim relies on. Those verdicts can be wrong — read the claim’s quote and the cited source before relying on one.
Statistics and arithmetic are recomputed, not judged.
Confidence bands are shown only for fields calibrated on our annotated test set. None is calibrated yet, so no band is shown.
What counts as a claim ›How we measure confidence ›How we check this ›
Are you an author, or do you see a problem with this page? Request a review
