

The DOI matches its Crossref record; 25 of the 25 references it cites were found in a registry or an index.
Growth differentiation factor 15 as a useful biomarker for mitochondrial disorders
Open accessAbstract
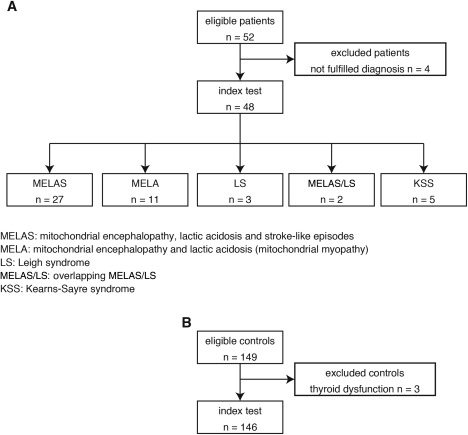
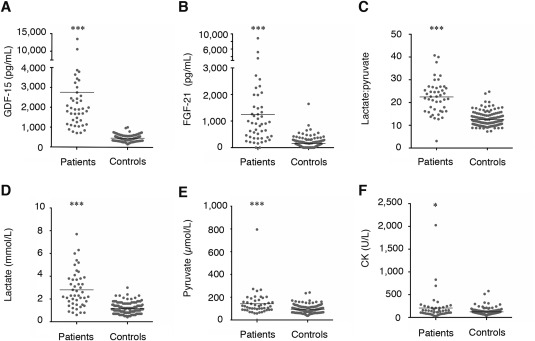
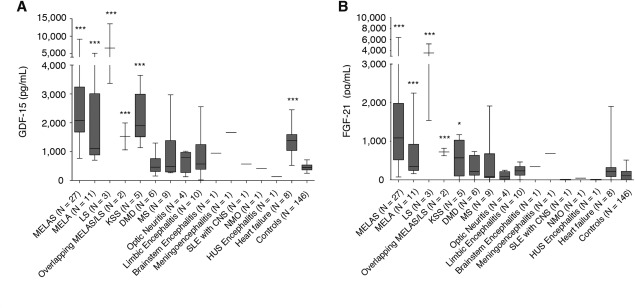
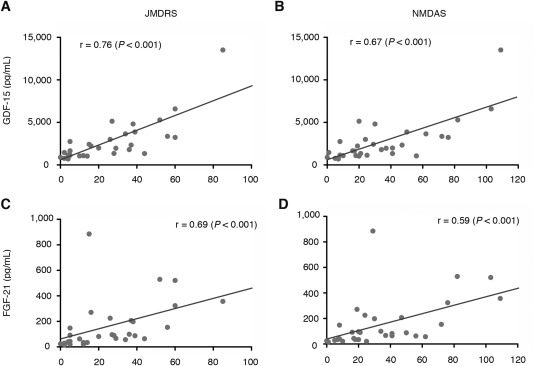
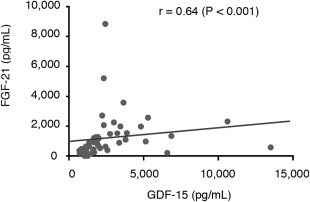
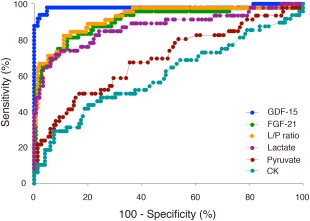
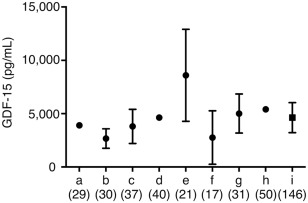
OBJECTIVE: The diagnosis of mitochondrial disorders (MDs) is occasionally difficult because patients often present with solitary, or a combination of, symptoms caused by each organ insufficiency, which may be the result of respiratory chain enzyme deficiency. Growth differentiation factor 15 (GDF-15) has been reported to be elevated in serum of patients with MDs. In this study, we investigated whether GDF-15 is a more useful biomarker for MDs than several conventional biomarkers. METHODS: We measured the serum levels of GDF-15 and fibroblast growth factor 21 (FGF-21), as well as other biomarkers, in 48 MD patients and in 146 healthy controls in Japan. GDF-15 and FGF-21 concentrations were measured by enzyme-linked immunosorbant assay and compared with lactate, pyruvate, creatine kinase, and the lactate-to-pyruvate ratio. We calculated sensitivity and specificity and also evaluated the correlation based on two rating scales, including the Newcastle Mitochondrial Disease Rating Scale (NMDAS). RESULTS: Mean GDF-15 concentration was 6-fold higher in MD patients compared to healthy controls (2,711 ± 2,459 pg/ml vs 462.5 ± 141.0 pg/mL; p < 0.001). Using a receiver operating characteristic curve, the area under the curve was significantly higher for GDF-15 than FGF-21 and other conventional biomarkers. Our date suggest that GDF-15 is the most useful biomarker for MDs of the biomarkers examined, and it is associated with MD severity. INTERPRETATION: Our results suggest that measurement of GDF-15 is the most useful first-line test to indicate the patients who have the mitochondrial respiratory chain deficiency.
Overview
The claims and statistics of this paper haven’t been checked yet.
Run the check — free, no account needed. It reads the open-access text and checks the sources it cites.
Integrity signals
Registry
Cites
Statistics
Figures
Verification
Claims the paper makes
The claims and statistics of this paper haven’t been checked yet.
Run the check — free, no account needed. It reads the open-access text and checks the sources it cites.
Claims other papers make about this one
Each is checked against this paper’s own text: does it say what the citing paper says it does?
In the citing paper
“It is considered as an indicator of mitochondrial dysfunction in muscle (21)”
From Human Aging and Longevity Are Characterized by High Levels of Mitokines (2019) · cites this paper as [21]
Self-check
Percentages, sums and reported differences re-computed from the paper’s own numbers.
The self-check needs the paper’s full text.
Citations
Cites
DeLong, E. R., DeLong, D. M., & Clarke-Pearson, D. L. (1988) · Biometrics · doi:10.2307/2531595 · Cited by 22,649
An Integrated Stress Response Regulates Amino Acid Metabolism and Resistance to Oxidative Stress
Harding, H. P., Zhang, Y., Zeng, H., Novoa, I., Lu, P. D., Calfon, M. A., Sadri, N., Yun, C., Popko, B., Paules, R. S., et al. (2003) · Molecular Cell · doi:10.1016/s1097-2765(03)00105-9 · Cited by 3,336
Suomalainen, A., Elo, J. M., Pietiläinen, K. H., Hakonen, A. H., Sevastianova, K., Korpela, M., Isohanni, P., Marjavaara, S. K., Tyni, T., Kiuru-Enari, S., et al. (2011) · The Lancet Neurology · doi:10.1016/s1474-4422(11)70155-7 · Cited by 427
MELAS: A nationwide prospective cohort study of 96 patients in Japan
Yatsuga, S., Povalko, N., Nishioka, J., Katayama, K., Kakimoto, N., Matsuishi, T., Kakuma, T., & Koga, Y. (2011) · Biochimica et Biophysica Acta (BBA) - General Subjects · doi:10.1016/j.bbagen.2011.03.015 · Cited by 309
Mitochondrial Disease: A Practical Approach for Primary Care Physicians
Haas, R., Parikh, S., Falk, M. J., Saneto, R. P., Wolf, N. I., Darín, N., & Cohen, B. H. (2007) · PEDIATRICS · doi:10.1542/peds.2007-0391 · Cited by 272
Activating transcription factor 4-dependent induction of FGF21 during amino acid deprivation
De Sousa-Coelho, A. L., Marrero, P. F., & Haro, D. (2012) · Biochemical Journal · doi:10.1042/bj20111748 · Cited by 246
Santhanakrishnan, R., Chong, J. P. C., Ng, T. P., Ling, L. H., Sim, D., Leong, K. T. G., Yeo, P. S. D., Ong, H. Y., Jaufeerally, F. R., Wong, R. C.-C., et al. (2012) · European Journal of Heart Failure · doi:10.1093/eurjhf/hfs130 · Cited by 217
Jiang, S., Cheng, Y., Fang, Q., Shao, M., Zhang, Y., Liu, Y., Deng, Y., Shan, B., Liu, J., Li, H., et al. (2014) · Journal of Biological Chemistry · doi:10.1074/jbc.m114.565960 · Cited by 182
Mitochondrial disease in adults: A scale to monitor progression and treatment
Schaefer, A. M., Phoenix, C., Elson, J. L., McFarland, R., Chinnery, P. F., & Turnbull, D. M. (2006) · Neurology · doi:10.1212/01.wnl.0000219759.72195.41 · Cited by 178
Jousse, C., Deval, C., Maurin, A., Parry, L., Chérasse, Y., Chaveroux, C., LeFloch, R., Lenormand, P., Bruhat, A., & Fafournoux, P. (2007) · Journal of Biological Chemistry · doi:10.1074/jbc.m611723200 · Cited by 174
Cited by
Sorted by citations
Gorman, G. S., Chinnery, P. F., DiMauro, S., Hirano, M., Koga, Y., McFarland, R., Suomalainen, A., Thorburn, D. R., Zeviani, M., & Turnbull, D. M. (2016) · Nature Reviews Disease Primers · doi:10.1038/nrdp.2016.80 · Cited by 1,650
Mitochondrial signal transduction
Picard, M. A., & Shirihai, O. S. (2022) · Cell Metabolism · doi:10.1016/j.cmet.2022.10.008 · Cited by 688
Mitochondrial diseases: the contribution of organelle stress responses to pathology
Suomalainen, A., & Battersby, B. J. (2018) · Nature Reviews Molecular Cell Biology · doi:10.1038/nrm.2017.66 · Cited by 505
POLG-related disorders and their neurological manifestations
Rahman, S., & Copeland, W. C. (2018) · Nature Reviews Neurology · doi:10.1038/s41582-018-0101-0 · Cited by 437
Tsai, V. W.-W., Husaini, Y., Sainsbury, A., Brown, D. A., & Breit, S. N. (2018) · Cell Metabolism · doi:10.1016/j.cmet.2018.07.018 · Cited by 424
mTORC1 Regulates Mitochondrial Integrated Stress Response and Mitochondrial Myopathy Progression
Khan, N. A., Nikkanen, J., Yatsuga, S., Jackson, C. B., Wang, L., Pradhan, S., Kivelä, R., Pessia, A., Velagapudi, V., & Suomalainen, A. (2017) · Cell Metabolism · doi:10.1016/j.cmet.2017.07.007 · Cited by 394
GDF15: a hormone conveying somatic distress to the brain
Lockhart, S. M., Saudek, V., & O’Rahilly, S. (2020) · Endocrine Reviews · doi:10.1210/endrev/bnaa007 · Cited by 256
FDX1 regulates cellular protein lipoylation through direct binding to LIAS
Dreishpoon, M. B., Bick, N. R., Petrova, B., Warui, D. M., Cameron, A., Booker, S. J., Kanarek, N., Golub, T. R., & Tsvetkov, P. (2023) · Journal of Biological Chemistry · doi:10.1016/j.jbc.2023.105046 · Cited by 262
Mick, E., Titov, D. V., Skinner, O. S., Sharma, R., Jourdain, A. A., & Mootha, V. K. (2020) · eLife · doi:10.7554/elife.49178 · Cited by 252
The GDF15-GFRAL Pathway in Health and Metabolic Disease: Friend or Foe?
Breit, S. N., Brown, D. A., & Tsai, V. W.-W. (2020) · Annual Review of Physiology · doi:10.1146/annurev-physiol-022020-045449 · Cited by 237
Mitochondrial diseases: from molecular mechanisms to therapeutic advances
Wen, H., Deng, H., Li, B., Chen, J., Zhu, J., Zhang, X., Yoshida, S., & Zhou, Y. (2025) · Signal Transduction and Targeted Therapy · doi:10.1038/s41392-024-02044-3 · Cited by 284
FGF21 is a biomarker for mitochondrial translation and mtDNA maintenance disorders
Lehtonen, J. M., Forsström, S., Bottani, E., Viscomi, C., Baris, O. R., Isoniemi, H., Höckerstedt, K., Österlund, P., Hurme, M., Jylhävä, J., et al. (2016) · Neurology · doi:10.1212/wnl.0000000000003374 · Cited by 220
Human Aging and Longevity Are Characterized by High Levels of Mitokines
Conte, M., Ostan, R., Fabbri, C., Santoro, A., Guidarelli, G., Vitale, G., Mari, D., Sevini, F., Capri, M., Sandri, M., et al. (2019) · The Journals of Gerontology: Series A · doi:10.1093/gerona/gly153 · Cited by 219
Mitochondrial disease in adults: recent advances and future promise
Ng, Y. S., Bindoff, L. A., Gorman, G. S., Klopstock, T., Kornblum, C., Mancuso, M., McFarland, R., Sue, C. M., Suomalainen, A., Taylor, R. W., et al. (2021) · The Lancet Neurology · doi:10.1016/s1474-4422(21)00098-3 · Cited by 229
Circulating markers of NADH-reductive stress correlate with mitochondrial disease severity
Sharma, R., Reinstadler, B. M., Engelstad, K., Skinner, O. S., Stackowitz, E., Haller, R. G., Clish, C. B., Pierce, K. A., Walker, M. A., Fryer, R. H., et al. (2021) · Journal of Clinical Investigation · doi:10.1172/jci136055 · Cited by 198
Fujita, Y., Taniguchi, Y., Shinkai, S., Tanaka, M., & Ito, M. (2016) · Geriatrics and gerontology international/Geriatrics & gerontology international · doi:10.1111/ggi.12724 · Cited by 206
Tang, H., Inoki, K., Brooks, S. V., Okazawa, H., Lee, M. C., Wang, J., Kim, M., Kennedy, C. L., Macpherson, P. C. D., Ji, X., et al. (2019) · Aging Cell · doi:10.1111/acel.12943 · Cited by 198
Montero, R., Yubero, D., Villarroya, J., Henares, D., Jou, C., Rodríguez, M. A., Ramos, F. J., Nascimento, A., Ortez, C., Campistol, J., et al. (2016) · PLoS ONE · doi:10.1371/journal.pone.0148709 · Cited by 178
Insights Into Mechanisms of GDF15 and Receptor GFRAL: Therapeutic Targets
Rochette, L., Zeller, M., Cottin, Y., & Vergely, C. (2020) · Trends in Endocrinology and Metabolism · doi:10.1016/j.tem.2020.10.004 · Cited by 173
Mitohormesis, an Antiaging Paradigm
Bárcena, C., Mayoral, P., & Quirós, P. M. (2018) · International review of cytology · doi:10.1016/bs.ircmb.2018.05.002 · Cited by 174
Mitochondrial-to-nuclear communication in aging: an epigenetic perspective
Zhu, D., Li, X., & Tian, Y. (2022) · Trends in Biochemical Sciences · doi:10.1016/j.tibs.2022.03.008 · Cited by 170
Diagnosis and Treatment of Mitochondrial Myopathies
Ahmed, S. T., Craven, L., Russell, O. M., Turnbull, D. M., & Vincent, A. E. (2018) · Neurotherapeutics · doi:10.1007/s13311-018-00674-4 · Cited by 160
GDF15 and Cardiac Cells: Current Concepts and New Insights
Rochette, L., Dogon, G., Zeller, M., Cottin, Y., & Vergely, C. (2021) · International Journal of Molecular Sciences · doi:10.3390/ijms22168889 · Cited by 158
Adaptation to mitochondrial stress requires CHOP-directed tuning of ISR
Kaspar, S., Oertlin, C., Szczepanowska, K., Kukat, A., Senft, K., Lucas, C., Brodesser, S., Hatzoglou, M., Larsson, O. S., Topisirović, I., et al. (2021) · Science Advances · doi:10.1126/sciadv.abf0971 · Cited by 138
The mitochondrial coenzyme Q junction and complex III: biochemistry and pathophysiology
Banerjee, R., Purhonen, J., & Kallijärvi, J. (2021) · FEBS Journal · doi:10.1111/febs.16164 · Cited by 137
Molecular basis of Leigh syndrome: a current look
Baldo, M. S., & Vilarinho, L. (2020) · Orphanet Journal of Rare Diseases · doi:10.1186/s13023-020-1297-9 · Cited by 142
Deoxynucleoside Therapy for Thymidine Kinase 2–Deficient Myopathy
Domínguez‐González, C., Madruga‐Garrido, M., Mavillard, F., Garone, C., Aguirre‐Rodríguez, F. J., Donati, M. A., Kleinsteuber, K., Martí, I., Martín‐Hernández, E., Morealejo‐Aycinena, J. P., et al. (2019) · Annals of Neurology · doi:10.1002/ana.25506 · Cited by 132
Conte, M., Martucci, M., Mosconi, G., Chiariello, A., Cappuccilli, M. L., Totti, V., Santoro, A., Franceschi, C., & Salvioli, S. (2020) · Frontiers in Immunology · doi:10.3389/fimmu.2020.00915 · Cited by 127
Wang, Y., Chen, C., Chen, J., Sang, T., Peng, H., Lin, X., Zhao, Q., Chen, S., Eling, T. E., & Wang, X. (2022) · Redox Biology · doi:10.1016/j.redox.2022.102322 · Cited by 130
Mancuso, M., McFarland, R., Klopstock, T., Hirano, M., Artuch, R., Bertini, E., Bindoff, L. A., Carelli, V., Gorman, G. S., Hirano, M., et al. (2017) · Neuromuscular Disorders · doi:10.1016/j.nmd.2017.08.006 · Cited by 124
The Role of GDF15 as a Myomitokine
Johann, K., Kleinert, M., & Klaus, S. (2021) · Cells · doi:10.3390/cells10112990 · Cited by 125
Mitochondrial stress and mitokines in aging
Burtscher, J., Soltany, A., Visavadiya, N. P., Burtscher, M., Millet, G. P., Khoramipour, K., & Khamoui, A. V. (2023) · Aging Cell · doi:10.1111/acel.13770 · Cited by 123
Inflammaging, hormesis and the rationale for anti-aging strategies
Santoro, A., Martucci, M., Conte, M., Capri, M., Franceschi, C., & Salvioli, S. (2020) · Ageing Research Reviews · doi:10.1016/j.arr.2020.101142 · Cited by 121
GDF15 as a biomarker of ageing
Liu, H., Huang, Y., Lyu, Y., Dai, W., Tong, Y., & Li, Y. (2021) · Experimental Gerontology · doi:10.1016/j.exger.2021.111228 · Cited by 118
A comparison of current serum biomarkers as diagnostic indicators of mitochondrial diseases
Davis, R. L., Liang, C., & Sue, C. M. (2016) · Neurology · doi:10.1212/wnl.0000000000002705 · Cited by 113
Mitochondria, immunosenescence and inflammaging: a role for mitokines?
Conte, M., Martucci, M., Chiariello, A., Franceschi, C., & Salvioli, S. (2020) · Seminars in Immunopathology · doi:10.1007/s00281-020-00813-0 · Cited by 105
Colchicine acts selectively in the liver to induce hepatokines that inhibit myeloid cell activation
Weng, J., Koch, P. D., Luan, H. H., Tu, H.-C., Shimada, K., Ngan, I., Ventura, R., Jiang, R., & Mitchison, T. J. (2021) · Nature Metabolism · doi:10.1038/s42255-021-00366-y · Cited by 105
The Interplay between Mitochondrial Morphology and Myomitokines in Aging Sarcopenia
Romanello, V. (2020) · International Journal of Molecular Sciences · doi:10.3390/ijms22010091 · Cited by 101
Morrow, R. M., Picard, M. A., Derbeneva, O. A., Leipzig, J. N., McManus, M. J., Gouspillou, G., Barbat‐Artigas, S., Santos, C. D., Hepple, R. T., Murdock, D. G., et al. (2017) · Proceedings of the National Academy of Sciences · doi:10.1073/pnas.1700997114 · Cited by 98
Sensing, signaling and surviving mitochondrial stress
Eckl, E.-M., Ziegemann, O., Krumwiede, L., Fessler, E., & Jae, L. T. (2021) · Cellular and Molecular Life Sciences · doi:10.1007/s00018-021-03887-7 · Cited by 93
Semba, R. D., Gonzalez-Freire, M., Tanaka, T., Biancotto, A., Zhang, P., Shardell, M., Moaddel, R., CHI Consortium, & Ferrucci, L. (2020) · The Journals of Gerontology Series A · doi:10.1093/gerona/glz071 · Cited by 94
Glutathione as a Redox Biomarker in Mitochondrial Disease—Implications for Therapy
Enns, G. M., & Cowan, T. M. (2017) · Journal of Clinical Medicine · doi:10.3390/jcm6050050 · Cited by 96
Blood biomarkers for assessment of mitochondrial dysfunction: An expert review
Hubens, W. H. G., Vallbona-Garcia, A., de Coo, I. F. M., van Tienen, F. H. J., Webers, C. A. B., Smeets, H. J. M., & Gorgels, T. G. M. F. (2021) · Mitochondrion · doi:10.1016/j.mito.2021.10.008 · Cited by 94
Kang, S., Choi, M. J., Jung, S.-B., Chung, H. K., Chang, J. Y., Kim, J. T., Kang, Y. E., Lee, J. H., Hong, H. J., Jun, S. M., et al. (2021) · iScience · doi:10.1016/j.isci.2021.102181 · Cited by 91
GDF15 is a heart‐derived hormone that regulates body growth
Wang, T., Liu, J., McDonald, C., Lupino, K., Zhai, X., Wilkins, B. J., Hakonarson, H. H., & Pei, L. (2017) · EMBO Molecular Medicine · doi:10.15252/emmm.201707604 · Cited by 96
Mitochondrial disorders in children: toward development of small‐molecule treatment strategies
Koopman, W. J. H., Beyrath, J., Fung, C., Koene, S., Rodenburg, R. J., Willems, P. H. G. M., & Smeitink, J. A. M. (2016) · EMBO Molecular Medicine · doi:10.15252/emmm.201506131 · Cited by 90
Kim, K. H., & Lee, M. (2020) · Biochimica et Biophysica Acta (BBA) - General Subjects · doi:10.1016/j.bbagen.2020.129834 · Cited by 78
The Cellular Mitochondrial Genome Landscape in Disease
Hahn, A., & Zuryn, S. (2018) · Trends in Cell Biology · doi:10.1016/j.tcb.2018.11.004 · Cited by 75
Expanding and validating the biomarkers for mitochondrial diseases
Maresca, A., Dotto, V. D., Romagnoli, M., Morgia, C. L., Vito, L. D., Capristo, M., Valentino, M. L., Carelli, V., & the ER-MITO Study Group (2020) · Journal of Molecular Medicine · doi:10.1007/s00109-020-01967-y · Cited by 77
Matsuhashi, T., Sato, T., Kanno, S., Suzuki, T., Matsuo, A., Oba, Y., Kikusato, M., Ogasawara, E., Kudo, T., Suzuki, K., et al. (2017) · EBioMedicine · doi:10.1016/j.ebiom.2017.05.016 · Cited by 71
Biomarkers for mitochondrial energy metabolism diseases
Boenzi, S., & Diodato, D. (2018) · Essays in Biochemistry · doi:10.1042/ebc20170111 · Cited by 71
Growth Differentiation Factor-15 in Immunity and Aging
Pence, B. D. (2022) · Frontiers in Aging · doi:10.3389/fragi.2022.837575 · Cited by 68
A randomized crossover trial of elamipretide in adults with primary mitochondrial myopathy
Karaa, A., Haas, R., Goldstein, A. C., Vockley, J. E., & Cohen, B. H. (2020) · Journal of Cachexia Sarcopenia and Muscle · doi:10.1002/jcsm.12559 · Cited by 68
Biomarkers of mitochondrial disorders
Shayota, B. J. (2024) · Neurotherapeutics · doi:10.1016/j.neurot.2024.e00325 · Cited by 82
Growth and differentiation factor 15 as a biomarker for mitochondrial myopathy
Poulsen, N. S., Madsen, K. L., Hornsyld, T. M., Eisum, A. V., Fornander, F., Buch, A. E., Stemmerik, M. P. G., Ruiz‐Ruiz, C., Krag, T. O. B., & Vissing, J. (2019) · Mitochondrion · doi:10.1016/j.mito.2019.10.005 · Cited by 68
Diagnosis of ‘possible’ mitochondrial disease: an existential crisis
Parikh, S., Karaa, A., Goldstein, A. C., Bertini, E., Chinnery, P. F., Christodoulou, J., Cohen, B. H., Davis, R. L., Falk, M. J., Fratter, C., et al. (2019) · Journal of Medical Genetics · doi:10.1136/jmedgenet-2018-105800 · Cited by 65
Lehtonen, J. M., Auranen, M., Darín, N., Sofou, K., Bindoff, L. A., Hikmat, O., Uusimaa, J., Vieira, P., Tulinius, M., Lönnqvist, T. R. I., et al. (2020) · Journal of Inherited Metabolic Disease · doi:10.1002/jimd.12307 · Cited by 64
Arauna, D., García‐García, F. J., Rodríguez‐Mañas, L., Marrugat, J., Sáez, C. G., Alarcón, M. A., Wehinger, S., Espinosa‐Parrilla, Y., Palomo, I. F., & Eduardo Fuentes, Q. (2020) · Free Radical Biology and Medicine · doi:10.1016/j.freeradbiomed.2020.01.007 · Cited by 65
GDF15 as a key disease target and biomarker: linking chronic lung diseases and ageing
Wan, Y., & Fu, J. (2023) · Molecular and Cellular Biochemistry · doi:10.1007/s11010-023-04743-x · Cited by 66
Monitoring clinical progression with mitochondrial disease biomarkers
Steele, H. E., Horváth, R., Lyon, J. J., & Chinnery, P. F. (2017) · Brain · doi:10.1093/brain/awx168 · Cited by 63
Mitochondrial dynamics define muscle fiber type by modulating cellular metabolic pathways
Yasuda, T., Ishihara, T., Ichimura, A., & Ishihara, N. (2023) · Cell Reports · doi:10.1016/j.celrep.2023.112434 · Cited by 64
Saito, T., Uchiumi, T., Yagi, M., Amamoto, R., Setoyama, D., Matsushima, Y., & Kang, D. (2017) · Cardiovascular Research · doi:10.1093/cvr/cvx095 · Cited by 59
Croon, M., Szczepanowska, K., Popović, M., Lienkamp, C., Senft, K., Brandscheid, C. P., Bock, T., Gnatzy-Feik, L., Ashurov, A., Acton, R., et al. (2022) · Science Advances · doi:10.1126/sciadv.abn7105 · Cited by 60
A genetically encoded tool to increase cellular NADH/NAD+ ratio in living cells
Pan, X., Heacock, M. L., Abdulaziz, E. N., Violante, S. N., Zuckerman, A. L., Shrestha, N., Yao, C., Goodman, R. P., Cross, J. R., & Cracan, V. (2023) · Nature Chemical Biology · doi:10.1038/s41589-023-01460-w · Cited by 62
Growth Differentiation Factor 15 Is a Novel Diagnostic Biomarker of Mitochondrial Diseases
Ji, X., Zhao, L., Ji, K., Zhao, Y., Li, W., Zhang, R., Hou, Y., Lu, J., & Yan, C. (2016) · Molecular Neurobiology · doi:10.1007/s12035-016-0283-7 · Cited by 58
High throughput single cell analysis of mitochondrial heteroplasmy in mitochondrial diseases
Maeda, R., Kami, D., Maeda, H., Shikuma, A., & Gojo, S. (2020) · Scientific Reports · doi:10.1038/s41598-020-67686-z · Cited by 57
Mitochondria and mitochondria-induced signalling molecules as longevity determinants
Rose, G., Santoro, A., & Salvioli, S. (2016) · Mechanisms of Ageing and Development · doi:10.1016/j.mad.2016.12.002 · Cited by 57
Recent topics: the diagnosis, molecular genesis, and treatment of mitochondrial diseases
Murayama, K., Shimura, M., Liu, Z., Okazaki, Y., & Ohtake, A. (2018) · Journal of Human Genetics · doi:10.1038/s10038-018-0528-6 · Cited by 53
Role of the mitochondrial stress response in human cancer progression
Wang, S., Chen, S., Tseng, L., & Lee, H. (2020) · Experimental Biology and Medicine · doi:10.1177/1535370220920558 · Cited by 51
Quorum sensing molecules as a novel microbial factor impacting muscle cells
Spiegeleer, A. D., Elewaut, D. S., Noortgate, N. J. V. D., Janssens, Y., Debunne, N., Langenhove, S. V., Govindarajan, S., Spiegeleer, B. M. J. D., & Wynendaele, E. (2019) · Biochimica et Biophysica Acta (BBA) - Molecular Basis of Disease · doi:10.1016/j.bbadis.2019.165646 · Cited by 50
Li, Y., Li, S., Qiu, Y., Zhou, M., Chen, M., Hu, Y., Hong, S., Jiang, L., & Guo, Y. (2022) · Frontiers in Pediatrics · doi:10.3389/fped.2022.851534 · Cited by 50
Late-onset thymidine kinase 2 deficiency: a review of 18 cases
Domínguez‐González, C., Hernández‐Laín, A., Rivas, E., Voth, A. H., Catalán, J. S., Fernández‐Torrón, R., Fuiza-Luces, C., García‐García, J., Morís, G., Olivé, M., et al. (2019) · Orphanet Journal of Rare Diseases · doi:10.1186/s13023-019-1071-z · Cited by 49
Oba, K., Ishikawa, J., Tamura, Y., Fujita, Y., Ito, M., Iizuka, A., Fujiwara, Y., Kodera, R., Toba, A., Toyoshima, K., et al. (2020) · Geriatrics and gerontology international/Geriatrics & gerontology international · doi:10.1111/ggi.14021 · Cited by 46
Accuracy of FGF‐21 and GDF‐15 for the diagnosis of mitochondrial disorders: A meta‐analysis
Lin, Y., Ji, K., Ma, X., Liu, S., Li, W., Zhao, Y., & Yan, C. (2020) · Annals of Clinical and Translational Neurology · doi:10.1002/acn3.51104 · Cited by 48
Tsygankova, P. G., Itkis, Y. S., Krylova, T., Kurkina, M. V., Bychkov, I. O., Ilyushkina, A., Забненкова, В. В., Mikhaylova, S. V., Pechatnikova, N. L., Sheremet, N. L., et al. (2019) · Journal of Inherited Metabolic Disease · doi:10.1002/jimd.12142 · Cited by 45
Implications of mitochondrial fusion and fission in skeletal muscle mass and health
Romanello, V., & Sandri, M. (2022) · Seminars in Cell and Developmental Biology · doi:10.1016/j.semcdb.2022.02.011 · Cited by 46
Macrophages as a Source and Target of GDF-15
Silva-Bermúdez, L. S., Klüter, H., & Kzhyshkowska, J. G. (2024) · International Journal of Molecular Sciences · doi:10.3390/ijms25137313 · Cited by 44
Myopathology of Adult and Paediatric Mitochondrial Diseases
Phadke, R. (2017) · Journal of Clinical Medicine · doi:10.3390/jcm6070064 · Cited by 43
Gene therapy for primary mitochondrial diseases: experimental advances and clinical challenges
Falabella, M., Minczuk, M. A., Hanna, M. G., Viscomi, C. F., & Pitceathly, R. D. S. (2022) · Nature Reviews Neurology · doi:10.1038/s41582-022-00715-9 · Cited by 42
Mitochondrial stress and GDF15 in the pathophysiology of sepsis
Fujita, Y., Ito, M., & Ohsawa, I. (2020) · Archives of Biochemistry and Biophysics · doi:10.1016/j.abb.2020.108668 · Cited by 42
Manoli, I., Gebremariam, A., McCoy, S., Pass, A. R., Gagné, J., Hall, C., Ferry, S., Ryzin, C. V., Sloan, J. L., Sacchetti, E., et al. (2023) · Journal of Inherited Metabolic Disease · doi:10.1002/jimd.12636 · Cited by 40
Recognition, investigation and management of mitochondrial disease
Davison, J. E., & Rahman, S. (2017) · Archives of Disease in Childhood · doi:10.1136/archdischild-2016-311370 · Cited by 43
Exploring the In Vivo Role of the Mitochondrial Calcium Uniporter in Brown Fat Bioenergetics
Flicker, D., Sancak, Y., Mick, E., Goldberger, O., & Mootha, V. K. (2019) · Cell Reports · doi:10.1016/j.celrep.2019.04.013 · Cited by 42
Sasaki, K., Uchiumi, T., Toshima, T., Yagi, M., Do, Y., Hirai, H., Igami, K., Gotoh, K., & Kang, D. (2020) · Bioscience Reports · doi:10.1042/bsr20201289 · Cited by 42
Berardo, A., Domínguez‐González, C., Engelstad, K., & Hirano, M. (2022) · Journal of Neuromuscular Diseases · doi:10.3233/jnd-210786 · Cited by 38
Domínguez‐González, C., Badosa, C., Madruga‐Garrido, M., Martí, I., Paradas, C., Ortez, C., Díaz‐Manera, J., Berardo, A., Alonso‐Pérez, J., Trifunov, S., et al. (2020) · Scientific Reports · doi:10.1038/s41598-020-66940-8 · Cited by 38
Suzuki, H., Mitsunaga, S., Ikeda, M., Aoyama, T., Yoshizawa, K., Yoshimatsu, H., Kawai, N., Masuda, M., Miura, T., & Ochiai, A. (2021) · Cancers · doi:10.3390/cancers13194842 · Cited by 38
Coleman, V., Sa‐nguanmoo, P., Koenig, J., Schulz, T. J., Grune, T., Klaus, S., Kipp, A. P., & Ost, M. (2018) · Scientific Reports · doi:10.1038/s41598-018-20901-4 · Cited by 39
Koga, Y., Povalko, N., Inoue, E., Nashiki, K., & Tanaka, M. (2019) · Mitochondrion · doi:10.1016/j.mito.2019.02.001 · Cited by 38
Mitochondrial and Metabolic Myopathies
Cohen, B. H. (2019) · CONTINUUM Lifelong Learning in Neurology · doi:10.1212/con.0000000000000805 · Cited by 36
Oikawa, Y., Izumi, R., Koide, M., Hagiwara, Y., Kanzaki, M., Suzuki, N., Kikuchi, K., Matsuhashi, T., Akiyama, Y., Ichijo, M., et al. (2020) · PLoS ONE · doi:10.1371/journal.pone.0231064 · Cited by 36
Endocrine Manifestations and New Developments in Mitochondrial Disease
Ng, Y. S., Lim, A. Z., Panagiotou, G., Turnbull, D. M., & Walker, M. (2021) · Endocrine Reviews · doi:10.1210/endrev/bnab036 · Cited by 37
Mitochondrial Stress and Mitokines: Therapeutic Perspectives for the Treatment of Metabolic Diseases
Zhang, B., Chang, J. Y., Lee, M. H., Ju, S. H., Yi, H., & Shong, M. (2024) · Diabetes & Metabolism Journal · doi:10.4093/dmj.2023.0115 · Cited by 39
Li, P., Lv, H., Zhang, B., Duan, R., Zhang, X., Lin, P., Song, C., & Liu, Y. (2022) · Frontiers in Aging Neuroscience · doi:10.3389/fnagi.2022.869558 · Cited by 36
Karusheva, Y., Ratcliff, M., Mörseburg, A., Barker, P., Melvin, A., Sattar, N. A., Burling, K., Backmark, A., Roth, R. G., Jermutus, L., et al. (2022) · The Journal of Applied Laboratory Medicine · doi:10.1093/jalm/jfac055 · Cited by 37
Cardiac‐Secreted Factors as Peripheral Metabolic Regulators and Potential Disease Biomarkers
Dewey, C. M., Spitler, K. M., Ponce, J., Hall, D. D., & Grueter, C. E. (2016) · Journal of the American Heart Association · doi:10.1161/jaha.115.003101 · Cited by 40
Ferredoxins: master regulators in mitochondrial redox homeostasis and programmed cell death
Lu, Y., Wu, Y., Yang, C., Zhou, Y., Ren, X., Li, H., Huang, H., Pan, F., Deng, A., Lü, Y., et al. (2025) · Redox Biology · doi:10.1016/j.redox.2025.103930 · Cited by 37
Elvstam, O., Medstrand, P., Jansson, M., Isberg, P.-E., Gisslén, M., & Björkman, P. (2019) · HIV Medicine · doi:10.1111/hiv.12756 · Cited by 33
New diagnostic pathways for mitochondrial disease
Watson, E. C., Davis, R. L., & Sue, C. M. (2020) · Journal of Translational Genetics and Genomics · doi:10.20517/jtgg.2020.31 · Cited by 34
Fujii, N., Uta, S., Kobayashi, M., Sato, T., Okita, N., & Higami, Y. (2019) · Experimental Gerontology · doi:10.1016/j.exger.2019.01.001 · Cited by 32
Metadata
- Authors
- Yatsuga, S., Fujita, Y., Ishii, A., Fukumoto, Y., Arahata, H., Kakuma, T., Kojima, T., Ito, M., Tanaka, M., Saiki, R., & Koga, Y.
- Affiliations
- Kurume University (JP)
- Tokyo Metropolitan Institute of Gerontology (JP)
- University of Tsukuba (JP)
- Omuta hospital (JP)
- Toyohashi University of Technology (JP)
- Corresponding author
- Koga, Yasutoshi
- ORCID
- Venue
- Annals of Neurology
- Publisher
- Wiley
- Published
- 2015-10-14
- Volume
- 78
- Issue
- 5
- Pages
- 814-823
- ISSN
- 0364-5134 (ISSN-L)
- 1531-8249
- PMC
- PMC5057301
- OpenAlex
- W1903699046
- Cited by
- 293
- References
- 25
- Citations by year
- 2026: 26 · 2025: 29 · 2024: 29 · 2023: 24 · 2022: 32 · 2021: 35 · 2020: 41 · 2019: 31 · 2018: 14 · 2017: 18 · 2016: 13
- FWCI
- 12.59
- Type
- journal article
- Language
- en
- Open access
- hybrid
- doi.org
- Licence
- Locations
- Annals of Neurology (publishedVersion, cc-by-nc)
- PubMed Central (publishedVersion, cc-by-nc)
- PubMed (publishedVersion)
- Institutional Repositories DataBase (IRDB) (publishedVersion)
- Terrestrial Environment Research Center (University of Tsukuba) (submittedVersion)
- Funders
- Ministry of Education, Culture, Sports, Science and Technology (MEXT) (25461571 (to Y.K.), 25860891 (to S.Y.), 25242062 (to M.T.))
- The Ministry of Health, Labor and Welfare of Japan. (24-Nanchi-Ippan-005 (to Y.K.) for Research on Intractable Diseases)
- Topics
- Health Sciences › Medicine › Cardiology and Cardiovascular Medicine › GDF15 and Related Biomarkers
- Life Sciences › Biochemistry, Genetics and Molecular Biology › Molecular Biology › Mitochondrial Function and Pathology
- Life Sciences › Biochemistry, Genetics and Molecular Biology › Clinical Biochemistry › Metabolism and Genetic Disorders
- Keywords
- growth differentiation factor 15, mitochondrial disease, biomarkers, FGF21, respiratory chain deficiency, serum biomarkers, disease severity, sensitivity and specificity
- MeSH terms
- Adolescent, Adult, Child, Creatine Kinase, Female, Fibroblast Growth Factors, Humans, Male, Middle Aged, ROC Curve, Biomarkers, MELAS Syndrome, Pyruvic Acid, Lactic Acid, Mitochondrial Diseases, Growth Differentiation Factor 15, Young Adult
About these checks
Registry, retraction, Cites and statistics results are computed, not judged, with one exception: a printed reference that no index lists is read once by a model before it counts as a citation error. Claims are extracted by a model and kept only when their quote appears verbatim in the text; each cited source is then checked, with a model’s help, for whether it says what the claim relies on. Those verdicts can be wrong — read the claim’s quote and the cited source before relying on one.
Statistics and arithmetic are recomputed, not judged.
Confidence bands are shown only for fields calibrated on our annotated test set. None is calibrated yet, so no band is shown.
What counts as a claim ›How we measure confidence ›How we check this ›
Are you an author, or do you see a problem with this page? Request a review
