

The DOI matches its Crossref record; 8 of the 8 references it cites were found in a registry or an index.
Complement receptor 1 is expressed on brain cells and in the human brain
Abstract
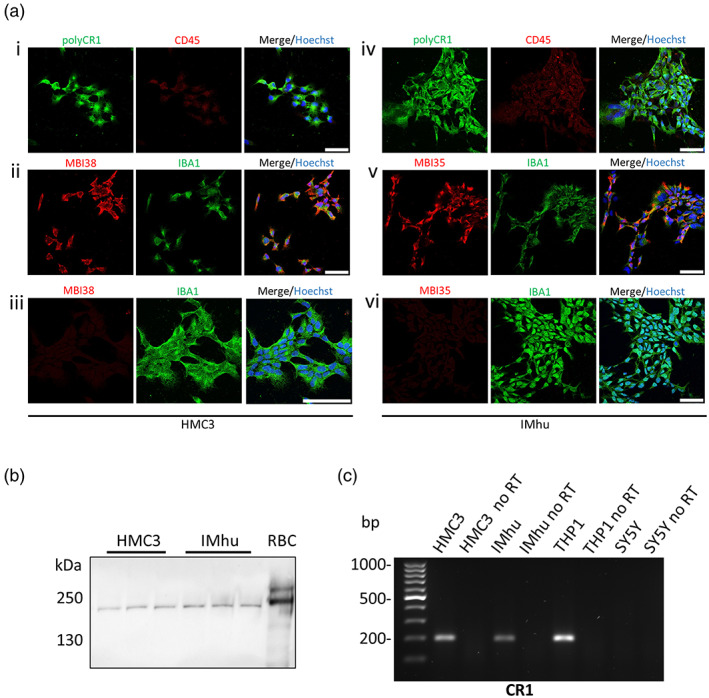
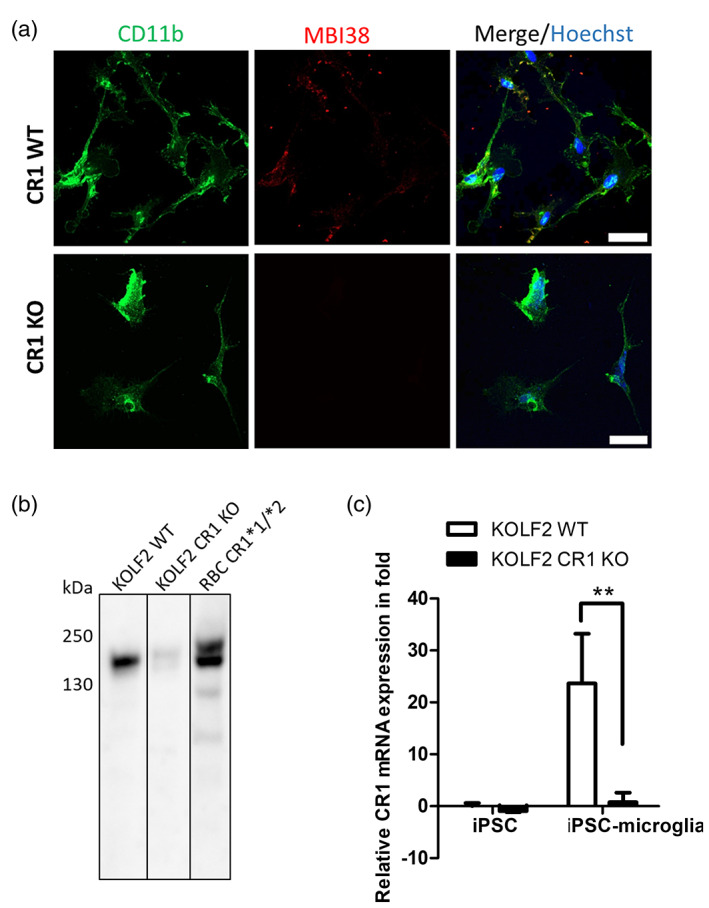
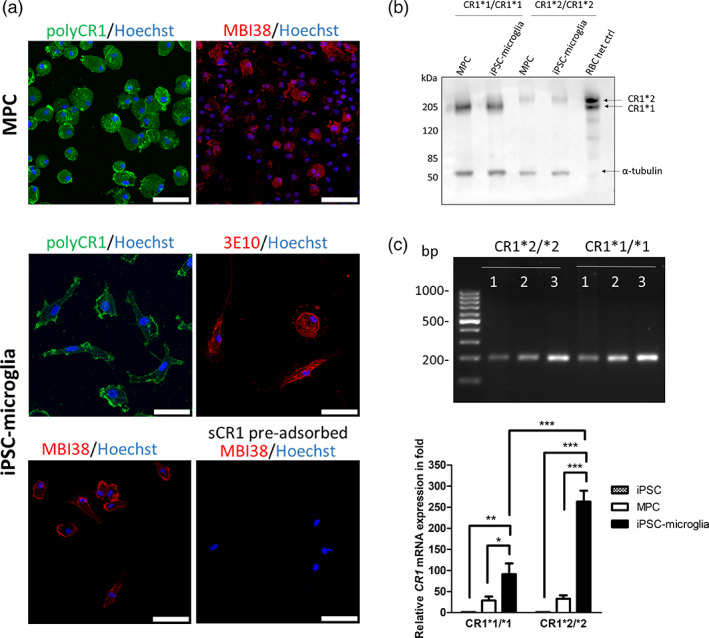
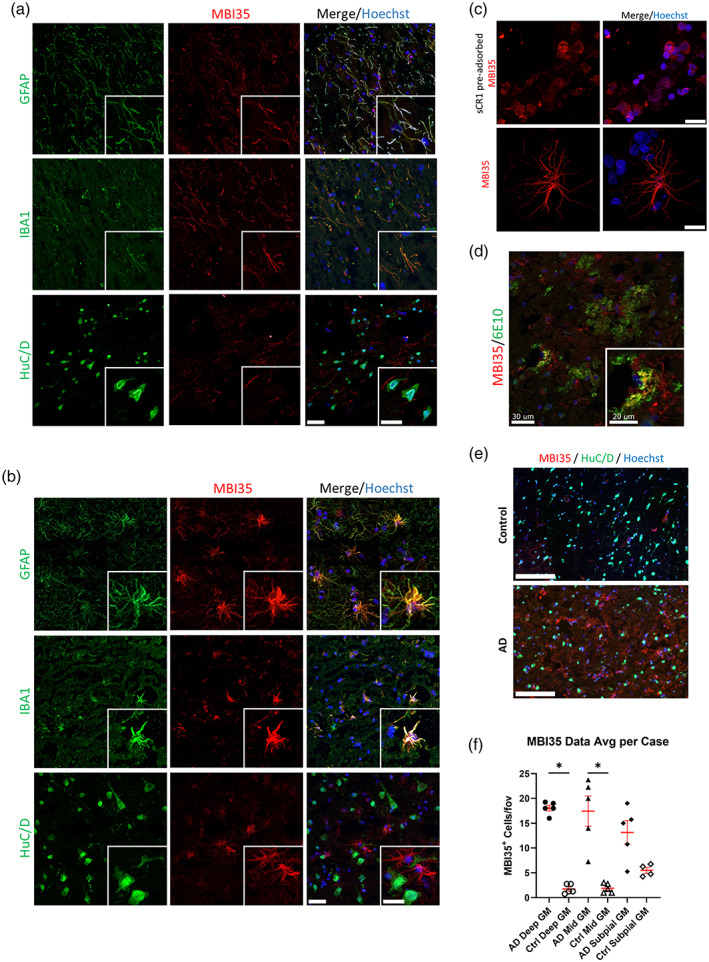
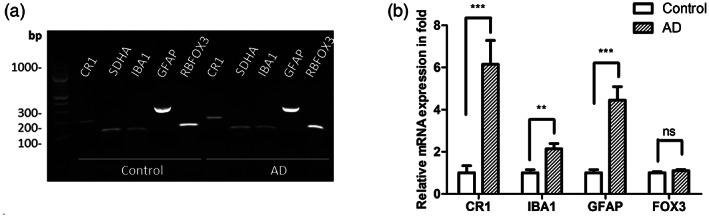
Genome wide association studies (GWAS) have highlighted the importance of the complement cascade in pathogenesis of Alzheimer's disease (AD). Complement receptor 1 (CR1; CD35) is among the top GWAS hits. The long variant of CR1 is associated with increased risk for AD; however, roles of CR1 in brain health and disease are poorly understood. A critical confounder is that brain expression of CR1 is controversial; failure to demonstrate brain expression has provoked the suggestion that peripherally expressed CR1 influences AD risk. We took a multi‐pronged approach to establish whether CR1 is expressed in brain. Expression of CR1 at the protein and mRNA level was assessed in human microglial lines, induced pluripotent stem cell (iPSC)‐derived microglia from two sources and brain tissue from AD and control donors. CR1 protein was detected in microglial lines and iPSC‐derived microglia expressing different CR1 variants when immunostained with a validated panel of CR1‐specific antibodies; cell extracts were positive for CR1 protein and mRNA. CR1 protein was detected in control and AD brains, co‐localizing with astrocytes and microglia, and expression was significantly increased in AD compared to controls. CR1 mRNA expression was detected in all AD and control brain samples tested; expression was significantly increased in AD. The data unequivocally demonstrate that the CR1 transcript and protein are expressed in human microglia ex vivo and on microglia and astrocytes in situ in the human brain; the findings support the hypothesis that CR1 variants affect AD risk by directly impacting glial functions.
Overview
The claims and statistics of this paper haven’t been checked yet.
Run the check — free, no account needed. It reads the open-access text and checks the sources it cites.
Integrity signals
Registry
Cites
Statistics
Figures
Verification
Claims the paper makes
The claims and statistics of this paper haven’t been checked yet.
Run the check — free, no account needed. It reads the open-access text and checks the sources it cites.
Claims other papers make about this one
Each is checked against this paper’s own text: does it say what the citing paper says it does?
The cited source says what the claim attributes to it.
In the citing paper
“Analysis of the risk genes with the highest expression in our iMGs showed that the majority of the genes significantly downregulated by miR-132 (MS4A6A, INPP5D, ACE, CR1) are either increased in the human AD brain or their high expression levels were associated with increased risk of AD [158–161].”
From microRNA-132 attenuates inflammation in induced pluripotent stem cell-derived microglia from Alzheimer’s disease patients (2026) · cites this paper as [161]
Self-check
Percentages, sums and reported differences re-computed from the paper’s own numbers.
The self-check needs the paper’s full text.
Citations
Cites
Harold, D., Abraham, R., Hollingworth, P., Sims, R., Gerrish, A., Hamshere, M. L., Pahwa, J. S., Moskvina, V., Dowzell, K., Williams, A., et al. (2009) · Nature Genetics · doi:10.1038/ng.440 · Cited by 3,326
An anatomically comprehensive atlas of the adult human brain transcriptome
Hawrylycz, M. J., Lein, E. S., Guillozet-Bongaarts, A. L., Shen, E. H., Ng, L., Miller, J. A., van de Lagemaat, L. N., Smith, K. A., Ebbert, A., Riley, Z. L., et al. (2012) · Nature · doi:10.1038/nature11405 · Cited by 3,083
Naj, A. C., Jun, G., Beecham, G. W., Wang, L.-S., Vardarajan, B. N., Buros, J., Gallins, P. J., Buxbaum, J. D., Jarvik, G. P., Crane, P. K., et al. (2011) · Nature Genetics · doi:10.1038/ng.801 · Cited by 1,901
Complement C3 deficiency protects against neurodegeneration in aged plaque-rich APP/PS1 mice
Shi, Q., Chowdhury, S., Ma, R., Le, K. X., Hong, S., Caldarone, B. J., Stevens, B., & Lemere, C. A. (2017) · Science Translational Medicine · doi:10.1126/scitranslmed.aaf6295 · Cited by 593
Haenseler, W., Sansom, S. N., Buchrieser, J., Newey, S. E., Moore, C. S., Nicholls, F. J., Chintawar, S., Schnell, C., Antel, J. P., Allen, N. D., et al. (2017) · Stem Cell Reports · doi:10.1016/j.stemcr.2017.05.017 · Cited by 593
Self-citationExpression of Novel Alzheimer’s Disease Risk Genes in Control and Alzheimer’s Disease Brains
Karch, C. M., Jeng, A. T., Nowotny, P., Cady, J., Cruchaga, C., & Goate, A. M. (2012) · PLoS ONE · doi:10.1371/journal.pone.0050976 · Cited by 328
Complement in the pathogenesis of Alzheimer’s disease
Morgan, B. P. (2018) · Seminars in Immunopathology · doi:10.1007/s00281-017-0662-9 · Cited by 194
Self-citationFonseca, M. I., Chu, S., Pierce, A. L., Brubaker, W. D., Hauhart, R. E., Mastroeni, D., Clarke, E. V., Rogers, J., Atkinson, J. P., & Tenner, A. J. (2016) · PLOS ONE · doi:10.1371/journal.pone.0149792 · Cited by 87
Research works printed but not linked: 45
- 10.1212/nxg.0000000000000012 · DOI · Paper page
- 10.1016/j.molimm.2004.03.004 · DOI
- 10.1016/j.cardiores.2007.07.016 · DOI
- 10.1038/s41588-022-01024-z · DOI · Paper page
- 10.1007/978-1-4939-9170-9_11 · DOI
- 10.1186/1742-2094-3-22 · DOI
- 10.1186/s40478-022-01404-w · DOI · Paper page
- 10.3389/fimmu.2019.00362 · DOI
- 10.3390/brainsci9050111 · DOI
- 10.1016/0022-1759(91)90006-2 · DOI
- 10.1186/s12974-018-1288-0 · DOI
- 10.1016/j.biopsych.2013.01.013 · DOI
- 10.4049/jimmunol.156.6.2247 · DOI
- 10.1056/NEJMoa1211851 · DOI · Paper page
- 10.3233/jad-160420 · DOI
- 10.1042/bj3290183 · DOI
- 10.1016/j.neurobiolaging.2012.07.001 · DOI
- 10.1111/ahg.12000 · DOI · Paper page
- 10.1515/revneuro-2014-0021 · DOI
- 10.1002/0471142905.hg0914s38 · DOI
- 10.1007/bf00687336 · DOI
- 10.1093/braincomms/fcz003 · DOI · Paper page
- 10.4049/jimmunol.2001208 · DOI
- 10.1016/j.jalz.2018.04.003 · DOI
- 10.1034/j.1600-065x.2001.1800110.x · DOI
- 10.1007/s00439-018-1883-2 · DOI · Paper page
- 10.1038/ng.439 · DOI · Paper page
- 10.1038/s41586-020-03060-3 · DOI
- 10.15252/embj.2020105603 · DOI · Paper page
- 10.1523/jneurosci.0829-08.2008 · DOI · Paper page
- 10.1016/j.jalz.2019.03.007 · DOI
- 10.1038/nrd4657 · DOI
- 10.1038/nn.4018 · DOI · Paper page
- 10.4049/jimmunol.152.11.5477 · DOI
- 10.1056/NEJMoa1900866 · DOI
- 10.4049/jimmunol.1203200 · DOI
- 10.1073/pnas.89.21.10016 · DOI · Paper page
- 10.1016/0140-6736(93)91709-u · DOI
- 10.1016/j.jocn.2014.03.015 · DOI
- Singhrao S. K., 1999, Differential expression of individual complement regulators in the brain and choroid plexus, Laboratory Investigation, 79, 1247
- 10.1016/j.biopsych.2012.08.015 · DOI · Paper page
- 10.3390/genes12121990 · DOI
- 10.1007/s00401-002-0624-7 · DOI · Paper page
- 10.1073/pnas.162350199 · DOI · Paper page
- 10.1177/1352458518758927 · DOI
Cited by
Sorted by citations
Microglial phagocytosis in Alzheimer disease
Brown, G. C., St George-Hyslop, P., Paolicelli, R. C., & Lemke, G. (2026) · Nature Reviews Neurology · doi:10.1038/s41582-025-01162-y · Cited by 36
Penning, A., Snoeck, S., Ormaechea, O. R., Ayyildiz, D., Polzer, O., Buitrago-Arango, M., Capobianco, R., de Winter, F., Balusu, S., Verhaagen, J., et al. (2026) · Acta Neuropathologica Communications · doi:10.1186/s40478-026-02228-8 · Cited by 6
Metadata
- Authors
- Daskoulidou, N., Shaw, B., Torvell, M., Watkins, L., Cope, E. L., Carpanini, S. M., Allen, N. D., & Morgan, B. P.
- Affiliations
- UK Dementia Research Institute, Cardiff University Cardiff UK
- School of Biosciences, Cardiff University Cardiff UK
- ORCID
- Venue
- Glia
- Publisher
- Wiley
- Published
- 2023-02-24
- Volume
- 71
- Issue
- 6
- Pages
- 1522-1535
- ISSN
- 0894-1491
- 1098-1136
- PMC
- PMC10953339
- Cited by
- 40
- References
- 8
- Language
- en
- Funders
- Alzheimer's Society (AS‐PG‐17‐005)
- UK Dementia Research Institute
- Medical Research Council
About these checks
Registry, retraction, Cites and statistics results are computed, not judged, with one exception: a printed reference that no index lists is read once by a model before it counts as a citation error. Claims are extracted by a model and kept only when their quote appears verbatim in the text; each cited source is then checked, with a model’s help, for whether it says what the claim relies on. Those verdicts can be wrong — read the claim’s quote and the cited source before relying on one.
Statistics and arithmetic are recomputed, not judged.
Confidence bands are shown only for fields calibrated on our annotated test set. None is calibrated yet, so no band is shown.
What counts as a claim ›How we measure confidence ›How we check this ›
Are you an author, or do you see a problem with this page? Request a review
How to cite
Cite CoChat for the checks on this page, and the paper for its own findings.
- This page
- CoChat. (2026). Citation check: Complement receptor 1 is expressed on brain cells and in the human brain. https://app.cochat.ai/papers/10.1002/glia.24355
- The paper
- Daskoulidou, N., Shaw, B., Torvell, M., Watkins, L., Cope, E. L., Carpanini, S. M., Allen, N. D., & Morgan, B. P. (2023). Complement receptor 1 is expressed on brain cells and in the human brain. Glia. https://doi.org/10.1002/glia.24355
