Cited by 193Autophagy in Disease and TherapyBone Metabolism and DiseasesBone health and osteoporosis research

The DOI matches its Crossref record; 32 of the 33 references it cites were found in a registry or an index.

Glucocorticoid induced autophagy in osteocytes

Open access
Xia, Xuechun, Kar, Rekha, Gluhak-Heinrich, Jelica, Yao, Wei, Lane, Nancy E, Bonewald, Lynda F, Biswas, Sondip K, Lo, Woo-Kuen, Jiang, Jean X·2010·Journal of Bone and Mineral Research

Abstract

Glucocorticoid (GC) therapy is the most frequent cause of secondary osteoporosis. In this study we have demonstrated that GC treatment induced the development of autophagy, preserving osteocyte viability. GC treatment resulted in an increase in autophagy markers and the accumulation of autophagosome vacuoles in vitro and in vivo promoted the onset of the osteocyte autophagy, as determined by expression of autophagy markers in an animal model of GC-induced osteoporosis. An autophagy inhibitor reversed the protective effects of GCs. The effects of GCs on osteocytes were in contrast to tumor necrosis factor α (TNF-α), which induced apoptosis but not autophagy. Together this study reveals a novel mechanism for the effect of GC on osteocytes, shedding new insight into mechanisms responsible for bone loss in patients receiving GC therapy.

Overview

The claims and statistics of this paper haven’t been checked yet.

Run the check — free, no account needed. It reads the open-access text and checks the sources it cites.

A few free checks a day · papers already verified open instantly · results are public

Integrity signals

Registry

Crossref · 10.1002/jbmr.160

Cites

32 of 32 references verified0 citation errors · 0 not checkable

Statistics

Figures

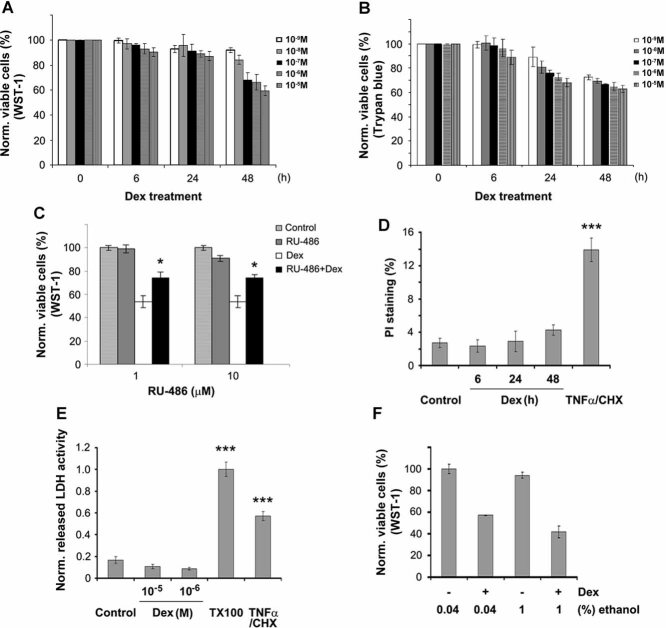
Fig. 1 Reduction of MLO-Y4 cell number by Dex. (A, B) MLO-Y4 cells were treated with Dex at 10−5, 10−6, 10−7, 10−8, and 10−9 M for 0, 6, 24, and 48 hours. The number of viable cells was measured using WST-1 or trypan blue dye exclusion assay. No or few trypan blue cells were detected. (C) Cells were pretreated with 1 or 10 µM RU486 prior to the application of Dex, and the cell number was determined using WST-1. RU486 partially reversed the negative effects of Dex on the number of live MLO-Y4 cells. (1 or 10 µM RU486 plus Dex–treated versus only Dex-treated samples: *p < .05.) (D) Cells were treated with 10−6 M Dex for 6, 24, and 48 hours or with 10 ng/mL of TNF-α/CHX for 6 hours. Cell number was analyzed by PI staining, and the number of PI-labeled cells was quantified. (TNF-α/CHX-treated versus control samples: ***p < .001.) (E) Cell membrane damage was measured by release of the cytoplasmic enzyme lactate dehydrogenase (LDH) from MLO-Y4 cells treated with Dex or TNF-α/CHX. (48 hours of Dex- or TNF-α/CHX-treated versus control: ***p < .001.) (F) Cells were treated with 0.04% or 1% ethanol or Dex dissolved in 0.04% or 1% ethanol, and cytotoxicity was determined using WST-1 assay. All data are presented as mean ± SD and n = 3.
Fig. 1 Reduction of MLO-Y4 cell number by Dex. (A, B) MLO-Y4 cells were treated with Dex at 10−5, 10−6, 10−7, 10−8, and 10−9 M for 0, 6, 24, and 48 hours. The number of viable cells was measured using WST-1 or trypan blue dye exclusion assay. No or few trypan blue cells were detected. (C) Cells were pretreated with 1 or 10 µM RU486 prior to the application of Dex, and the cell number was determined using WST-1. RU486 partially reversed the negative effects of Dex on the number of live MLO-Y4 cells. (1 or 10 µM RU486 plus Dex–treated versus only Dex-treated samples: *p < .05.) (D) Cells were treated with 10−6 M Dex for 6, 24, and 48 hours or with 10 ng/mL of TNF-α/CHX for 6 hours. Cell number was analyzed by PI staining, and the number of PI-labeled cells was quantified. (TNF-α/CHX-treated versus control samples: ***p < .001.) (E) Cell membrane damage was measured by release of the cytoplasmic enzyme lactate dehydrogenase (LDH) from MLO-Y4 cells treated with Dex or TNF-α/CHX. (48 hours of Dex- or TNF-α/CHX-treated versus control: ***p < .001.) (F) Cells were treated with 0.04% or 1% ethanol or Dex dissolved in 0.04% or 1% ethanol, and cytotoxicity was determined using WST-1 assay. All data are presented as mean ± SD and n = 3.CC BY · PubMed Central
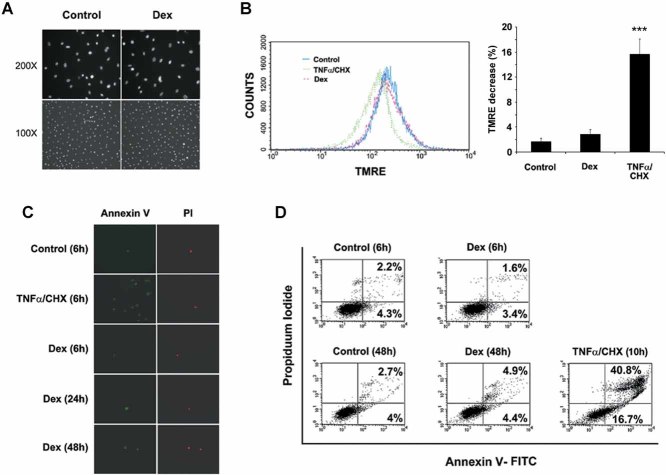
Fig. 2 The major effects of Dex on MLO-Y4 cell number is not due to induced cell apoptosis. (A) MLO-Y4 cells were treated in the absence or presence of 10−6 M Dex for 48 hours and then labeled with DAPI. (B) Cells were treated with 10−6 M Dex or TNF-α/CHX for 48 hours, and suspended cells were stained with 100 nM TMRE and analyzed using flow cytometry and quantified (right panel). (TNF-α/CHX versus control and Dex-treated: ***p < .001.) (C) MLO-Y4 cells treated in the absence or presence of 10−6 M Dex for 6, 24, and 48 hours or TNF-α/CHX for 10 hours, labeled with Annexin-V-FLOUS Staining Kit and PI. (D) After treatment with 10−6 M Dex for 6 and 48 hours or TNF-α/CHX for 10 hours, detached and attached cells were analyzed using flow cytometry.
Fig. 2 The major effects of Dex on MLO-Y4 cell number is not due to induced cell apoptosis. (A) MLO-Y4 cells were treated in the absence or presence of 10−6 M Dex for 48 hours and then labeled with DAPI. (B) Cells were treated with 10−6 M Dex or TNF-α/CHX for 48 hours, and suspended cells were stained with 100 nM TMRE and analyzed using flow cytometry and quantified (right panel). (TNF-α/CHX versus control and Dex-treated: ***p < .001.) (C) MLO-Y4 cells treated in the absence or presence of 10−6 M Dex for 6, 24, and 48 hours or TNF-α/CHX for 10 hours, labeled with Annexin-V-FLOUS Staining Kit and PI. (D) After treatment with 10−6 M Dex for 6 and 48 hours or TNF-α/CHX for 10 hours, detached and attached cells were analyzed using flow cytometry.CC BY · PubMed Central
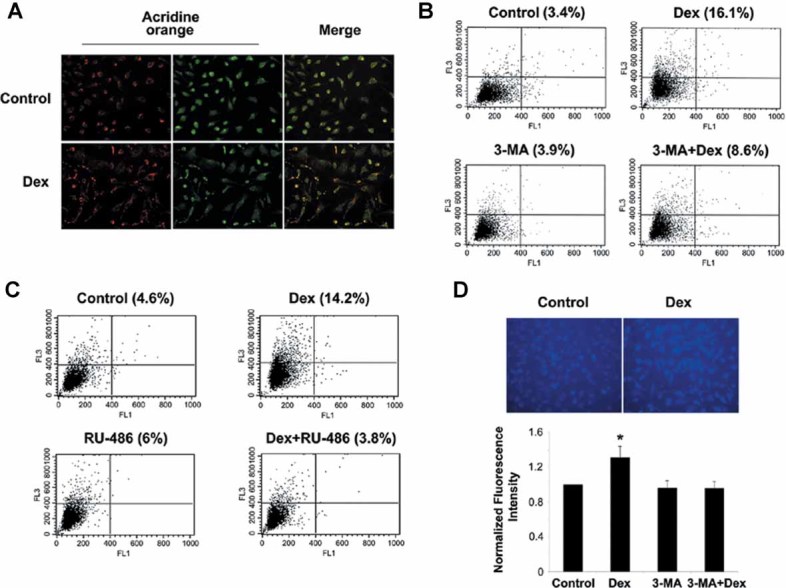
Fig. 3 Induction of autophagy in MLO-Y4 cells by Dex. (A) Dex induced the development of autophagy. MLO-Y4 cells were treated in the absence or presence of 10−6 M Dex for 48 hours and labeled with acridine orange. (B) Cells were treated with 10−6 M Dex for 48 hours in the absence or presence of 0.5 mM 3-MA. 3-MA was added 1 hour prior to Dex treatment. Cells in suspension were labeled with acridine orange and quantified using flow cytometry (gate set at 5%), and the data were analyzed by CellQuest software. FL1-H indicates green color intensity (cytoplasm and nucleus), whereas FL3-H shows red color intensity (AVO). (C) Cells were treated with 10−6 M Dex for 48 hours in the absence or presence of 10 µM RU486. The latter was added 1 hour prior to Dex. Acridine orange–labeled cells in suspension were quantified using flow cytometry. (D) Cells were treated with 10−6 M Dex for 48 hours in the absence or presence of 0.5 mM 3-MA. 3-MA was added 1 hour prior to Dex treatment. Cells then were labeled with MDC, and the intensity of the staining was quantified by measuring fluorescence in cell lysate using a fluorometer. (Dex-treated versus others: *p < .05.) The data are presented as mean ± SD and n = 3.
Fig. 3 Induction of autophagy in MLO-Y4 cells by Dex. (A) Dex induced the development of autophagy. MLO-Y4 cells were treated in the absence or presence of 10−6 M Dex for 48 hours and labeled with acridine orange. (B) Cells were treated with 10−6 M Dex for 48 hours in the absence or presence of 0.5 mM 3-MA. 3-MA was added 1 hour prior to Dex treatment. Cells in suspension were labeled with acridine orange and quantified using flow cytometry (gate set at 5%), and the data were analyzed by CellQuest software. FL1-H indicates green color intensity (cytoplasm and nucleus), whereas FL3-H shows red color intensity (AVO). (C) Cells were treated with 10−6 M Dex for 48 hours in the absence or presence of 10 µM RU486. The latter was added 1 hour prior to Dex. Acridine orange–labeled cells in suspension were quantified using flow cytometry. (D) Cells were treated with 10−6 M Dex for 48 hours in the absence or presence of 0.5 mM 3-MA. 3-MA was added 1 hour prior to Dex treatment. Cells then were labeled with MDC, and the intensity of the staining was quantified by measuring fluorescence in cell lysate using a fluorometer. (Dex-treated versus others: *p < .05.) The data are presented as mean ± SD and n = 3.CC BY · PubMed Central
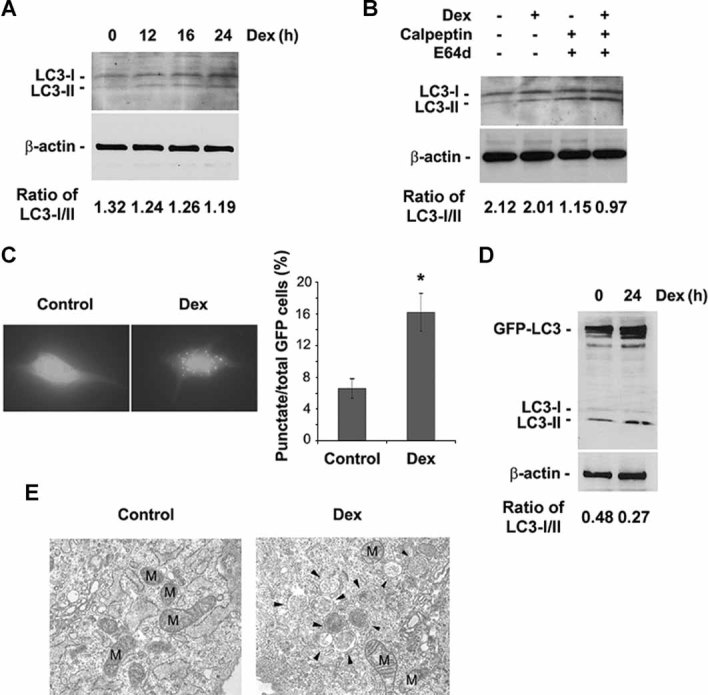
Fig. 4 Dex increased LC3 levels and autophagosome development. (A) MLO-Y4 cells were treated with or without 10−6 M Dex for the indicated times and then subjected to immunoblotting analysis using anti-LC3 or anti-β-actin antibody. The band intensity was quantified, and the ratio of LC3-I/LC3-II was presented at the bottom of the blot. (B) Cells were treated with or without 10−6 M Dex for 24 hours in the absence or presence of E64d (10 mg/mL) or calpeptin (10 mg/mL). The latter two reagents were added 1 hour prior to Dex. The band intensity was quantified, and the ratio of LC3-I/LC3-II was presented at the bottom of the blot. (C) Cells were transiently transfected with GFP-LC3 construct for 24 hours, then treated with or without 10−6 M Dex for an additional 24 hours, and then examined by fluorescence microscopy. The percentage of GFP-LC3+ cells with GFP-LC3 punctate dots was quantified by counting the number of cells showing the punctate pattern of LC3-GFP in 100 GFP+ cells. (Dex versus control: *p < .05.) The data are presented as mean ± SD and n = 3. (D) Cells were treated with 10−6 M Dex for 24 hours after being transiently transfected with GFP-LC3 construct for 24 hours. Cell lysates were analyzed by Western blot. The band intensity was quantified, and the ratio of LC3-I/LC3-II was presented at the bottom of the blot. (E) Cells were treated with 10−6 M Dex for 24 hours, and fixed cells were processed for thin-section electron microscopy. M indicates mitochondrial structures, and arrowheads indicate autophagosomes.
Fig. 4 Dex increased LC3 levels and autophagosome development. (A) MLO-Y4 cells were treated with or without 10−6 M Dex for the indicated times and then subjected to immunoblotting analysis using anti-LC3 or anti-β-actin antibody. The band intensity was quantified, and the ratio of LC3-I/LC3-II was presented at the bottom of the blot. (B) Cells were treated with or without 10−6 M Dex for 24 hours in the absence or presence of E64d (10 mg/mL) or calpeptin (10 mg/mL). The latter two reagents were added 1 hour prior to Dex. The band intensity was quantified, and the ratio of LC3-I/LC3-II was presented at the bottom of the blot. (C) Cells were transiently transfected with GFP-LC3 construct for 24 hours, then treated with or without 10−6 M Dex for an additional 24 hours, and then examined by fluorescence microscopy. The percentage of GFP-LC3+ cells with GFP-LC3 punctate dots was quantified by counting the number of cells showing the punctate pattern of LC3-GFP in 100 GFP+ cells. (Dex versus control: *p < .05.) The data are presented as mean ± SD and n = 3. (D) Cells were treated with 10−6 M Dex for 24 hours after being transiently transfected with GFP-LC3 construct for 24 hours. Cell lysates were analyzed by Western blot. The band intensity was quantified, and the ratio of LC3-I/LC3-II was presented at the bottom of the blot. (E) Cells were treated with 10−6 M Dex for 24 hours, and fixed cells were processed for thin-section electron microscopy. M indicates mitochondrial structures, and arrowheads indicate autophagosomes.CC BY · PubMed Central
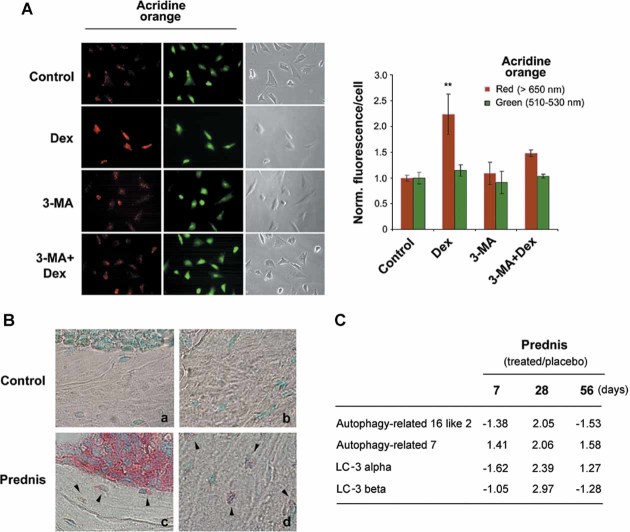
Fig. 5 GCs increased markers of autophagy in primary osteocytes and in osteocytes within bone tissues from GC-treated mice. (A) Primary osteocytes isolated from chicken calvaria were treated with or without 10−6 Dex for 48 hours in the absence or presence of 3-MA (0.5 mM). 3-MA was added 1 hour before Dex treatment. Cells then were labeled with acridine orange, and green and red fluorescence was detected in acridine orange–stained cells using a fluorescence microscope (left panel). The staining intensity of acridine orange in the acquired images was quantified with NIH ImageJ analysis software (right panel). About 100 cells per sample were analyzed and normalized to control. (Red fluorescence in Dex-treated cells versus other treatment: **p < .01; *p < 0.05.) The data are presented as mean ± SD and n = 3. (B) Mice were treated with 5 mg of prednisolone for 60 days (prednis) (c and d) or with placebo (controls) (a and b). Paraffin sections were immunolabeled with anti-LC3 antibody, followed by incubation with AP-linked anti-rabbit secondary antibody, and counterstained with methyl-green. Arrowheads indicate LC3-labeled osteocytes. (C) RNA was extracted from the long bones of placebo- or prednisolone (prednis)–treated mice, gene microarray was conducted, and raw data were processed. Transcripts related to autophagy are increased after prednisolone treatment.
Fig. 5 GCs increased markers of autophagy in primary osteocytes and in osteocytes within bone tissues from GC-treated mice. (A) Primary osteocytes isolated from chicken calvaria were treated with or without 10−6 Dex for 48 hours in the absence or presence of 3-MA (0.5 mM). 3-MA was added 1 hour before Dex treatment. Cells then were labeled with acridine orange, and green and red fluorescence was detected in acridine orange–stained cells using a fluorescence microscope (left panel). The staining intensity of acridine orange in the acquired images was quantified with NIH ImageJ analysis software (right panel). About 100 cells per sample were analyzed and normalized to control. (Red fluorescence in Dex-treated cells versus other treatment: **p < .01; *p < 0.05.) The data are presented as mean ± SD and n = 3. (B) Mice were treated with 5 mg of prednisolone for 60 days (prednis) (c and d) or with placebo (controls) (a and b). Paraffin sections were immunolabeled with anti-LC3 antibody, followed by incubation with AP-linked anti-rabbit secondary antibody, and counterstained with methyl-green. Arrowheads indicate LC3-labeled osteocytes. (C) RNA was extracted from the long bones of placebo- or prednisolone (prednis)–treated mice, gene microarray was conducted, and raw data were processed. Transcripts related to autophagy are increased after prednisolone treatment.CC BY · PubMed Central
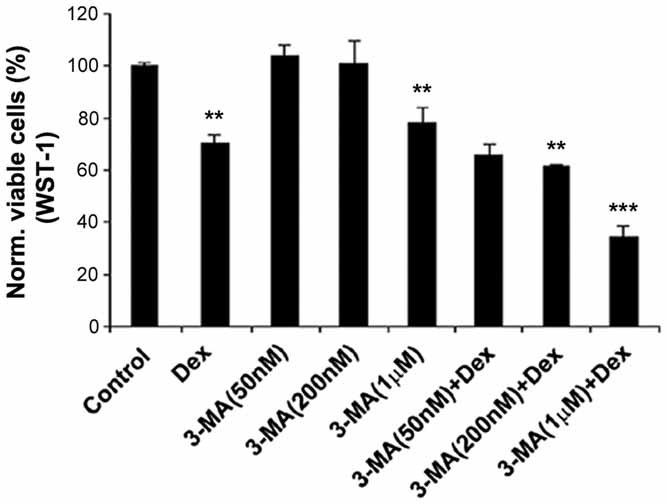
Fig. 6 The reduction in normal cell number by Dex was augmented by 3-MA. MLO-Y4 cells were pretreated in the absence or presence of 50 and 200 nM and 1 µM of 3-MA prior to application of 10−6 M Dex. Cell viability was determined using WST-1. [Dex or 3-MA (1 µM) versus control: **p < .01; 3-MA (200nM) + Dex versus Dex: **p < .01; 3-MA (1 µM) + Dex versus Dex: ***p < .001.] All data are presented as mean ± SD and n = 3.
Fig. 6 The reduction in normal cell number by Dex was augmented by 3-MA. MLO-Y4 cells were pretreated in the absence or presence of 50 and 200 nM and 1 µM of 3-MA prior to application of 10−6 M Dex. Cell viability was determined using WST-1. [Dex or 3-MA (1 µM) versus control: **p < .01; 3-MA (200nM) + Dex versus Dex: **p < .01; 3-MA (1 µM) + Dex versus Dex: ***p < .001.] All data are presented as mean ± SD and n = 3.CC BY · PubMed Central

Verification

Claims the paper makes

The claims and statistics of this paper haven’t been checked yet.

Run the check — free, no account needed. It reads the open-access text and checks the sources it cites.

A few free checks a day · papers already verified open instantly · results are public

Claims other papers make about this one

Each is checked against this paper’s own text: does it say what the citing paper says it does?

Self-check

Percentages, sums and reported differences re-computed from the paper’s own numbers.

The self-check needs the paper’s full text.

Citations

Cites

Show all 33 references

Cited by

Sorted by citations

  • The amazing osteocyte

    Bonewald, L. F. (2011) · Journal of Bone and Mineral Research · doi:10.1002/jbmr.320 · Cited by 2,287

    “In addition to undergoing programmed cell death, osteocytes can undergo a process of self-preservation called autophagy, especially in response to glucocorticoid.((44)) Autophagy is a lysosomal degradation process necessary for recycling of cellular products.”
    BackgroundSelf-citation
  • The Osteocyte: An Endocrine Cell … and More

    Dallas, S. L., Prideaux, M., & Bonewald, L. F. (2013) · Endocrine Reviews · doi:10.1210/er.2012-1026 · Cited by 1,042

    Self-citation
  • Autophagy in osteoblasts is involved in mineralization and bone homeostasis

    Nollet, M., Santucci-Darmanin, S., Breuil, V., Al-Sahlanee, R., Cros, C., Topi, M., Momier, D., Samson, M., Pagnotta, S., Cailleteau, L., et al. (2014) · Autophagy · doi:10.4161/auto.36182 · Cited by 422

    “Autophagy was first shown to be a major survival mechanism of the long-lived osteocytes in stressful environments.(31,32,33) Recent work by Onal M.”
    Background
  • The role of autophagy in bone metabolism and clinical significance

    Wang, J., Zhang, Y., Cao, J., Wang, Y., Anwar, N., Zhang, Z., Zhang, D., Ma, Y., Xiao, Y., Xiao, L., et al. (2023) · Autophagy · doi:10.1080/15548627.2023.2186112 · Cited by 337

    “GC treatment results in increased expression of autophagy markers (LC3A, LC3B, ATG2, ATG7), and the accumulation of autophagosomes in vitro and in vivo, suggesting the promoted autophagy level in osteocytes [51].”
    Background
  • Autophagy in stem cells

    Guan, J., Simon, A. K., Prescott, M., Menéndez, J. A., Liu, F., Wang, F., Wang, C., Wolvetang, E. J., Vázquez‐Martín, A., & Zhang, J. (2013) · Autophagy · doi:10.4161/auto.24132 · Cited by 292

    “The specific depletion of BECN1 notably reduces both the size and formation efficiency of mammospheres, thus development of autophagy, preserving osteocyte viability depending on glucocorticoid dose.(129,130) Osteoblasts are the precursor of osteocytes and are responsible for bone formation.”
    Background

See all 193

Metadata

Authors
Xia, X., Kar, R., Gluhak-Heinrich, J., Yao, W., Lane, N. E., Bonewald, L. F., Biswas, S. K., Lo, W.-K., & Jiang, J. X.
Affiliations
  • The University of Texas at San Antonio Health Science Center (US)
  • Department of Orthodontics, University of Texas Health Science Center, San Antonio, TX, USA
  • University of California Davis Medical Center (US)
  • University of Missouri–Kansas City (US)
  • Morehouse School of Medicine (US)
Corresponding author
Jiang, Jean X
Venue
Journal of Bone and Mineral Research
Published
2010-10-25
Volume
25
Issue
11
Pages
2479-2488
ISSN
  • 0884-0431 (ISSN-L)
  • 1523-4681
OpenAlex
W2004485238
Cited by
193
References
33
Citations by year
2026: 8 · 2025: 3 · 2024: 4 · 2023: 9 · 2022: 8 · 2021: 12 · 2020: 12 · 2019: 13 · 2018: 16 · 2017: 11 · 2016: 12 · 2015: 18 · 2014: 22 · 2013: 21 · 2012: 16
FWCI
10.47
Type
journal article
Language
en
Open access
Locations
  • Journal of Bone and Mineral Research (publishedVersion)
  • PubMed Central (publishedVersion, cc-by)
  • PubMed (publishedVersion)
  • eScholarship (California Digital Library) (submittedVersion)
  • eScholarship (California Digital Library) (submittedVersion, cc-by)
Funders
  • Tokyo Medical and Dental University
  • National Institutes of Health (AQ‐1507, and K24, AR46798)
  • National Institute of Arthritis and Musculoskeletal and Skin Diseases (K24-AR04884, R01AR043052, K24AR048841, P01AR046798, P01AR46798)
  • Eunice Kennedy Shriver National Institute of Child Health and Human Development (K12 HD05195801, K12HD051958)
Topics
  • Life Sciences › Biochemistry, Genetics and Molecular Biology › Cell Biology › Autophagy in Disease and Therapy
  • Life Sciences › Biochemistry, Genetics and Molecular Biology › Molecular Biology › Bone Metabolism and Diseases
  • Health Sciences › Medicine › Orthopedics and Sports Medicine › Bone health and osteoporosis research
Keywords
glucocorticoids, autophagy, osteocytes, glucocorticoid-induced osteoporosis, autophagosomes, osteocyte viability, autophagy inhibition, TNF-α, apoptosis, bone loss
MeSH terms
Adenine, Animals, Autophagy, Cell Count, Cell Line, Chickens, Dexamethasone, Glucocorticoids, Microtubule-Associated Proteins, Osteocytes, Phagosomes, Biomarkers, Apoptosis, Rats

About these checks

Registry, retraction, Cites and statistics results are computed, not judged, with one exception: a printed reference that no index lists is read once by a model before it counts as a citation error. Claims are extracted by a model and kept only when their quote appears verbatim in the text; each cited source is then checked, with a model’s help, for whether it says what the claim relies on. Those verdicts can be wrong — read the claim’s quote and the cited source before relying on one.

Statistics and arithmetic are recomputed, not judged.

Confidence bands are shown only for fields calibrated on our annotated test set. None is calibrated yet, so no band is shown.

What counts as a claim ›How we measure confidence ›How we check this ›

Are you an author, or do you see a problem with this page? Request a review