

The DOI matches its Crossref record; 30 of the 31 references it cites were found in a registry or an index.
Diagnosis of sarcopenia by evaluating skeletal muscle mass by adjusted bioimpedance analysis validated with dual-energy X-ray absorptiometry
Open accessAbstract
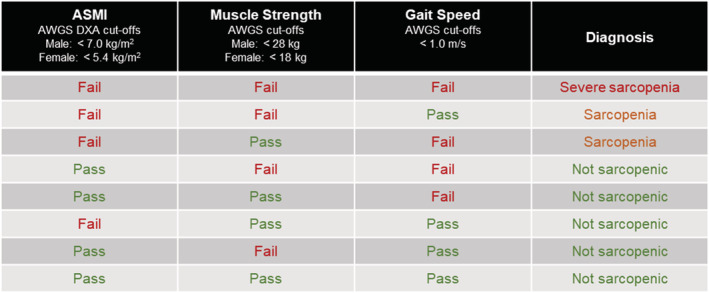
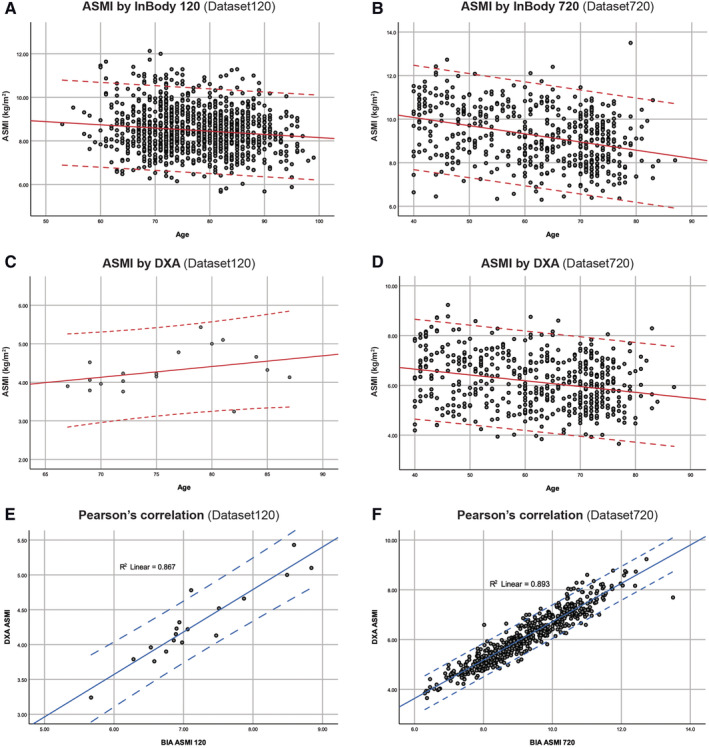
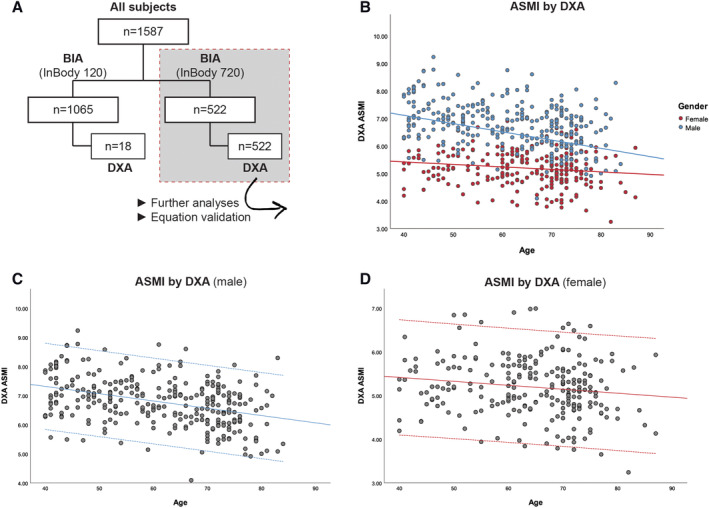
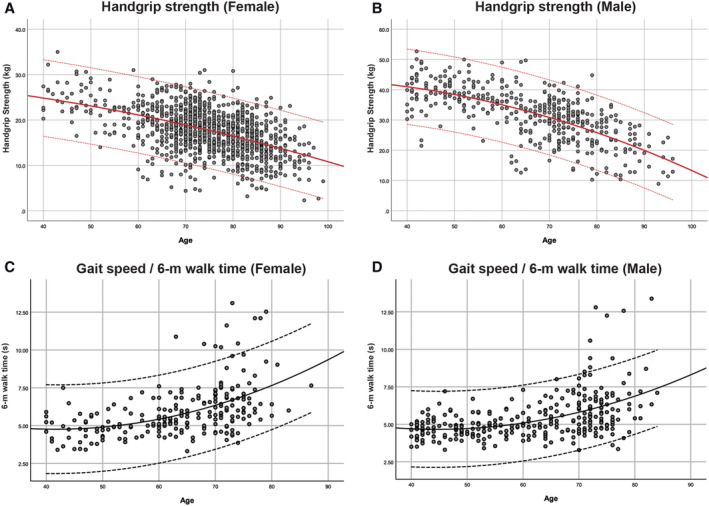
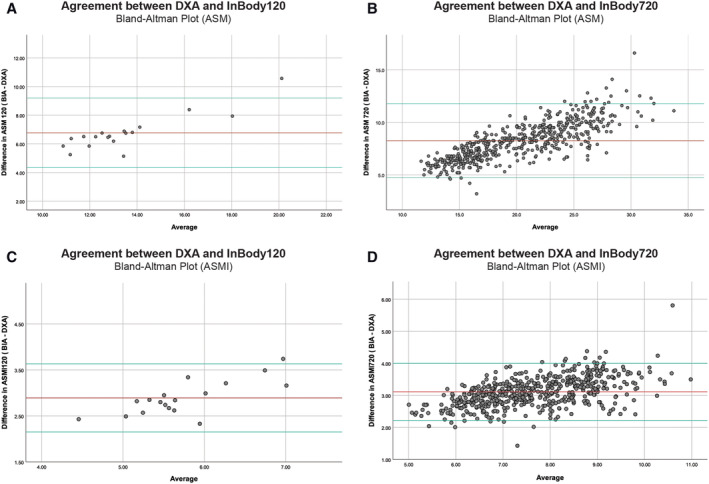
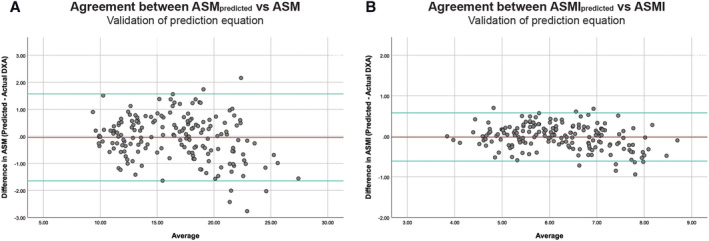
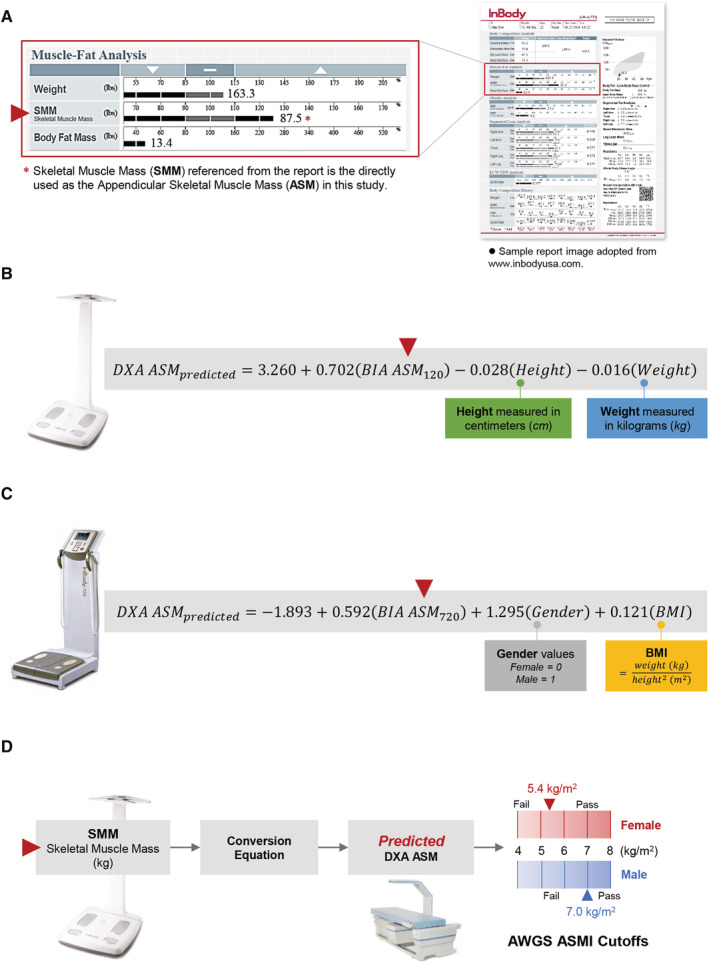
Abstract Background This study aimed to adjust and cross‐validate skeletal muscle mass measurements between bioimpedance analysis (BIA) and dual‐energy X‐ray absorptiometry (DXA) for the screening of sarcopenia in the community and to estimate the prevalence of sarcopenia in Hong Kong. Methods Screening of sarcopenia was provided to community‐dwelling older adults. Appendicular skeletal muscle mass (ASM) was evaluated by BIA (InBody 120 or 720) and/or DXA. Handgrip strength and/or gait speed were assessed. Diagnosis of sarcopenia was based on the 2019 revised Asian Working Group for Sarcopenia cut‐offs. Agreement analysis was performed to cross‐validate ASM measurements by BIA and DXA. Multiple regression was used to explore contribution of measured parameters in predicting DXA ASM from BIA. Results A total of 1587 participants (age = 72 ± 12 years) were recruited; 1065 participants were screened by BIA (InBody 120) with 18 followed up by DXA, while the remaining 522 participants were assessed by the BIA (InBody 720) and DXA. The appendicular skeletal muscle mass index (ASMI) evaluated by BIA showed a mean difference of 2.89 ± 0.38 kg/m 2 (InBody 120) and 2.97 ± 0.45 kg/m 2 (InBody 720) against DXA gold standard. A significant overestimation of muscle mass was measured by BIA compared with DXA ( P < 0.005). BIA data were adjusted using prediction equation and mean difference reduced to −0.02 ± 0.31 kg/m 2 in cross‐validation. Prevalence of sarcopenia in older adults ≥65 ranged from 39.4% (based on ASMI by DXA) to 40.8% (based on predicted DXA ASMI from BIA). Low ASMI by DXA was found in 68.5% of the older adults screened. The percentage of older adults exhibited low handgrip strength ranged from 31.3% to 56%, while 49% showed low gait speed. Conclusions Bioimpedance analysis was found to overestimate skeletal muscle mass compared with DXA. With adjustment equations, BIA can be used as a quick and reliable tool for screening sarcopenia in community and clinical settings with limited access to better options.
Overview
The claims and statistics of this paper haven’t been checked yet.
Run the check — free, no account needed. It reads the open-access text and checks the sources it cites.
Integrity signals
Registry
Cites
Statistics
Figures
Verification
Claims the paper makes
The claims and statistics of this paper haven’t been checked yet.
Run the check — free, no account needed. It reads the open-access text and checks the sources it cites.
Claims other papers make about this one
Each is checked against this paper’s own text: does it say what the citing paper says it does?
In the citing paper
“We previously found that the value of muscle mass index detected by BIA (InBody 120) was 2.89 ± 0.38 kg/m2 higher than measured by dual-energy X-ray absorptiometry (DXA) (Horizon, Hologic, Marlborough, MA, USA), which was considered the gold standard (18).”
From The role of obesity in sarcopenia and the optimal body composition to prevent against sarcopenia and obesity (2023) · cites this paper as [18]
Self-check
Percentages, sums and reported differences re-computed from the paper’s own numbers.
The self-check needs the paper’s full text.
Citations
Cites
Sarcopenia: revised European consensus on definition and diagnosis
Cruz-Jentoft, A. J., Bahat, G., Bauer, J., Boirie, Y., Bruyère, O., Cederholm, T., Cooper, C., Landi, F., Rolland, Y., Sayer, A. A., et al. (2019) · Age and Ageing · doi:10.1093/ageing/afy169 · Cited by 13,818
Sarcopenia: European consensus on definition and diagnosis
Cruz-Jentoft, A. J., Baeyens, J. P., Bauer, J. M., Boirie, Y., Cederholm, T., Landi, F., Martin, F. C., Michel, J.-P., Rolland, Y., Schneider, S. M., et al. (2010) · Age and Ageing · doi:10.1093/ageing/afq034 · Cited by 11,601
Asian Working Group for Sarcopenia: 2019 Consensus Update on Sarcopenia Diagnosis and Treatment
Chen, L.-K., Woo, J., Assantachai, P., Auyeung, T.-W., Chou, M.-Y., Iijima, K., Jang, H. C., Kang, L., Kim, M., Kim, S., et al. (2020) · Journal of the American Medical Directors Association · doi:10.1016/j.jamda.2019.12.012 · Cited by 7,070
Sarcopenia in Asia: Consensus Report of the Asian Working Group for Sarcopenia
Chen, L.-K., Liu, L.-K., Woo, J., Assantachai, P., Auyeung, T.-W., Bahyah, K. S., Chou, M.-Y., Chen, L.-Y., Hsu, P.-S., Krairit, O., et al. (2014) · Journal of the American Medical Directors Association · doi:10.1016/j.jamda.2013.11.025 · Cited by 4,051
Cruz-Jentoft, A. J., & Sayer, A. A. (2019) · The Lancet · doi:10.1016/s0140-6736(19)31138-9 · Cited by 3,905
Sarcopenia: revised European consensus on definition and diagnosis
Cruz-Jentoft, A. J., Bahat, G., Bauer, J., Boirie, Y., Bruyère, O., Cederholm, T., Cooper, C., Landi, F., Rolland, Y., Sayer, A. A., et al. (2019) · Age and Ageing · doi:10.1093/ageing/afz046 · Cited by 3,803
SARC-F: A simple questionnaire to rapidly diagnose sarcopenia
Malmstrom, T. K., & Morley, J. E. (2013) · Journal of the American Medical Directors Association · doi:10.1016/j.jamda.2013.05.018 · Cited by 1,319
Ling, C. H. Y., de Craen, A. J. M., Slagboom, P. E., Gunn, D. A., Stokkel, M. P. M., Westendorp, R. G. J., & Maier, A. B. (2011) · Clinical Nutrition · doi:10.1016/j.clnu.2011.04.001 · Cited by 646
Cao, L., & Morley, J. E. (2016) · Journal of the American Medical Directors Association · doi:10.1016/j.jamda.2016.06.001 · Cited by 424 · cited 2×
“Sarcopenia is an age-related generalized loss of skeletal muscle mass and strength1 that is recently recognized as an independent condition by the International Classification of Diseases, Tenth Revision, Clinical Modification.2 With guidelines suggested by the European Working Group on Sarcopenia in Older People in 2…”
BackgroundValidating the SARC-F: A Suitable Community Screening Tool for Sarcopenia?
Woo, J., Leung, J., & Morley, J. E. (2014) · Journal of the American Medical Directors Association · doi:10.1016/j.jamda.2014.04.021 · Cited by 422
Cited by
Sorted by citations
Liu, C., Wong, P. Y., Chung, Y. L., Chow, S. K., Cheung, W. H., Law, S. W., Chan, J. C. N., & Wong, R. M. Y. (2023) · Obesity Reviews · doi:10.1111/obr.13534 · Cited by 247
Self-citationMolecular Mechanisms of Inflammation in Sarcopenia: Diagnosis and Therapeutic Update
Jiménez-Gutiérrez, G. E., Martínez-Gómez, L. E., Martínez-Armenta, C., Pineda, C., Martínez‐Nava, G. A., & López-Reyes, A. G. (2022) · Cells · doi:10.3390/cells11152359 · Cited by 245
Liu, C., Cheng, K. Y.-K., Tong, X., Cheung, W.-H., Chow, S. K.-H., Law, S. W., & Wong, R. M. Y. (2023) · Frontiers in Endocrinology · doi:10.3389/fendo.2023.1077255 · Cited by 88
Self-citationLiu, C., Wong, P. Y., Wang, Q., Wong, H. Y., Huang, T., Cui, C., Zhang, N., Cheung, W., & Wong, R. M. Y. (2024) · Journal of Cachexia Sarcopenia and Muscle · doi:10.1002/jcsm.13573 · Cited by 96
Self-citationWang, Z., Xu, X., Gao, S., Wu, C., Song, Q., Shi, Z., Su, J., & Zang, J. (2022) · Nutrients · doi:10.3390/nu14122458 · Cited by 66
Assar, M. E., Rodríguez-Sánchez, I., Álvarez‐Bustos, A., & Rodríguez‐Mañas, L. (2024) · Molecular Aspects of Medicine · doi:10.1016/j.mam.2024.101271 · Cited by 53
Hämäläinen, O., Tirkkonen, A., Savikangas, T., Alén, M., Sipilä, S., & Hautala, A. J. (2024) · BMC Geriatrics · doi:10.1186/s12877-024-04764-1 · Cited by 47
Sarcopenia in the era of precision health: Toward personalized interventions for healthy longevity
Chen, L. (2024) · Journal of the Chinese Medical Association · doi:10.1097/jcma.0000000000001164 · Cited by 48
da Rosa, T. H., Peterson, L., Bartikoski, B. J., Portes, J. K. S., Santo, R. C. D. E., & Xavier, R. M. (2022) · Arthritis Research & Therapy · doi:10.1186/s13075-022-02858-y · Cited by 41
Wong, R. M. Y., Cheung, W., Chow, S. K., Ng, R. W. K., Li, W., Yung-Chak, H. A., Wong, K. K., Ho, A. W., Choi, S.-H., Fang, C. X., et al. (2022) · Journal of Orthopaedic Translation · doi:10.1016/j.jot.2022.09.010 · Cited by 35
Self-citationResearch progress on sarcopenia in the musculoskeletal system
Mao, X., Lv, K., Qi, W., Cheng, W., Li, T., Sun, Y., Jin, H., Pan, H., & Wang, D. (2025) · Bone Research · doi:10.1038/s41413-025-00455-8 · Cited by 37
Pathophysiology of Myopenia in rheumatoid arthritis
Jin, H., Wang, G., Lu, Q., Rawlins, J., Chen, J., Kashyap, S., Charlesworth, O., Xu, D., Dai, L., Zhu, S., et al. (2025) · Bone Research · doi:10.1038/s41413-025-00438-9 · Cited by 23
Investigating the efficacy of AI-enhanced telerehabilitation in sarcopenic older individuals
Wei, M., Meng, D., He, S., Lv, Z., Guo, H., Yang, G., & Wang, Z. (2024) · European Geriatric Medicine · doi:10.1007/s41999-024-01082-y · Cited by 18
Challenges in the Management of Sarcopenia in the Primary Care Setting: A Scoping Review
Kandayah, T., Safian, N., Shah, S. A., & Manaf, M. R. A. (2023) · International Journal of Environmental Research and Public Health · doi:10.3390/ijerph20065179 · Cited by 18
Tong, B., Chen, H., Wang, M., Liu, P., Wang, C., Zeng, W., Li, D., & Shang, S. (2024) · BMJ Open · doi:10.1136/bmjopen-2023-076043 · Cited by 18
Lin, T., Huang, X., Guo, D., Zhao, Y., Song, Q., Liang, R., Jiang, T., Tu, X., Deng, C., & Yue, J. (2022) · Journal of the American Geriatrics Society · doi:10.1111/jgs.18118 · Cited by 17
Associations of Serum CXCL12α and CK Levels with Skeletal Muscle Mass in Older Adults
Chen, Z., Laurentius, T., Fait, Y., Müller, A., Mückter, E., Bollheimer, L. C., & Nourbakhsh, M. (2023) · Journal of Clinical Medicine · doi:10.3390/jcm12113800 · Cited by 16
Hsu, Y.-T., Lin, J.-Y., Lin, C., Lee, Y., & Chang, W. (2023) · Nutrients · doi:10.3390/nu15183892 · Cited by 16
Exploring the Landscape of Ubiquitous In-home Health Monitoring: A Comprehensive Survey
Pourpanah, F., & Etemad, A. (2024) · ACM Transactions on Computing for Healthcare · doi:10.1145/3670854 · Cited by 19
Zhou, T., Ye, J., Lin, Y., Wang, W., Feng, S., Zhuo, S., & Zhong, B. (2023) · British Journal Of Nutrition · doi:10.1017/s0007114523000399 · Cited by 15
Prevalence of sarcopenia and depressive symptoms among older adults: a scoping review
Ganggaya, K. S., Vanoh, D., & Ishak, W. R. W. (2023) · Psychogeriatrics · doi:10.1111/psyg.13060 · Cited by 16
Lu, Z., Hu, Y., He, H., Chen, X., Ou, Q., Liu, Y., Xu, T., Tu, J., Li, A., Lin, B., et al. (2024) · Diabetes Research and Clinical Practice · doi:10.1016/j.diabres.2024.111783 · Cited by 17
Qu, Y., Zhang, L., Liu, Y., Fu, Y., Wang, M., Liu, C., Wang, X., Wan, Y., Xu, B., Zhang, Q., et al. (2024) · Frontiers in Immunology · doi:10.3389/fimmu.2024.1437980 · Cited by 15
Potential of Fatty Acids in Treating Sarcopenia: A Systematic Review
Huang, T., Liu, C., Cui, C., Zhang, N., Cheung, W., & Wong, R. (2023) · Nutrients · doi:10.3390/nu15163613 · Cited by 15
Self-citationJung, W., Juang, U., Gwon, S., Nguyen, H., Huang, Q., Lee, S., Lee, B., Kwon, S., Kim, S., & Park, J. (2024) · Molecular Medicine Reports · doi:10.3892/mmr.2024.13222 · Cited by 14
Wang, Y., Chen, Y., Zhang, L., Zhuang, L., Yang, Q., Wu, Q., Tang, Z., Shi, S., Fei, B., Chen, L., et al. (2024) · Scientific Reports · doi:10.1038/s41598-024-78957-4 · Cited by 14
Zhou, Y., Sun, C. C., Zhao, R., Dong, C., Gu, Z., & Gao, J. (2025) · European Geriatric Medicine · doi:10.1007/s41999-024-01139-y · Cited by 13
Sales, W. B., Macêdo, S. G. G. F., Gonçalves, R. S. D. S. A., de Andrade, L. E. L., Ramalho, C. S. T., Souza, G. F., & Maciel, Á. C. C. (2024) · Journal of Bodywork and Movement Therapies · doi:10.1016/j.jbmt.2024.02.015 · Cited by 13
Ying, L., Xu, L., Yang, J. H., & Zhang, Q. (2024) · Scientific Reports · doi:10.1038/s41598-024-62825-2 · Cited by 13
Very high prevalence of osteosarcopenia in hip fracture patients: risk and protective factors
Wong, R. M. Y., Wong, P. Y., Chau, W., Liu, C., Zhang, N., & Cheung, W. (2025) · Journal of Orthopaedic Surgery and Research · doi:10.1186/s13018-025-05828-7 · Cited by 15
Self-citationChow, S. K., van Mourik, M., Hung, V. W.-Y., Zhang, N., Li, M. C. M., Wong, R. M. Y., Leung, K., & Cheung, W. (2022) · Journal of Personalized Medicine · doi:10.3390/jpm12061016 · Cited by 12
Self-citationShi, J., Wu, Y., Zhu, S., Xie, Y., & Xiang, M. (2023) · Reviews in Cardiovascular Medicine · doi:10.31083/j.rcm2409275 · Cited by 12
Wang, S., Zhang, X., Qu, B., Yang, K., Hu, Y., Liu, H., Hong, J. K., Niu, H., & Yang, H. (2024) · Clinical Interventions in Aging · doi:10.2147/cia.s464187 · Cited by 12
Park, H. A., Sung, J., Chang, Y., Ryu, S., Yoon, K. J., Kim, H., & Kim, H. (2024) · Journal of Cachexia Sarcopenia and Muscle · doi:10.1002/jcsm.13636 · Cited by 13
Radecka, A., & Lubkowska, A. (2023) · Diagnostics · doi:10.3390/diagnostics13091576 · Cited by 16
Research progress on evaluation methods for skeletal muscle mass assessment in sarcopenia (Review)
Wu, W., Liu, M., Zeng, Q., Tang, C., & Huo, J. (2025) · Oncology Letters · doi:10.3892/ol.2025.15169 · Cited by 11
Lu, Z., Hu, Y., Chen, X., Ou, Q., Liu, Y., Xu, T., Tu, J., Li, A., Lin, B., Liu, Q., et al. (2024) · Nutrition Journal · doi:10.1186/s12937-024-01007-2 · Cited by 11
Ang, S. W., Liew, J. J. L., Dharmaratnam, V. M., Yik, V., Kok, S., Aftab, S., Tong, C., Lee, H.-B., Mah, S., Yan, C. C. K., et al. (2024) · Annals of Coloproctology · doi:10.3393/ac.2024.00080.0011 · Cited by 11
Wu, X., Chen, Z., Zhao, Y., & Ren, H. (2024) · Scientific Reports · doi:10.1038/s41598-024-82751-7 · Cited by 12
Bai, H., Liu, Y., Zhang, L., Song, L., Pan, Y., Long, Z., & Liao, L. (2025) · Diabetology & Metabolic Syndrome · doi:10.1186/s13098-025-01998-w · Cited by 11
Juby, A. G., Davis, C. M. J., Minimaana, S., & Mager, D. R. (2023) · Canadian Geriatrics Journal · doi:10.5770/cgj.26.626 · Cited by 10
Lin, T., Liang, R., Song, Q., Liao, H., Dai, M., Jiang, T., Tu, X., Shu, X., Huang, X., Ge, N., et al. (2024) · Journal of the American Medical Directors Association · doi:10.1016/j.jamda.2024.105128 · Cited by 11
Pérez-Lasierra, J. L., Azpíroz-Puente, M., Alfaro-Santafé, J.-V., Almenar-Arasanz, A. J., Alfaro-Santafé, J., & Gómez-Bernal, A. (2024) · BMC Geriatrics · doi:10.1186/s12877-024-05475-3 · Cited by 12
Bao, Z., Cui, C., Liu, C., Long, Y., Wong, R. M. Y., Chai, S., Qin, L., Rubin, C. T., Yip, B. H. K., Xu, Z., et al. (2024) · Aging Cell · doi:10.1111/acel.14156 · Cited by 10
Self-citationSarcopenia and sarcopenic obesity among older adults in the nordic countries: a scoping review
Baygi, F., Buhl, S. F., Thilsing, T., Søndergaard, J., & Nielsen, J. B. (2024) · BMC Geriatrics · doi:10.1186/s12877-024-04970-x · Cited by 10
Stuursma, A., Stroot, I. A. S., Vermeulen, K. M., Slart, R. H. J. A., Greuter, M. J. W., Mourits, M. J. E., & de Bock, G. H. (2024) · Insights into Imaging · doi:10.1186/s13244-024-01677-w · Cited by 9
Yang, C., Ye, T. T., & Gao, Y. (2025) · PLoS ONE · doi:10.1371/journal.pone.0326193 · Cited by 10
Wang, K., Peng, L., You, M., Shen, B., & Li, J. (2025) · Journal of Orthopaedic Surgery and Research · doi:10.1186/s13018-025-06124-0 · Cited by 9
Prognostic nutritional index, sarcopenia, and risk of mortality: a national population-based study
Wu, Q., Ding, W., You, D., Ji, Y. T., Wang, S., Jiang, D., Huang, L., Wu, X., Li, L., Xu, J., et al. (2025) · Nutrition & Metabolism · doi:10.1186/s12986-025-01005-z · Cited by 9
Analysis of the current status of CT diagnosis of sarcopenia
xia, W., & He, Q. (2024) · Archives of Medical Science · doi:10.5114/aoms/191297 · Cited by 9
Biomarkers and Clinical Evaluation in the Detection of Frailty
Devitt, C., Patel, D., Mahboubi-Ardakani, R., Poovathor, S., Jin, Z., & Moller, D. H. (2025) · International Journal of Molecular Sciences · doi:10.3390/ijms26167888 · Cited by 8
Wang, Q., Chen, P., Guo, J.-Y., Wang, S.-J., Bao, Y.-Y., Zhang, Y., & Yu, K. (2024) · Frontiers in Nutrition · doi:10.3389/fnut.2024.1378853 · Cited by 7
Nazareth, C. C. G., Scalli, A. C. A. M., de Oliveira, M. P. B., Souza-Gomes, A. F., Brito‐Costa, S., Furtado, G. E., & Cezar, N. O. D. C. (2024) · Journal of Alzheimer s Disease · doi:10.1177/13872877241299051 · Cited by 7
Shida, T., Hatanaka, S., Ohta, T., Osuka, Y., Kojima, N., Motokawa, K., Iwasaki, M., Miyamae, F., Okamura, T., Hirano, H., et al. (2024) · Nutrition · doi:10.1016/j.nut.2024.112453 · Cited by 7
Automated Fast Prediction of Bone Mineral Density From Low-dose Computed Tomography
Zhou, K., Xin, E., Yang, S., Luo, X., Zhu, Y., Zeng, Y., Fu, J., Ruan, Z., Wang, R., Geng, D., et al. (2025) · Academic Radiology · doi:10.1016/j.acra.2025.02.041 · Cited by 7
Okubo, S., Shinmura, K., Kadota, S., Nakayasu, M., Kurosawa, S., Nakayama, H., Sakurai, A., Ito, C., Aisa, Y., & Nakazato, T. (2023) · Annals of Hematology · doi:10.1007/s00277-023-05548-0 · Cited by 7
Xue, J., Liu, W., Ling, X., Li, J., Ji, J., Wang, B., & Zhao, M. (2024) · Heliyon · doi:10.1016/j.heliyon.2024.e35888 · Cited by 6
Lee, D. Y., Oh, J. S., Kim, J. W., Kim, J. S., Oh, M., Kim, Y. I., Ko, D. H., Bae, S., Kim, H., & Ryu, J. (2024) · Scientific Reports · doi:10.1038/s41598-024-71878-2 · Cited by 6
Lan, Y., Ke, Y., Sun, D., Pei, P., Yang, L., Chen, Y., Du, H., Lv, J., Barnard, M., Chen, J., et al. (2024) · Journal of Cachexia Sarcopenia and Muscle · doi:10.1002/jcsm.13650 · Cited by 6
Evaluating the weight-adjusted waist index as a predictive tool for sarcopenia and mortality risk
Shen, Q., Zhou, T., Chen, X., Umar, H. M., Yang, X., & Shen, X. (2025) · Eating and Weight Disorders - Studies on Anorexia Bulimia and Obesity · doi:10.1007/s40519-024-01712-1 · Cited by 6
Sun, C., Yang, X., & Feng, X. (2025) · Acta Diabetologica · doi:10.1007/s00592-025-02527-x · Cited by 6
Moriyama, T., Tokunaga, M., Hori, R., Hachisuka, A., Itoh, H., Ochi, M., Matsushima, Y., & Saeki, S. (2024) · Annals of Geriatric Medicine and Research · doi:10.4235/agmr.24.0096 · Cited by 5
Gariballa, S., Al‐Bluwi, G. S. M., & Yasin, J. (2024) · Nutrients · doi:10.3390/nu16234044 · Cited by 7
Wang, Y. X., Xu, Q., Lu, S., Wu, X., Xu, S., Zhang, T., Yao, Z., Yu, J., Jia, X., Liu, Z., et al. (2025) · American Journal of Clinical Nutrition · doi:10.1016/j.ajcnut.2025.09.006 · Cited by 7
Modern methods of sarcopenia diagnostics
Фомина, Н. В., & Владимировна, У. Е. (2022) · Siberian medical review · doi:10.20333/25000136-2022-5-12-23 · Cited by 4
Cachexia: Unraveling its Complex Pathophysiology and Novel Therapeutic Approaches
Dudhat, K. R., Vanpariya, M., & Sah, R. K. (2025) · Current Aging Science · doi:10.2174/0118746098355767250325074021 · Cited by 4
Soliman, S. B., Chugh, O. K., Leuteneker, J. E., Tuska, B., Ye, W., Zhang, T., Rode, T., Howton, S. M., Buras, E. D., & Horowitz, J. F. (2025) · Journal of Ultrasound in Medicine · doi:10.1002/jum.16741 · Cited by 4
Utsunomiya, D., Kubo, Y., Horonushi, S., Nozaki, R., Igaue, S., Kakuta, R., Akimoto, E., Kubo, K., Kurita, D., Ishiyama, K., et al. (2025) · Esophagus · doi:10.1007/s10388-025-01145-4 · Cited by 4
Yu, R., Lai, D., Leung, G., Tam, L.-Y., Cheng, C., Kong, S., Tong, C., Lu, Z., Leung, J. C. S., Chan, A., et al. (2023) · Clinical Interventions in Aging · doi:10.2147/cia.s431218 · Cited by 4
Self-citationFu, C., Zhu, Z., Mao, Y., & Wei, W. (2025) · Frontiers in Nutrition · doi:10.3389/fnut.2025.1562897 · Cited by 3
Wang, X., Yang, D., Li, J., Jin, L., Shuhua, X., & Jin, F. (2025) · Frontiers in Endocrinology · doi:10.3389/fendo.2025.1628612 · Cited by 3
Tu, X., Lin, T., Huang, L., Jiang, T., Zheng, Q., & Yue, J. (2025) · BMC Geriatrics · doi:10.1186/s12877-025-06346-1 · Cited by 3
Cost-effectiveness of opportunistic CT versus clinical methods for sarcopenia screening
Padwal, J. A., Hanly, A., Johnston, A., Lenchik, L., Gyftopoulos, S., & Boutin, R. D. (2025) · Skeletal Radiology · doi:10.1007/s00256-025-05084-0 · Cited by 3
Sarcopenia in older adults: A narrative review of current concepts in diagnosis and treatment
Güngör, M., & Balcı, C. (2026) · Clinical Nutrition ESPEN · doi:10.1016/j.clnesp.2026.103276 · Cited by 3
Felipe, T. L., Grili, P. P. D. F., Vidigal, C. V., Albergaria, B., da Cruz, G. F., Marques-Rocha, J. L., & Guandalini, V. R. (2024) · Revista Brasileira Ginecologia e Obstetrícia · doi:10.61622/rbgo/2024ao09 · Cited by 3
Laohajaroensombat, O., Limpaarayakul, T., Sathavarodom, N., Boonyavarakul, A., & Samakkarnthai, P. (2025) · BMC Geriatrics · doi:10.1186/s12877-025-06020-6 · Cited by 3
Tamura, Y., Saeki, C., Kanai, T., Kiryu, S., Nakano, M., Oikawa, T., Torisu, Y., Saruta, M., & Tsubota, A. (2024) · Journal of Gastroenterology and Hepatology · doi:10.1111/jgh.16806 · Cited by 3
Profile and risk stratification for sarcopenia in postmenopausal women
Steiner, M. L., de Campos, L. G. L., Sonnenfeld, M. M., Silva, T. G. B. E., da Silva, M. H., Strufaldi, R., Fernandes, C. E., & Pompei, L. D. M. (2025) · Climacteric · doi:10.1080/13697137.2025.2495310 · Cited by 2
Wong, R. M. Y., Wong, P. Y., Liu, C., Tang, N., Wan, R. C. W., Liu, W. H., Cui, C., Zhang, N., Kwok, T. C. Y., Law, S. W., et al. (2025) · Trials · doi:10.1186/s13063-025-08976-7 · Cited by 2
Self-citationNinomiya, T., Konishi, H., Ueda, E., Sakata, S., Oishi, E., Furuta, Y., Ohmae, S., Hoshiko, H., Tateishi, N., Shibata, M., et al. (2025) · Journal of Diabetes and its Complications · doi:10.1016/j.jdiacomp.2025.109199 · Cited by 3
He, H., Cheng, Q., Zhang, Z., Hu, Y., Lu, Z., Han, W., Tu, J., Li, A., Song, Z. G., Liu, Y., et al. (2025) · Journal of Cachexia Sarcopenia and Muscle · doi:10.1002/jcsm.70135 · Cited by 2
Soliman, S. B., Leuteneker, J. E., Chugh, O. K., Zhang, T., Tuska, B., Rode, T., Sanchez, M. J., Buras, E. D., & Horowitz, J. F. (2025) · Journal of Ultrasound in Medicine · doi:10.1002/jum.70126 · Cited by 2
Determination of Ultrasound Reference Values for Diagnosing Low Muscle Mass in Older Chinese Adults
Li, S., Xu, K., Wang, A., Qin, C., Hua, N., Ling, X., Xu, L., He, C., Zhou, S., Chen, J., et al. (2025) · Journal of Cachexia Sarcopenia and Muscle · doi:10.1002/jcsm.70155 · Cited by 2
Development and validation of a sarcopenia risk prediction model for community-dwelling older adults
Hou, Z., Liu, T., Hua, L., Wang, R., Lv, H., & Sun, Q. (2025) · BMC Public Health · doi:10.1186/s12889-025-25901-4 · Cited by 2
Danielewicz, A. L., de Assis, G. F., Cândido, L. M., Mendonça, V. A., Lacerda, A. C. R., Tringali, G., Micheli, R. D., Bondesan, A., de Avelar, N. C. P., & Sartório, A. (2026) · Frontiers in Endocrinology · doi:10.3389/fendo.2025.1727488 · Cited by 2
Prokopidis, K. (2026) · JCSM Communications · doi:10.1002/rco2.70028 · Cited by 2
Ma, X., Tian, M., Liu, J., Tong, L., & Ding, W. (2024) · Bone · doi:10.1016/j.bone.2024.117170 · Cited by 2
Zhang, C., Wang, D., Wu, X., Zhang, Q., Chen, L., Lang, J., & Wu, C. (2025) · BMC Musculoskeletal Disorders · doi:10.1186/s12891-025-08931-2 · Cited by 2
Features of sarcopenic obesity in rheumatoid arthritis patients
Saito, Y., Suzuki, M., Kojima, T., Yamamoto, H., Saito, Y., Terabe, K., Ohashi, Y., Sato, R., Hasegawa, J., Ohno, Y., et al. (2025) · Geriatrics and gerontology international/Geriatrics & gerontology international · doi:10.1111/ggi.70149 · Cited by 2
Kim, H. (2024) · Journal of Cachexia Sarcopenia and Muscle · doi:10.1002/jcsm.13587 · Cited by 2
Kristensen, T., Kamper, R. S., Haddock, B., Nygaard, H. H., Nørst, T., Hovind, P. H., & Suetta, C. (2025) · medRxiv · doi:10.1101/2025.02.03.25321573 · Cited by 2
Sarcopenia and Pleural Effusions: Exploring a Potential Link
Barkas, G. I., Karakousis, N. D., Daniil, Z., Gourgoulianis, K. I., & Kotsiou, O. S. (2024) · Muscles · doi:10.3390/muscles3030017 · Cited by 1
Xiang, Y., Shen, L., Xue, Y., Wang, Z., Zhou, R., Cao, Y. Z., Zhu, Z., Xu, P., Yu, X., Fang, P., et al. (2024) · Diabetes Obesity and Metabolism · doi:10.1111/dom.15881 · Cited by 1
Identification of Osteosarcopenia by High-Resolution Peripheral Quantitative Computed Tomography
Cheng, K. Y., Chow, S. K., Hung, V. W.-Y., Tsang, Z. T.-L., Yip, B. H. K., Wong, R. M. Y., Zhang, N., Qin, L., Law, S. W., & Cheung, W. (2024) · Journal of Personalized Medicine · doi:10.3390/jpm14090935 · Cited by 1
Self-citationMoriyama, T., Tokunaga, M., Hori, R., Hachisuka, A., Itoh, H., Ochi, M., Matsushima, Y., & Saeki, S. (2025) · Dysphagia · doi:10.1007/s00455-025-10806-6 · Cited by 1
Potential of bioimpedance analysis for diagnostics of osteosarcopenic obesity components
Цыганкова, Д. П., Евгеньевна, К. К., Bazdyrev, E. D., Kareeva, A. I., Artamonova, G. V., & Барбараш, О. Л. (2025) · Сибирский журнал клинической и экспериментальной медицины · doi:10.29001/2073-8552-2025-40-1-42-50 · Cited by 1
Fat mass in postmenopausal women with osteoporosis is associated with cognitive function
Zhang, D., Zhu, Z., Xue, L., Zheng, Y., Li, X., Xu, M., Xie, X., & Wang, Y. (2025) · Scientific Reports · doi:10.1038/s41598-025-03523-5 · Cited by 1
Moon, Y., Dong, Z., Lee, S. K., Yun, H., Song, J., Shin, M. J., Im, D., Xu, J., & Wang, X. (2025) · Scientific Reports · doi:10.1038/s41598-025-08304-8 · Cited by 1
Yao, R., Gao, B., Hu, J., Zhao, W., Tian, Y., Yao, L., & Jiang, Y. (2025) · Journal of Yeungnam Medical Science · doi:10.12701/jyms.2025.42.49 · Cited by 1
Yang, L., Wu, H., Chen, J., Wang, W., Zhang, Z., Feng, J., Qiu, W., Dong, F., Lin, N., & Yuan, F. (2025) · Photoacoustics · doi:10.1016/j.pacs.2025.100771 · Cited by 2
Metadata
- Authors
- Cheng, K. Y., Chow, S. K., Hung, V. W., Wong, C. H., Wong, R. M., Tsang, C. S., Kwok, T., & Cheung, W.
- Affiliations
- Chinese University of Hong Kong (HK)
- Corresponding author
- Chow, Simon Kwoon‐Ho
- ORCID
- Venue
- Journal of Cachexia Sarcopenia and Muscle
- Publisher
- Wiley
- Published
- 2021-10-04
- Volume
- 12
- Issue
- 6
- Pages
- 2163-2173
- ISSN
- 2190-5991 (ISSN-L)
- 2190-6009
- PMC
- PMC8718029
- OpenAlex
- W3202032823
- Cited by
- 154
- References
- 31
- Citations by year
- 2026: 28 · 2025: 50 · 2024: 49 · 2023: 15 · 2022: 11 · 2021: 1
- FWCI
- 11.94
- Type
- journal article
- Language
- en
- Open access
- gold
- doi.org
- Licence
- Locations
- Journal of Cachexia Sarcopenia and Muscle (publishedVersion, cc-by-nc-nd)
- PubMed Central (publishedVersion, cc-by-nc-nd)
- PubMed (publishedVersion)
- DOAJ (DOAJ: Directory of Open Access Journals) (submittedVersion, cc-by-sa)
- Funders
- Chinese University of Hong Kong (4054479)
- Health and Medical Research Fund (HCPS 02180118)
- Topics
- Health Sciences › Medicine › Physiology (medical) › Nutrition and Health in Aging
- Health Sciences › Medicine › Physiology (medical) › Body Composition Measurement Techniques
- Health Sciences › Medicine › Geriatrics and Gerontology › Frailty in Older Adults
- Keywords
- sarcopenia, skeletal muscle mass, bioelectrical impedance analysis, dual-energy X-ray absorptiometry, appendicular skeletal muscle mass index, cross-validation, prediction equations, sarcopenia screening, older adults, grip strength, walking speed, sarcopenia prevalence, Hong Kong, Asian Working Group for Sarcopenia criteria, measurement overestimation, community-dwelling
- MeSH terms
- Aged, Aged, 80 and over, Body Composition, Humans, Middle Aged, Absorptiometry, Photon, Electric Impedance, Muscle, Skeletal, Hand Strength, Sarcopenia
About these checks
Registry, retraction, Cites and statistics results are computed, not judged, with one exception: a printed reference that no index lists is read once by a model before it counts as a citation error. Claims are extracted by a model and kept only when their quote appears verbatim in the text; each cited source is then checked, with a model’s help, for whether it says what the claim relies on. Those verdicts can be wrong — read the claim’s quote and the cited source before relying on one.
Statistics and arithmetic are recomputed, not judged.
Confidence bands are shown only for fields calibrated on our annotated test set. None is calibrated yet, so no band is shown.
What counts as a claim ›How we measure confidence ›How we check this ›
Are you an author, or do you see a problem with this page? Request a review
