

The DOI matches its Crossref record; 3 of the 3 references it cites were found in a registry or an index.
An ecological theory of changing human population dynamics
Abstract
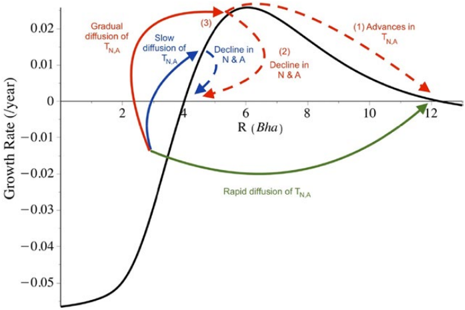
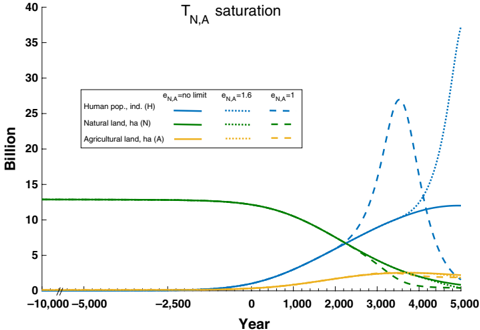
The dependence of humans on nature has come into focus as the human population continues to grow, resources diminish and production technology stagnates – threatening human well‐being on a global scale. Numerous previous models describe human population dynamics, in relation to a multitude of different factors. However, there are no consistent driving factors of human demography through history, which makes predicting future changes more challenging. Here, we review the literature on human population growth from empirical data and previous models, which allows us to highlight key trends in demography and land cover changes. We then establish an ecologically driven theory of demographic change that uses resource accessibility as a proxy for socio‐economic factors. The theory combines multiple concepts to represent 12 millennia of past population dynamics through simple human–nature relationships. Furthermore, the model allows us to compare different scenarios related to technological progress and land cover change, for which we find that the peak human population is highly dependent on whether technological developments continue at an exponential growth rate, or if and when there is a saturation point. Likewise, agriculture is shown to be helpful for growing the population, but nature is ultimately needed to maintain the human population. A plain language summary is available for this article.
Overview
The claims and statistics of this paper haven’t been checked yet.
Run the check — free, no account needed. It reads the open-access text and checks the sources it cites.
Integrity signals
Registry
Cites
Statistics
Figures
Verification
Claims the paper makes
The claims and statistics of this paper haven’t been checked yet.
Run the check — free, no account needed. It reads the open-access text and checks the sources it cites.
Claims other papers make about this one
Each is checked against this paper’s own text: does it say what the citing paper says it does?
The cited source says what the claim attributes to it.
In the citing paper
“Modern demographic changes put increasing pressure on the ecosystem (Henderson and Loreau 2019; Nguyen and Liou 2019).”
From From landscape affordances to landscape connectivity: contextualizing an archaeology of human ecology (2020) · cites this paper as Henderson and Loreau 2019
Self-check
Percentages, sums and reported differences re-computed from the paper’s own numbers.
The self-check needs the paper’s full text.
Citations
Cites
The rise and fall of the Environmental Kuznets Curve
Stern, D. I. (2004) · World Development · doi:10.1016/j.worlddev.2004.03.004 · Cited by 4,013
Hunter-gatherers and human evolution.
Marlowe, F. W. (2005) · Evolutionary Anthropology: Issues, News, and Reviews · doi:10.1002/evan.20046 · Cited by 944
Rapid, global demographic expansions after the origins of agriculture
Gignoux, C. R., Henn, B. M., & Mountain, J. L. (2011) · Proceedings of the National Academy of Sciences · doi:10.1073/pnas.0914274108 · Cited by 267
Research works printed but not linked: 68
- 10.1017/S1355770X0300123 · DOI
- 10.1007/BF01256568 · DOI
- Biraben J.‐N., 2003, L’évolution du nombre des hommes, Population et Sociétés, 394, 1, 10.3917/popsoc.394.0001 · DOI
- 10.1086/342429 · DOI
- 10.1086/605552 · DOI
- 10.1126/science.1208880 · DOI
- Boserup E., 1965, The conditions of agricultural growth
- Brander J. A., 1998, The simple economics of Easter Island: A Ricardo‐Malthus model of renewable resource use, American Economic Review, 119
- Cohen J. E., 1995, How many people can the earth support? The Sciences, 18
- 10.1098/rstb.2015.0242 · DOI
- 10.1016/j.ecolecon.2006.07.008 · DOI
- 10.1038/nature12774 · DOI
- 10.1073/pnas.1602504113 · DOI
- 10.1016/S1095-6433(03)00208-3 · DOI
- 10.2307/2137633 · DOI
- Ehrlich P. R., 1990, The population explosion
- 10.1126/science.1078710 · DOI · Paper page
- Food and Agriculture Organization of the United Nations, 2017, FAOSTAT statistics database
- 10.1257/aer.90.4.806 · DOI · Paper page
- Graunt J., 1662, Natural and political observations made upon the bills of mortality
- Güneş P. M., 2016, The impact of female education on teenage fertility: Evidence from Turkey, The BE Journal of Economic Analysis & Policy, 16, 259, 10.1515/bejeap-2015-0059 · DOI
- 10.1073/pnas.1610005113 · DOI
- 10.4135/9781848608115.n23 · DOI
- Jejeebhoy S. J., 1995, Women’s education, autonomy, and reproductive behaviour: Experience from developing countries, 10.1093/oso/9780198290339.001.0001 · DOI · Paper page
- 10.1016/S0928-7655(01)00046-X · DOI
- 10.1002/(SICI)1096-8644(1996)23 <91::AID-AJPA4>3.0.CO;2-C · DOI
- 10.1098/rspb.2010.0452 · DOI
- 10.1080/10042857.2016.1149296 · DOI
- 10.1007/978-3-662-05642-4_16 · DOI
- 10.1098/rspb.2017.1192 · DOI
- 10.1016/j.ecolmodel.2017.02.022 · DOI
- 10.1177/0959683614540952 · DOI
- 10.1016/j.tpb.2008.03.001 · DOI
- 10.1111/1759-3441.12013 · DOI
- Lutz W., 2013, World population & human capital in the twenty‐first century: An overview
- Malthus T. R., 1888, An essay on the principle of population: A view of its past and present effects on human happiness
- 10.1016/0040-1625(96)00001-7 · DOI
- 10.1038/272491a0 · DOI
- 10.1146/annurev.es.23.110192.000351 · DOI
- 10.1038/457660a · DOI
- 10.1016/j.ecolecon.2014.02.014 · DOI
- Motesharrei S., 2016, Modeling sustainability: Population, inequality, consumption, and bidirectional coupling of the earth and human systems, National Science Review, 3, 470
- 10.1016/S0169-5347(98)01357-3 · DOI
- 10.1088/1748-9326/aa7581 · DOI
- 10.1093/past/141.1.38 · DOI
- 10.1126/science.1170165 · DOI
- Preston S. H., 1980, Population and economic change in developing countries, 289
- Preston S. H., 1996, Human mortality throughout history and prehistory
- 10.1146/annurev-resource-110811-114537 · DOI
- 10.1177/0022002701045006002 · DOI
- 10.1111/1467-6435.00116 · DOI
- Roser M., 2017, World population growth
- Roser M., 2017, Food per person
- 10.1016/j.gloenvcha.2014.06.004 · DOI · Paper page
- 10.1146/annurev.an.10.100181.001003 · DOI
- Shennan S., 2013, Regional population collapse followed initial agriculture booms in mid‐Holocene Europe. Nature, Communications, 4
- 10.4054/DemRes.2008.18.5 · DOI
- 10.1126/science.1260504 · DOI
- 10.1038/22672 · DOI
- 10.1177/0959683611414937 · DOI
- 10.1016/j.enpol.2008.08.025 · DOI
- The World Bank Group, 2017, Databank
- 10.1111/j.1749-6632.2009.04447.x · DOI
- 10.1073/pnas.1520288113 · DOI
- 10.1126/science.289.5477.284 · DOI
- 10.1017/S0890037X00044663 · DOI
- 10.1002/2014EF000275 · DOI
- 10.1016/j.jas.2012.10.025 · DOI
Cited by
Sorted by citations
The Evolution of Agricultural Drainage from the Earliest Times to the Present
Valipour, M., Krasilnikof, J., Yannopoulos, S., Kumar, R., Deng, J., Roccaro, P., Mays, L., Grismer, M. E., & Angelakis, A. N. (2020) · Sustainability · doi:10.3390/su12010416 · Cited by 73
Kempf, M. (2020) · Archaeological and Anthropological Sciences · doi:10.1007/s12520-020-01157-4 · Cited by 30
Metadata
- Authors
- Henderson, K., & Loreau, M.
- Venue
- People and Nature
- Publisher
- Wiley
- Published
- 2019-02-21
- Volume
- 1
- Issue
- 1
- Pages
- 31-43
- ISSN
- 2575-8314
- Cited by
- 36
- References
- 3
- Language
- en
- Funders
- H2020 European Research Council
About these checks
Registry, retraction, Cites and statistics results are computed, not judged, with one exception: a printed reference that no index lists is read once by a model before it counts as a citation error. Claims are extracted by a model and kept only when their quote appears verbatim in the text; each cited source is then checked, with a model’s help, for whether it says what the claim relies on. Those verdicts can be wrong — read the claim’s quote and the cited source before relying on one.
Statistics and arithmetic are recomputed, not judged.
Confidence bands are shown only for fields calibrated on our annotated test set. None is calibrated yet, so no band is shown.
What counts as a claim ›How we measure confidence ›How we check this ›
Are you an author, or do you see a problem with this page? Request a review
