CoChat

A disease causing ATLASTIN 3 mutation affects multiple endoplasmic reticulum-related pathways

Open access
Behrendt, Laura, Kurth, Ingo, Kaether, Christoph · 2019 · Cellular and Molecular Life Sciences

The DOI matches its Crossref record; 57 of the 57 references it cites were found in a registry or an index.

Abstract

Atlastins (ATLs) are membrane-bound GTPases involved in shaping of the endoplasmic reticulum (ER). Mutations in ATL1 and ATL3 cause spastic paraplegia and hereditary sensory neuropathy. We here show that the sensory neuropathy causing ATL3 Y192C mutation reduces the complexity of the tubular ER-network. ATL3 Y192C delays ER-export by reducing the number of ER exit sites, reduces autophagy, fragments the Golgi and causes malformation of the nucleus. In cultured primary neurons, ATL3 Y192C does not localize to the growing axon, resulting in axon growth deficits. Patient-derived fibroblasts possess a tubular ER with reduced complexity and have a reduced number of autophagosomes. The data suggest that the disease-causing ATL3 Y192C mutation affects multiple ER-related pathways, possibly as a consequence of the distorted ER morphology.

Overview

The claims and statistics of this paper haven’t been checked yet.

Free: it reads the open-access text and checks the first 5 claims that cite a source we can check. Create a free account to check every claim.

A few free checks a day · papers already verified open instantly · results are public

Integrity signals

Registry

Crossref · 10.1007/s00018-019-03010-x

Cites

57 of 57 references verified0 citation errors · 0 not checkable

Statistics

Figures

Fig. 1 ATL3 Y192C induced ER-morphology changes and malformation of the nucleus. a HeLa cells were transfected with a control vector, ATL3-myc or ATL3 Y192C-myc, fixed and stained with antibodies against calnexin and myc. Arrows indicate punctate ATL3 localization, arrowheads ATL3 Y192C mislocalization at distorted ER. b, d HeLa cells transfected as indicated were lysed and processed for immunoblotting with anti-ATL3 antibodies. The arrows indicate endogenous ATL3. Equal loading was validated by stain-free gel-imaging (see Fig. S6, also for full-size blots). c HeLa cells were transfected with pplss-KDEL-mRFP (RFP-KDEL) as ER marker and GFP-ATL3 or GFP-ATL3 Y192C and analyzed by live cell imaging. Lower panel, magnifications of the boxed areas. e HeLa cells were transfected with a control vector, ATL3-myc or ATL3 Y192C-myc, fixed and stained with antibodies against myc and lamin A. Arrows point to distorted nuclei. a, c, e Single Apotome sections of representative images from n = 3 independent experiments. Nuclei in a, c were stained with Hoechst 33342, scale bar 10 μm
Fig. 1 ATL3 Y192C induced ER-morphology changes and malformation of the nucleus. a HeLa cells were transfected with a control vector, ATL3-myc or ATL3 Y192C-myc, fixed and stained with antibodies against calnexin and myc. Arrows indicate punctate ATL3 localization, arrowheads ATL3 Y192C mislocalization at distorted ER. b, d HeLa cells transfected as indicated were lysed and processed for immunoblotting with anti-ATL3 antibodies. The arrows indicate endogenous ATL3. Equal loading was validated by stain-free gel-imaging (see Fig. S6, also for full-size blots). c HeLa cells were transfected with pplss-KDEL-mRFP (RFP-KDEL) as ER marker and GFP-ATL3 or GFP-ATL3 Y192C and analyzed by live cell imaging. Lower panel, magnifications of the boxed areas. e HeLa cells were transfected with a control vector, ATL3-myc or ATL3 Y192C-myc, fixed and stained with antibodies against myc and lamin A. Arrows point to distorted nuclei. a, c, e Single Apotome sections of representative images from n = 3 independent experiments. Nuclei in a, c were stained with Hoechst 33342, scale bar 10 μmCC BY · PubMed Central
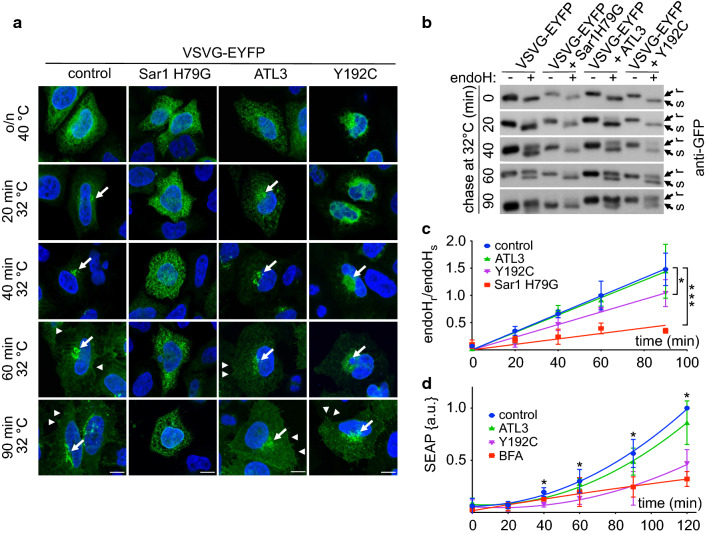
Fig. 2 ATL3 Y192C delayed ER to Golgi transport. HeLa cells were transfected with VSVG-EYFP and a control vector, Sar1 H79G, ATL3-myc or ATL3 Y192C-myc, incubated overnight at 40 °C and chased at 32 °C for indicated times, followed by fixation (a) or cell lysis (b). a Fixed cells were stained with an antibody against myc to identify transfected cells. Nuclei were stained with Hoechst 33342. Images represent single Apotome sections. Arrows indicate Golgi localization of VSVG-EYFP, arrowheads VSVG-EYFP localization at the plasma membrane. For clarity only EYFP staining is shown. Scale bar, 10 μm, n = 3 independent experiments. b Lysates were digested with or without endoH, separated using SDS-PAGE, blotted and probed with an antibody against GFP. Stain-free gel imaging was used as loading control (Fig. S6, see also for full-size blots). c Quantification of the ratio of the upper, endoH resistant and the lower, endoH sensitive band. Signals were quantified using ImageJ. Data points were fitted using GraphPad Prism’s linear regression function. Data are displayed as mean ± SD, *p < 0.05 (one-way ANOVA followed by Tukey’s multiple comparisons test, slopes of each linear regression function were compared). n = 3 independent experiments. d HeLa cells stably expressing SEAP were transfected with a control vector or ATL3-myc or ATL3 Y192C-myc or treated with BFA (0.1 μg/ml). After the indicated times, SEAP activity was determined, data normalized against the obtained maximum and minimum value and fitted using GraphPad Prism’s polynomial second order function. Data are displayed as mean ± SD, *p < 0.05, ***p < 0.001, Welch’s t test, n = 4 independent experiments
Fig. 2 ATL3 Y192C delayed ER to Golgi transport. HeLa cells were transfected with VSVG-EYFP and a control vector, Sar1 H79G, ATL3-myc or ATL3 Y192C-myc, incubated overnight at 40 °C and chased at 32 °C for indicated times, followed by fixation (a) or cell lysis (b). a Fixed cells were stained with an antibody against myc to identify transfected cells. Nuclei were stained with Hoechst 33342. Images represent single Apotome sections. Arrows indicate Golgi localization of VSVG-EYFP, arrowheads VSVG-EYFP localization at the plasma membrane. For clarity only EYFP staining is shown. Scale bar, 10 μm, n = 3 independent experiments. b Lysates were digested with or without endoH, separated using SDS-PAGE, blotted and probed with an antibody against GFP. Stain-free gel imaging was used as loading control (Fig. S6, see also for full-size blots). c Quantification of the ratio of the upper, endoH resistant and the lower, endoH sensitive band. Signals were quantified using ImageJ. Data points were fitted using GraphPad Prism’s linear regression function. Data are displayed as mean ± SD, *p < 0.05 (one-way ANOVA followed by Tukey’s multiple comparisons test, slopes of each linear regression function were compared). n = 3 independent experiments. d HeLa cells stably expressing SEAP were transfected with a control vector or ATL3-myc or ATL3 Y192C-myc or treated with BFA (0.1 μg/ml). After the indicated times, SEAP activity was determined, data normalized against the obtained maximum and minimum value and fitted using GraphPad Prism’s polynomial second order function. Data are displayed as mean ± SD, *p < 0.05, ***p < 0.001, Welch’s t test, n = 4 independent experimentsCC BY · PubMed Central
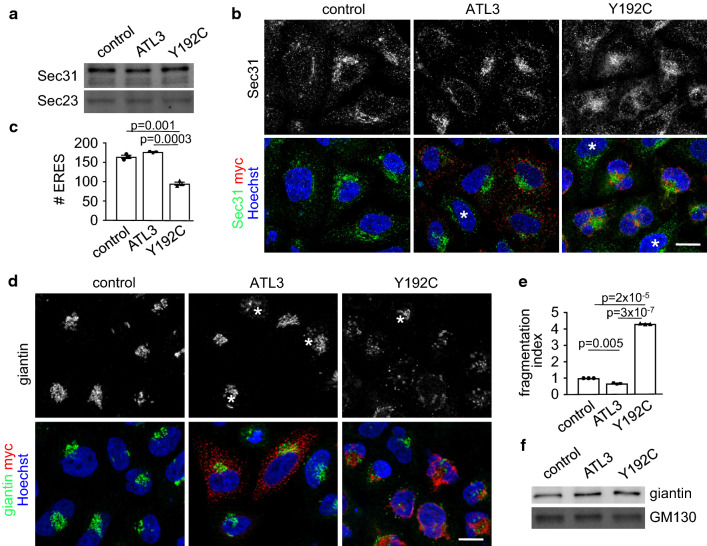
Fig. 3 ATL3 Y192C reduced the number of ERES and fragmented the Golgi. HeLa cells were transfected with a control vector or ATL3-myc or ATL3 Y192C-myc, incubated for 24 h, lysed (a, f) or fixed and processed for immunofluorescence with indicated antibodies and Hoechst 33342 to label nuclei (b, d). a Lysates were blotted and probed with antibodies against Sec31 and Sec23. n = 3 independent experiments. b Single Apotome sections of transfected HeLa cells as indicated. Representative images of 3 independent experiments are shown, scale bar, 10 μm. c Quantification of b. Sec31 labeled ERES were counted using ImageJ, for example images see Fig. S4. Analyzed were 66–120 cells per condition from n = 3 independent experiments. d Transfected cells were stained with antibodies against giantin and myc. b, d Asterisks indicate untransfected cells, scale bar 10 μm. e Quantification of d. Golgi fragments were counted using ImageJ and the fragmentation index calculated. Analyzed were 115 cells per condition from three independent experiments. f Lysates were blotted and probed with antibodies against giantin and GM130. n = 3 independent experiments. a, f For full size blots and stain-free gel imaging as loading control see Fig. S6. c, e Values represent mean ± SEM, p values are indicated (Welch’s t test)
Fig. 3 ATL3 Y192C reduced the number of ERES and fragmented the Golgi. HeLa cells were transfected with a control vector or ATL3-myc or ATL3 Y192C-myc, incubated for 24 h, lysed (a, f) or fixed and processed for immunofluorescence with indicated antibodies and Hoechst 33342 to label nuclei (b, d). a Lysates were blotted and probed with antibodies against Sec31 and Sec23. n = 3 independent experiments. b Single Apotome sections of transfected HeLa cells as indicated. Representative images of 3 independent experiments are shown, scale bar, 10 μm. c Quantification of b. Sec31 labeled ERES were counted using ImageJ, for example images see Fig. S4. Analyzed were 66–120 cells per condition from n = 3 independent experiments. d Transfected cells were stained with antibodies against giantin and myc. b, d Asterisks indicate untransfected cells, scale bar 10 μm. e Quantification of d. Golgi fragments were counted using ImageJ and the fragmentation index calculated. Analyzed were 115 cells per condition from three independent experiments. f Lysates were blotted and probed with antibodies against giantin and GM130. n = 3 independent experiments. a, f For full size blots and stain-free gel imaging as loading control see Fig. S6. c, e Values represent mean ± SEM, p values are indicated (Welch’s t test)CC BY · PubMed Central
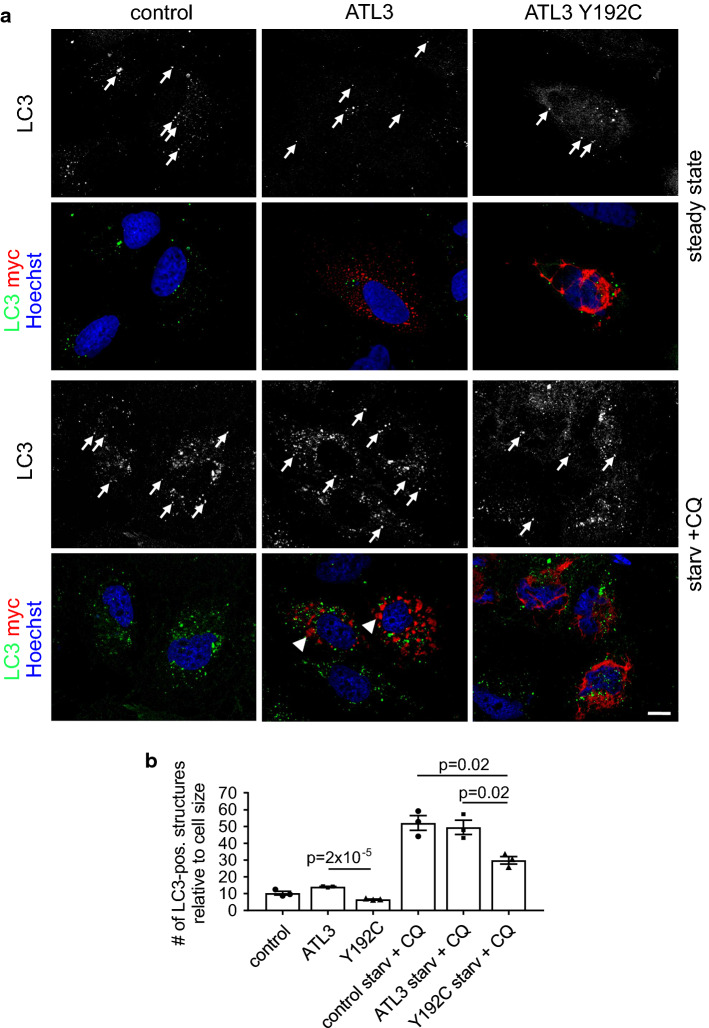
Fig. 4 ATL3 Y192C affects autophagosome formation. HuH7 cells transfected with empty vector (control), ATL3-myc or ATL3 Y192C-myc were incubated for 24 h, treated without (steady state) or with starvation medium plus 50 μM chloroquine (starv. + CQ) for 3 h, fixed and processed for immunofluorescence staining with antibodies against LC3 and myc and with Hoechst 33342 to label nuclei. a Single Apotome sections of representative cells from n = 3 independent experiments. Arrows, LC3-positive vesicles. Scale bar 10 μm. Note that the starvation medium causes ER morphology changes, indicated by the relocalization of ATL3 to larger aggregates (arrowheads). b Quantification of cells from a. Displayed is the average number of LC3-positive vesicles per cell normalized to the cell size. Error bars depict SEM. Analyzed were 26–30 cells for each condition from three independent experiments, p values are indicated (Welch’s t test)
Fig. 4 ATL3 Y192C affects autophagosome formation. HuH7 cells transfected with empty vector (control), ATL3-myc or ATL3 Y192C-myc were incubated for 24 h, treated without (steady state) or with starvation medium plus 50 μM chloroquine (starv. + CQ) for 3 h, fixed and processed for immunofluorescence staining with antibodies against LC3 and myc and with Hoechst 33342 to label nuclei. a Single Apotome sections of representative cells from n = 3 independent experiments. Arrows, LC3-positive vesicles. Scale bar 10 μm. Note that the starvation medium causes ER morphology changes, indicated by the relocalization of ATL3 to larger aggregates (arrowheads). b Quantification of cells from a. Displayed is the average number of LC3-positive vesicles per cell normalized to the cell size. Error bars depict SEM. Analyzed were 26–30 cells for each condition from three independent experiments, p values are indicated (Welch’s t test)CC BY · PubMed Central
Fig. 5 Axonal outgrowth is inhibited and ATL3 Y192C is mislocalized in cultured neurons. Cortical murine primary neurons were transfected with myc-tagged ATL3 variants (a, b) or additionally co-transfected with tomato-KDEL as ER-marker (c–f), fixed 24 h later and stained with antibodies as indicated. The DIV at day of fixation is indicated. Arrows indicate axons. a Note the untransfected neuron just below the transfected one with a normally grown axon (asterisk). b Quantification of a. Displayed is the mean length of the longest neurite (the future axon). Error bars depict SEM. d, f Quantification from c, e. The ratio depicts the mean length of ATL3 staining divided by the mean length of axonal ER staining staining extending into the axon. a–f Analyzed were 32–51 neurons for each condition from three independent experiments. Error bars depict SEM, p values are indicated (Welch’s t test). Scale bar 10 μm
Fig. 5 Axonal outgrowth is inhibited and ATL3 Y192C is mislocalized in cultured neurons. Cortical murine primary neurons were transfected with myc-tagged ATL3 variants (a, b) or additionally co-transfected with tomato-KDEL as ER-marker (c–f), fixed 24 h later and stained with antibodies as indicated. The DIV at day of fixation is indicated. Arrows indicate axons. a Note the untransfected neuron just below the transfected one with a normally grown axon (asterisk). b Quantification of a. Displayed is the mean length of the longest neurite (the future axon). Error bars depict SEM. d, f Quantification from c, e. The ratio depicts the mean length of ATL3 staining divided by the mean length of axonal ER staining staining extending into the axon. a–f Analyzed were 32–51 neurons for each condition from three independent experiments. Error bars depict SEM, p values are indicated (Welch’s t test). Scale bar 10 μmCC BY · PubMed Central
Fig. 6 Reduced ER complexity and deficits in autophagy in patient cells. Fibroblasts derived from healthy donors (control) and a HSAN1 patient with ATL3 Y192C mutation (patient) were incubated for 24 h and a fixed and processed for immunofluorescence staining with antibodies against RTN4 or b treated with starvation medium plus 50 μM chloroquine (starv. + CQ) for 3 h. Thereafter cells were fixed and processed for immunofluorescence staining with LC3 antibodies and with Hoechst 33342 to label nuclei. Arrows, LC3-positive vesicles. Graph: displayed is the ratio of LC3-positive vesicles per cell normalized to control 1.1. Error bars depict SEM, *p = 0.001; ***p = 2 × 10⁻⁵ to 2 × 10⁻⁴ (Student’s t test). At least 177–239 cells were analyzed for each condition from n = 4 independent experiments. c Control and patient fibroblasts were treated with or without starvation medium for 3 h, lysed, blotted and probed for p62. For full size blots and stain-free gel imaging as loading control see Fig. S6. d Quantification of n = 3 independent experiments from c. Displayed is the mean ratio of p62 intensity in starved/unstarved conditions. Error bars depict SEM. p values are indicated (Student’s t test). Single Apotome sections, scale bar 10 μm
Fig. 6 Reduced ER complexity and deficits in autophagy in patient cells. Fibroblasts derived from healthy donors (control) and a HSAN1 patient with ATL3 Y192C mutation (patient) were incubated for 24 h and a fixed and processed for immunofluorescence staining with antibodies against RTN4 or b treated with starvation medium plus 50 μM chloroquine (starv. + CQ) for 3 h. Thereafter cells were fixed and processed for immunofluorescence staining with LC3 antibodies and with Hoechst 33342 to label nuclei. Arrows, LC3-positive vesicles. Graph: displayed is the ratio of LC3-positive vesicles per cell normalized to control 1.1. Error bars depict SEM, *p = 0.001; ***p = 2 × 10⁻⁵ to 2 × 10⁻⁴ (Student’s t test). At least 177–239 cells were analyzed for each condition from n = 4 independent experiments. c Control and patient fibroblasts were treated with or without starvation medium for 3 h, lysed, blotted and probed for p62. For full size blots and stain-free gel imaging as loading control see Fig. S6. d Quantification of n = 3 independent experiments from c. Displayed is the mean ratio of p62 intensity in starved/unstarved conditions. Error bars depict SEM. p values are indicated (Student’s t test). Single Apotome sections, scale bar 10 μmCC BY · PubMed Central

Verification

Claims the paper makes

The claims and statistics of this paper haven’t been checked yet.

Free: it reads the open-access text and checks the first 5 claims that cite a source we can check. Create a free account to check every claim.

A few free checks a day · papers already verified open instantly · results are public

Claims other papers make about this one

Each is checked against this paper’s own text: does it say what the citing paper says it does?

Self-check

Percentages, sums and reported differences re-computed from the paper’s own numbers.

The self-check needs the paper’s full text.

Citations

Cites

Show all 57 references

Cited by

See all 52

Metadata

Authors
Behrendt, L., Kurth, I., & Kaether, C.
Affiliations
  • Leibniz Institute on Aging - Fritz Lipmann Institute (FLI) (DE)
  • RWTH Aachen University (DE)
Corresponding author
Kaether, Christoph
Venue
Cellular and Molecular Life Sciences
Published
2019-01-21
Volume
76
Issue
7
Pages
1433-1445
ISSN
  • 1420-682X (ISSN-L)
  • 1420-9071
OpenAlex
W2913602489
Cited by
48
References
57
Citations by year
2026: 6 · 2025: 4 · 2024: 4 · 2023: 5 · 2022: 6 · 2021: 11 · 2020: 8 · 2019: 4
FWCI
3.46
Type
journal article
Language
en
Open access
Licence
  • cc-by
  • creativecommons.org/licenses/by/4.0 (tdm)
Locations
  • Cellular and Molecular Life Sciences (publishedVersion, cc-by)
  • Europe PMC (PubMed Central) (publishedVersion, other-oa)
  • PubMed Central (publishedVersion, cc-by)
  • PubMed (publishedVersion)
  • Informationszentrum Lebenswissenschaften (ZB MED) (submittedVersion, cc-by)
  • RWTH Publications (RWTH Aachen) (submittedVersion, other-oa)
  • RWTH Publications (RWTH Aachen)
Topics
  • Life Sciences › Neuroscience › Cellular and Molecular Neuroscience › Hereditary Neurological Disorders
  • Life Sciences › Biochemistry, Genetics and Molecular Biology › Cell Biology › Cellular transport and secretion
  • Life Sciences › Biochemistry, Genetics and Molecular Biology › Cell Biology › Endoplasmic Reticulum Stress and Disease
Keywords
endoplasmic reticulum morphology, ER exit sites, ER export, autophagy, Golgi fragmentation, axon growth, hereditary sensory neuropathy, spastic paraplegia, patient-derived fibroblasts
MeSH terms
Autophagosomes, Animals, Autophagy, Axons, Cells, Cultured, Endoplasmic Reticulum, Golgi Apparatus, HeLa Cells, Humans, Membrane Proteins, Neurons, Mutagenesis, Site-Directed, GTP-Binding Proteins, GTP Phosphohydrolases, Mice

About these checks

Registry, retraction, Cites and statistics results are computed, not judged, with one exception: a printed reference that no index lists is read once by a model before it counts as a citation error. Claims are extracted by a model and kept only when their quote appears verbatim in the text; each cited source is then checked, with a model’s help, for whether it says what the claim relies on. Those verdicts can be wrong — read the claim’s quote and the cited source before relying on one.

Statistics and arithmetic are recomputed, not judged.

Confidence bands are shown only for fields calibrated on our annotated test set. None is calibrated yet, so no band is shown.

What counts as a claim ›How we measure confidence ›How we check this ›

Are you an author, or do you see a problem with this page? Request a review

How to cite

Cite CoChat for the checks on this page, and the paper for its own findings.

This page
CoChat. (2026). Citation check: A disease causing ATLASTIN 3 mutation affects multiple endoplasmic reticulum-related pathways. https://app.cochat.ai/papers/10.1007/s00018-019-03010-x
The paper
Behrendt, L., Kurth, I., & Kaether, C. (2019). A disease causing ATLASTIN 3 mutation affects multiple endoplasmic reticulum-related pathways. Cellular and Molecular Life Sciences. https://doi.org/10.1007/s00018-019-03010-x

Data sources

Bibliographic data: Semantic Scholar, OpenAlex, Crossref.

Contains information from the Semantic Scholar Academic Graph Datasets, made available under the ODC Attribution License (ODC-BY 1.0).

Semantic Scholar’s data is described in: Kinney, R., et al. (2023). The Semantic Scholar Open Data Platform. arXiv:2301.10140.