

The DOI matches its Crossref record; 1 of the 1 references it cites were found in a registry or an index.
Micro simulated moving bed chromatography-mass spectrometry as a continuous on-line process analytical tool
Abstract
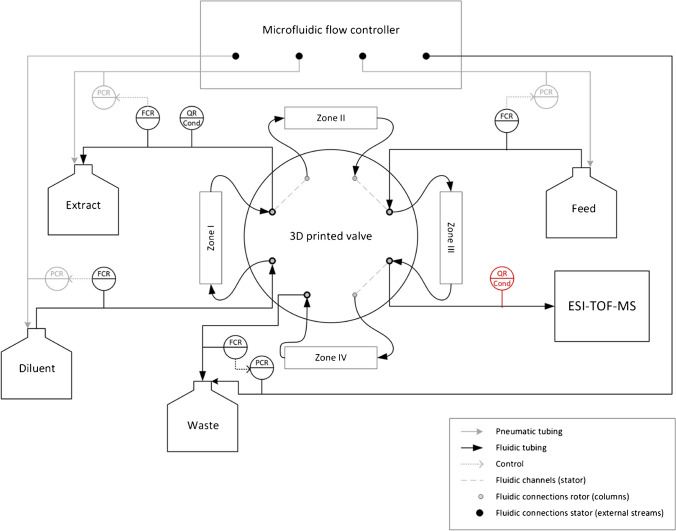
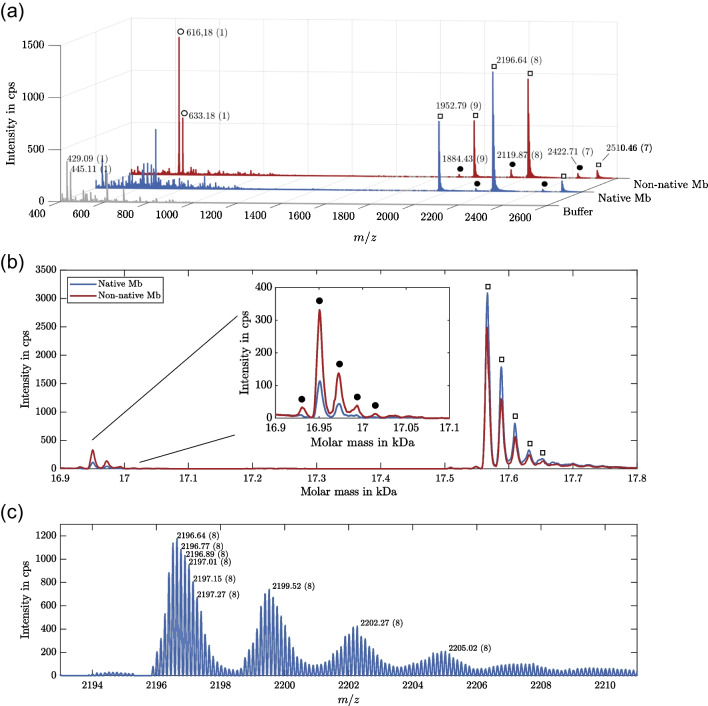
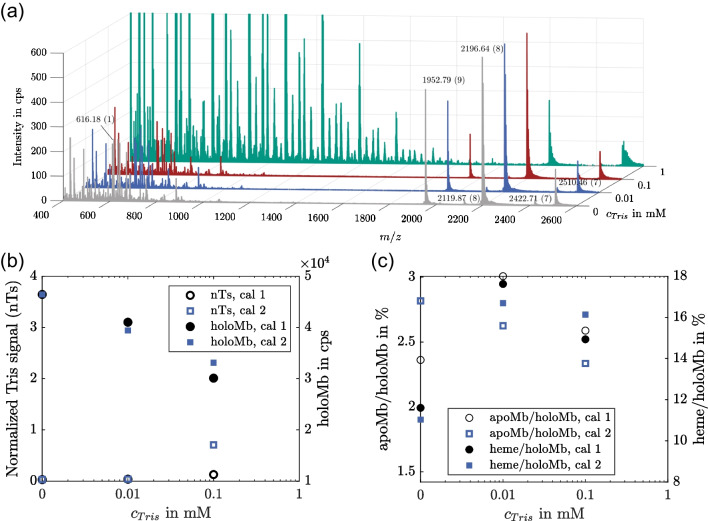
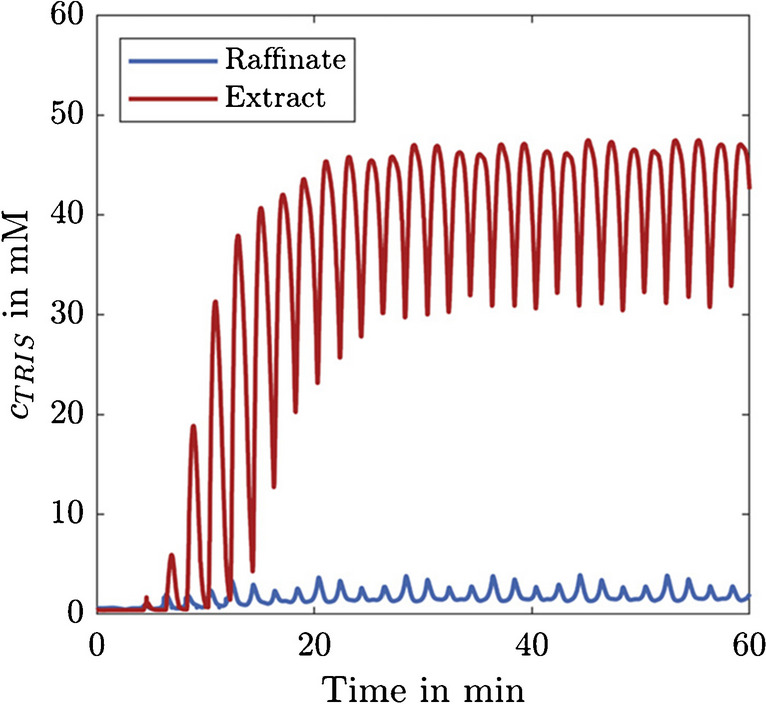
Continuous manufacturing is becoming increasingly important in the (bio-)pharmaceutical industry, as more product can be produced in less time and at lower costs. In this context, there is a need for powerful continuous analytical tools. Many established off-line analytical methods, such as mass spectrometry (MS), are hardly considered for process analytical technology (PAT) applications in biopharmaceutical processes, as they are limited to at-line analysis due to the required sample preparation and the associated complexity, although they would provide a suitable technique for the assessment of a wide range of quality attributes. In this study, we investigated the applicability of a recently developed micro simulated moving bed chromatography system (µSMB) for continuous on-line sample preparation for MS. As a test case, we demonstrate the continuous on-line MS measurement of a protein solution (myoglobin) containing Tris buffer, which interferes with ESI-MS measurements, by continuously exchanging this buffer with a volatile ammonium acetate buffer suitable for MS measurements. The integration of the µSMB significantly increases MS sensitivity by removing over 98% of the buffer substances. Thus, this study demonstrates the feasibility of on-line µSMB-MS, providing a versatile PAT tool by combining the detection power of MS for various product attributes with all the advantages of continuous on-line analytics. Graphical abstract
Overview
The claims and statistics of this paper haven’t been checked yet.
Run the check — free, no account needed. It reads the open-access text and checks the sources it cites.
Integrity signals
Registry
Cites
Statistics
Figures
Verification
Claims the paper makes
The claims and statistics of this paper haven’t been checked yet.
Run the check — free, no account needed. It reads the open-access text and checks the sources it cites.
Claims other papers make about this one
Each is checked against this paper’s own text: does it say what the citing paper says it does?
The cited source says what the claim attributes to it.
In the citing paper
“A solution to this limitation was explored by Diehm et al., in 2024, by hyphenating a micro‐simulated moving bed chromatography (µSMB) for sample preparation and using MS for measurements. This was implemented in an on‐line setup within the PAT.”
From Current PAT Landscape in the Downstream Processing of Biopharmaceuticals (2025) · cites this paper as [88]
Self-check
Percentages, sums and reported differences re-computed from the paper’s own numbers.
The self-check needs the paper’s full text.
Citations
Cites
Dai, J., Lamp, J., Xia, Q., & Zhang, Y. (2018) · Analytical Chemistry · doi:10.1021/acs.analchem.7b04608 · Cited by 123
Research works printed but not linked: 40
- Luis SV, García-Verdugo E. Chemical reactions and processes under flow conditions. Royal Society of Chemistry; 2010.
- Gerstweiler L, Bi J, Middelberg APJ. Continuous downstream bioprocessing for intensified manufacture of biopharmaceuticals and antibodies. Chem Eng Sci. 2020. https://doi.org/10.1016/j.ces.2020.116272. · DOI
- Rathore AS, Thakur G, Kateja N. Continuous integrated manufacturing for biopharmaceuticals: a new paradigm or an empty promise? Biotechnol Bioeng. 2023;120:333–51. https://doi.org/10.1002/bit.28235. · DOI · Paper page
- Xie W, Pedrielli G (2022) From discovery to production: challenges and novel methodologies for next generation biomanufacturing. In: 2022 Winter Simulation Conference (WSC). pp 238–252. · DOI
- Rolinger L, Rüdt M, Hubbuch J. A critical review of recent trends, and a future perspective of optical spectroscopy as PAT in biopharmaceutical downstream processing. Anal Bioanal Chem. 2020;412:2047–64. https://doi.org/10.1007/s00216-020-02407-z. · DOI · Paper page
- Wasalathanthri DP, Shah R, Ding J, Leone A, Li ZJ. Process analytics 4.0: a paradigm shift in rapid analytics for biologics development. Biotechnol Prog. 2021;37:e3177. https://doi.org/10.1002/btpr.3177. · DOI · Paper page
- Lyubarskaya Y, Kobayashi K, Swann P. Application of mass spectrometry to facilitate advanced process controls of biopharmaceutical manufacture. Pharm Bioprocess. 2015;3:313–21. https://doi.org/10.4155/pbp.15.10. · DOI
- São Pedro MN, Klijn ME, Eppink MH, Ottens M. Process analytical technique (PAT) miniaturization for monoclonal antibody aggregate detection in continuous downstream processing. J Chem Technol Biotechnol. 2022;97:2347–64. https://doi.org/10.1002/jctb.6920. · DOI
- Lingg N, Zhang P, Song Z, Bardor M. The sweet tooth of biopharmaceuticals: importance of recombinant protein glycosylation analysis. Biotechnol J. 2012;7:1462–72. https://doi.org/10.1002/biot.201200078. · DOI
- Dotz V, Haselberg R, Shubhakar A, Kozak RP, Falck D, Rombouts Y, Reusch D, Somsen GW, Fernandes DL, Wuhrer M. Mass spectrometry for glycosylation analysis of biopharmaceuticals. TrAC Trends Anal Chem. 2015;73:1–9. https://doi.org/10.1016/j.trac.2015.04.024. · DOI
- Füssl F, Cook K, Scheffler K, Farrell A, Mittermayr S, Bones J. Charge variant analysis of monoclonal antibodies using direct coupled pH gradient cation exchange chromatography to high-resolution native mass spectrometry. Anal Chem. 2018;90:4669–76. https://doi.org/10.1021/acs.analchem.7b05241. · DOI
- Kükrer B, Filipe V, van Duijn E, Kasper PT, Vreeken RJ, Heck AJR, Jiskoot W. Mass spectrometric analysis of intact human monoclonal antibody aggregates fractionated by size-exclusion chromatography. Pharm Res. 2010;27:2197–204. https://doi.org/10.1007/s11095-010-0224-5. · DOI
- Vallejo DD, Jeon CK, Parson KF, Herderschee HR, Eschweiler JD, Filoti DI, Ruotolo BT. Ion mobility–mass spectrometry reveals the structures and stabilities of biotherapeutic antibody aggregates. Anal Chem. 2022;94:6745–53. https://doi.org/10.1021/acs.analchem.2c00160. · DOI
- Disela R, Bussy OL, Geldhof G, Pabst M, Ottens M (2023) Characterisation of the E. coli HMS174 and BLR host cell proteome to guide purification process development. Biotechnol J n/a:2300068. https://doi.org/10.1002/biot.202300068. · DOI
- Kufer R, Haindl M, Wegele H, Wohlrab S. Evaluation of peptide fractionation and native digestion as two novel sample preparation workflows to improve HCP characterization by LC–MS/MS. Anal Chem. 2019;91:9716–23. https://doi.org/10.1021/acs.analchem.9b01259. · DOI
- Yang F, Walker DE, Schoenfelder J, Carver J, Zhang A, Li D, Harris R, Stults JT, Yu XC, Michels DA. A 2D LC-MS/MS strategy for reliable detection of 10-ppm level residual host cell proteins in therapeutic antibodies. Anal Chem. 2018;90:13365–72. https://doi.org/10.1021/acs.analchem.8b03044. · DOI
- Wang L, Zeng S, Chen T, Qu H. Direct analysis in real time mass spectrometry, a process analytical technology tool for real-time process monitoring in botanical drug manufacturing. J Pharm Biomed Anal. 2014;91:202–9. https://doi.org/10.1016/j.jpba.2013.12.034. · DOI
- Yan B, Chen T, Xu Z, Qu H. Rapid process development of chromatographic process using direct analysis in real time mass spectrometry as a process analytical technology tool. J Pharm Biomed Anal. 2014;94:106–10. https://doi.org/10.1016/j.jpba.2014.01.033. · DOI
- Venter A, Nefliu M, Graham Cooks R. Ambient desorption ionization mass spectrometry. TrAC Trends Anal Chem. 2008;27:284–90. https://doi.org/10.1016/j.trac.2008.01.010. · DOI
- Gross JH. Direct analysis in real time—a critical review on DART-MS. Anal Bioanal Chem. 2014;406:63–80. https://doi.org/10.1007/s00216-013-7316-0. · DOI
- Shieh I-F, Lee C-Y, Shiea J. Eliminating the interferences from TRIS buffer and SDS in protein analysis by fused-droplet electrospray ionization mass spectrometry. J Proteome Res. 2005;4:606–12. https://doi.org/10.1021/pr049765m. · DOI
- Chien C-T, Li F-A, Huang J-L, Her G-R. CE-MS of antihistamines using nonvolatile phosphate buffer. Electrophoresis. 2007;28:1454–60. https://doi.org/10.1002/elps.200600542. · DOI
- Diehm J, Ballweg T, Franzreb M. Development of a 3D printed micro simulated moving bed chromatography system. J Chromatogr A. 2023;1695:463928. https://doi.org/10.1016/j.chroma.2023.463928. · DOI
- Juza M, Mazzotti M, Morbidelli M. Simulated moving-bed chromatography and its application to chirotechnology. Trends Biotechnol. 2000;18:108–18. https://doi.org/10.1016/S0167-7799(99)01419-5. · DOI
- Seidel-Morgenstern A, Keßler LC, Kaspereit M. New developments in simulated moving bed chromatography. Chem Eng Technol. 2008;31:826–37. https://doi.org/10.1002/ceat.200800081. · DOI
- Mazzotti M, Storti G, Morbidelli M. Optimal operation of simulated moving bed units for nonlinear chromatographic separations. J Chromatogr A. 1997;769:3–24. https://doi.org/10.1016/S0021-9673(97)00048-4. · DOI
- Brenner-Weiss G, Kirschhöfer F, Kühl B, Nusser M, Obst U. Analysis of non-covalent protein complexes by capillary electrophoresis–time-of-flight mass spectrometry. J Chromatogr A. 2003;1009:147–53. https://doi.org/10.1016/S0021-9673(03)00553-3. · DOI
- Ventouri IK, Malheiro DBA, Voeten RLC, Kok S, Honing M, Somsen GW, Haselberg R. Probing protein denaturation during size-exclusion chromatography using native mass spectrometry. Anal Chem. 2020;92:4292–300. https://doi.org/10.1021/acs.analchem.9b04961. · DOI
- Diehm J, Hackert V, Franzreb M. Configurable 3D printed microfluidic multiport valves with axial compression. Micromachines. 2021;12:1247. https://doi.org/10.3390/mi12101247. · DOI
- Leweke S, von Lieres E. Chromatography Analysis and Design Toolkit (CADET). Comput Chem Eng. 2018;113:274–94. https://doi.org/10.1016/j.compchemeng.2018.02.025. · DOI
- He Q-L, Leweke S, von Lieres E. Efficient numerical simulation of simulated moving bed chromatography with a single-column solver. Comput Chem Eng. 2018;111:183–98. https://doi.org/10.1016/j.compchemeng.2017.12.022. · DOI
- Chung SF, Wen CY. Longitudinal dispersion of liquid flowing through fixed and fluidized beds. AIChE J. 1968;14:857–66. https://doi.org/10.1002/aic.690140608. · DOI
- Wilson EJ, Geankoplis CJ. Liquid mass transfer at very low Reynolds numbers in packed beds. Ind Eng Chem Fundam. 1966;5:9–14. https://doi.org/10.1021/i160017a002. · DOI
- Polson A. The some aspects of diffusion in solution and a definition of a colloidal particle. J Phys Colloid Chem. 1950;54:649–52. https://doi.org/10.1021/j150479a007. · DOI
- Schmidt-Traub H, Schulte M, Seidel-Morgenstern A. Preparative chromatography. 2nd ed. John Wiley & Sons, Ltd; 2012. https://doi.org/10.1002/9783527649280. · DOI
- Katta V, Chait BT. Observation of the heme-globin complex in native myoglobin by electrospray-ionization mass spectrometry. J Am Chem Soc. 1991;113:8534–5. https://doi.org/10.1021/ja00022a058. · DOI
- Zaia J, Annan RS, Biemann K. The correct molecular weight of myoglobin, a common calibrant for mass spectrometry. Rapid Commun Mass Spectrom. 1992;6:32–6. https://doi.org/10.1002/rcm.1290060108. · DOI
- Sugiyama K, Highet RJ, Woods A, Cotter RJ, Osawa Y. Hydrogen peroxide-mediated alteration of the heme prosthetic group of metmyoglobin to an iron chlorin product: evidence for a novel oxidative pathway. Proc Natl Acad Sci U S A. 1997;94:796–801. https://doi.org/10.1073/pnas.94.3.796. · DOI
- Gomes PS, Zabkova M, Zabka M, Minceva M, Rodrigues AE. Separation of chiral mixtures in real SMB units: the FlexSMB-LSRE®. AIChE J. 2010;56:125–42. https://doi.org/10.1002/aic.11962. · DOI
- Beccaria M, Cabooter D. Current developments in LC-MS for pharmaceutical analysis. Analyst. 2020;145:1129–57. https://doi.org/10.1039/C9AN02145K. · DOI
Cited by
Sorted by citations
Current PAT Landscape in the Downstream Processing of Biopharmaceuticals
Sathiyapriyan, P., Mukherjee, S., Vogel, T., Essen, L., Boerema, D., Vey, M., & Kalina, U. (2025) · Analytical Science Advances · doi:10.1002/ansa.70013 · Cited by 45
Metadata
- Authors
- Diehm, J., Witting, L., Kirschhöfer, F., Brenner-Weiß, G., & Franzreb, M.
- Venue
- Analytical and Bioanalytical Chemistry
- Published
- 2023-11-10
- Volume
- 416
- Issue
- 2
- Pages
- 373-386
- ISSN
- 1618-2642
- 1618-2650
- PMC
- PMC10761468
- Cited by
- 2
- References
- 1
- Language
- en
- Funders
- Stiftung Begabtenförderung Cusanuswerk
- Karlsruher Institut für Technologie (KIT)
About these checks
Registry, retraction, Cites and statistics results are computed, not judged, with one exception: a printed reference that no index lists is read once by a model before it counts as a citation error. Claims are extracted by a model and kept only when their quote appears verbatim in the text; each cited source is then checked, with a model’s help, for whether it says what the claim relies on. Those verdicts can be wrong — read the claim’s quote and the cited source before relying on one.
Statistics and arithmetic are recomputed, not judged.
Confidence bands are shown only for fields calibrated on our annotated test set. None is calibrated yet, so no band is shown.
What counts as a claim ›How we measure confidence ›How we check this ›
Are you an author, or do you see a problem with this page? Request a review
