

The DOI matches its Crossref record; 42 of the 44 references it cites were found in a registry or an index.
EANM/EARL FDG-PET/CT accreditation - summary results from the first 200 accredited imaging systems
Open accessAbstract
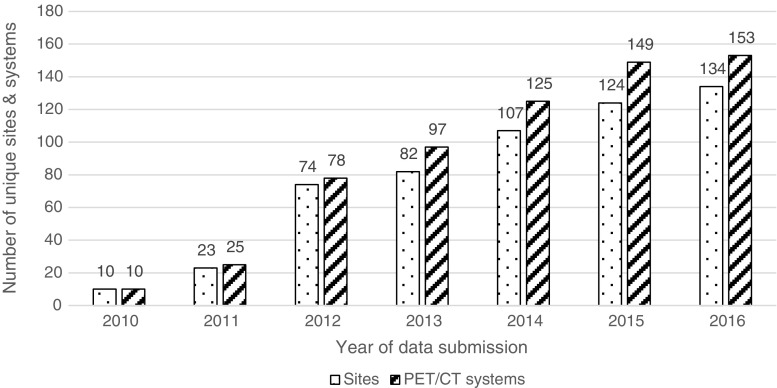
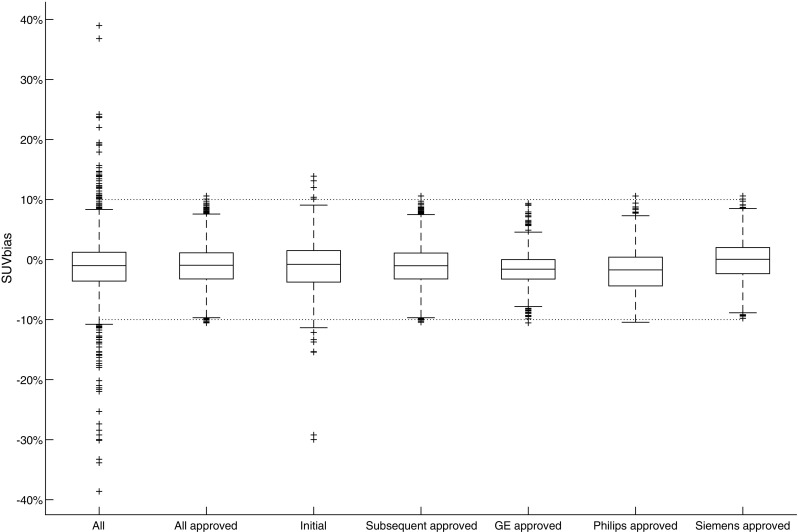
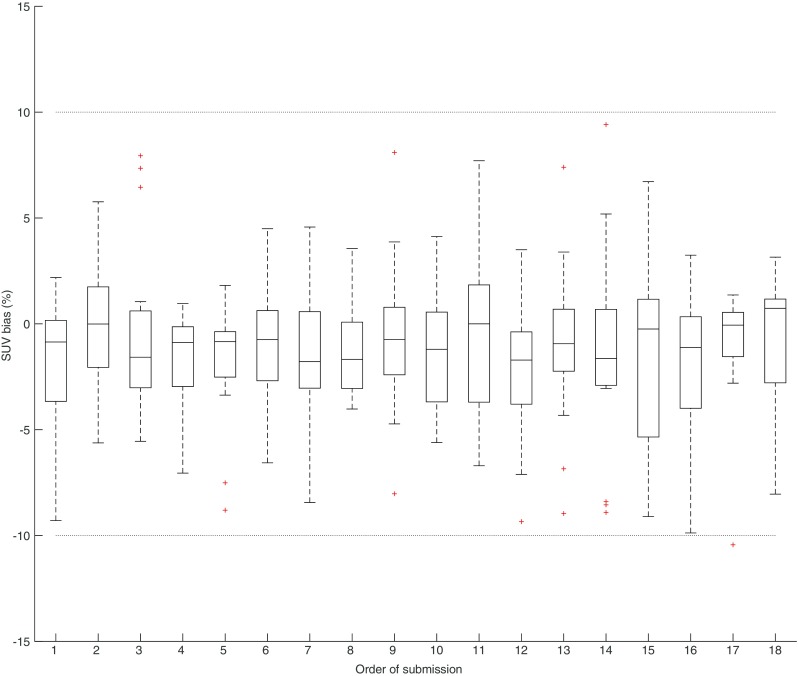
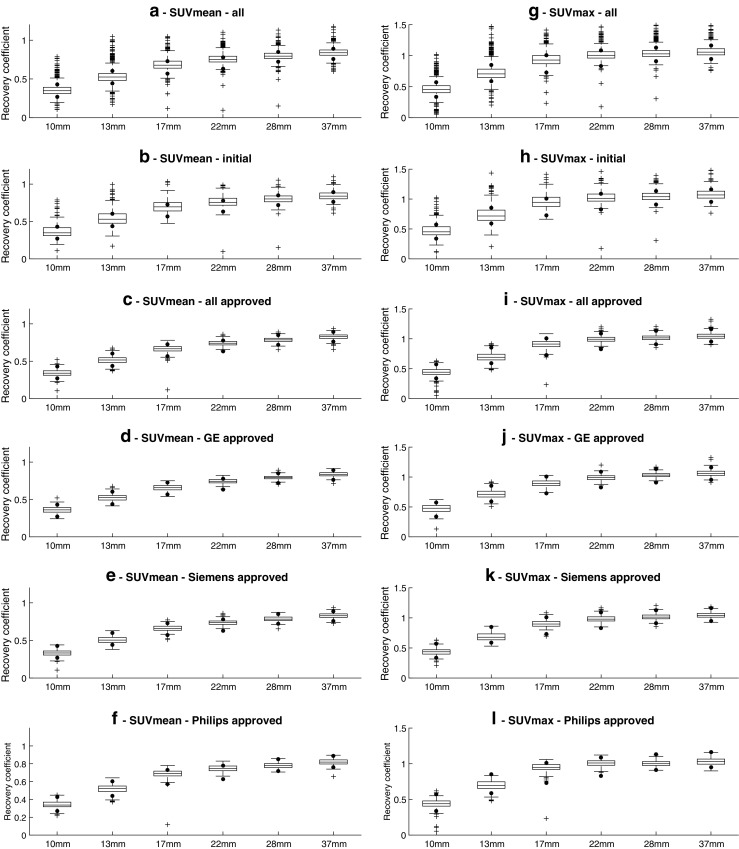
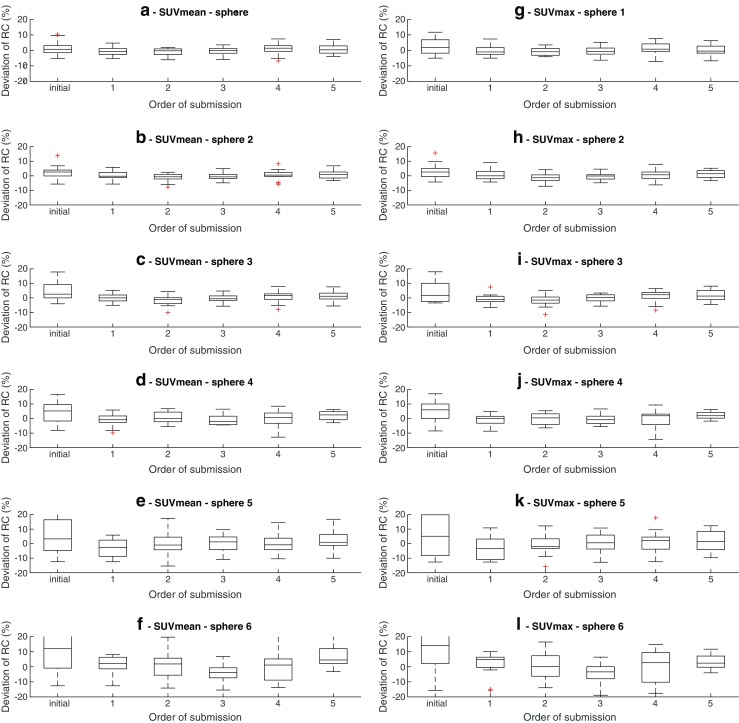
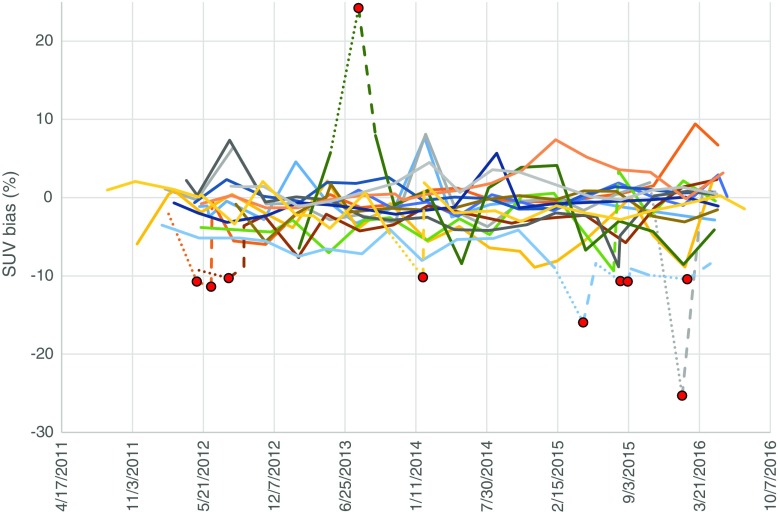
PURPOSE: From 2010 until July 2016, the EANM Research Ltd. (EARL) FDG-PET/CT accreditation program has collected over 2500 phantom datasets from approximately 200 systems and 150 imaging sites worldwide. The objective of this study is to report the findings and impact of the accreditation program on the participating PET/CT systems. METHODS: To obtain and maintain EARL accredited status, sites were required to complete and submit two phantom scans - calibration quality control (CalQC), using a uniform cylindrical phantom and image quality control (IQQC), using a NEMA NU2-2007 body phantom. Average volumetric SUV bias and SUV recovery coefficients (RC) were calculated and the data evaluated on the basis of quality control (QC) type, approval status, PET/CT system manufacturer and submission order. RESULTS: SUV bias in 5% (n = 96) of all CalQC submissions (n = 1816) exceeded 10%. After corrective actions following EARL feedback, sites achieved 100% compliance within EARL specifications. 30% (n = 1381) of SUVmean and 23% (n = 1095) of SUVmax sphere recoveries from IQQC submissions failed to meet EARL accreditation criteria while after accreditation, failure rate decreased to 12% (n = 360) and 9% (n = 254), respectively. Most systems demonstrated longitudinal SUV bias reproducibility within ±5%, while RC values remained stable and generally within ±10% for the four largest and ±20% for the two smallest spheres. CONCLUSIONS: Regardless of manufacturer or model, all investigated systems are able to comply with the EARL specifications. Within the EARL accreditation program, gross PET/CT calibration errors are successfully identified and longitudinal variability in PET/CT performances reduced. The program demonstrates that a harmonising accreditation procedure is feasible and achievable.
Overview
The claims and statistics of this paper haven’t been checked yet.
Run the check — free, no account needed. It reads the open-access text and checks the sources it cites.
Integrity signals
Registry
Cites
Statistics
Figures
Verification
Claims the paper makes
The claims and statistics of this paper haven’t been checked yet.
Run the check — free, no account needed. It reads the open-access text and checks the sources it cites.
Claims other papers make about this one
Each is checked against this paper’s own text: does it say what the citing paper says it does?
The source backs part of the claim, not all of it — or backs it for a different population, condition or comparison.
In the citing paper
“Although all these errors are potentially severe, it should be noted that they can easily be avoided by following existing guidelines published by the EANM [24] or the EANM Research Ltd. (EARL) initiative [67].”
From Influences on PET Quantification and Interpretation (2022) · cites this paper as [67]
Experimental — accuracy not yet measured
Self-check
Percentages, sums and reported differences re-computed from the paper’s own numbers.
The self-check needs the paper’s full text.
Citations
Cites
FDG PET/CT: EANM procedure guidelines for tumour imaging: version 2.0
Boellaard, R., Delgado-Bolton, R., Oyen, W. J. G., Giammarile, F., Tatsch, K., Eschner, W., Verzijlbergen, F. J., Barrington, S. F., Pike, L. C., Weber, W. A., et al. (2015) · European Journal of Nuclear Medicine and Molecular Imaging · doi:10.1007/s00259-014-2961-x · Cited by 3,303
Self-citationRecommendations on the Use of 18 F-FDG PET in Oncology
Fletcher, J. W., Djulbegović, B., Soares, H. P., Siegel, B. A., Lowe, V. J., Lyman, G. H., Coleman, R. E., Wahl, R. L., Paschold, J. C., Avril, N. E., et al. (2008) · Journal of Nuclear Medicine · doi:10.2967/jnumed.107.047787 · Cited by 1,113
Standards for PET Image Acquisition and Quantitative Data Analysis
Boellaard, R. (2009) · Journal of Nuclear Medicine · doi:10.2967/jnumed.108.057182 · Cited by 906
Self-citationClinical biomarkers in drug discovery and development
Frank, R., & Hargreaves, R. J. (2003) · Nature Reviews Drug Discovery · doi:10.1038/nrd1130 · Cited by 807
Procedure guideline for tumor imaging with 18F-FDG PET/CT 1.0.
Delbeke, D., Coleman, R. E., Guiberteau, M. J., Brown, M. L., Royal, H. D., Siegel, B. A., Townsend, D. W., Berland, L. L., Parker, J. A., Hubner, K., et al. (2006) · PubMed · Cited by 689
Shankar, L. K., Hoffman, J. M., Bacharach, S. L., Graham, M. M., Karp, J. S., Lammertsma, A. A., Larson, S. M., Mankoff, D. A., Siegel, B. A., den Abbeele, A. V., et al. (2006) · PubMed · Cited by 677
A Systematic Review of the Factors Affecting Accuracy of SUV Measurements
Adams, M. C., Turkington, T. G., Wilson, J. M., & Wong, T. Z. (2010) · American Journal of Roentgenology · doi:10.2214/ajr.10.4923 · Cited by 662
Kinahan, P. E., & Fletcher, J. W. (2010) · Seminars in Ultrasound, CT and MRI · doi:10.1053/j.sult.2010.10.001 · Cited by 631
Procedure guideline for tumor imaging with F-18 FDG PET/CT
Delbeke, D., Coleman, R. E., Guiberteau, M. J., Brown, M. L., Royal, H. D., Siegel, B. A., Townsend, D. W., Berland, L. L., Parker, J. A., Hübner, K. F., et al. (2006) · Cited by 620
Understanding the standardized uptake value, its methods, and implications for usage.
Thie, J. A. (2004) · PubMed · Cited by 546
Research works printed but not linked: 1
- Kinahan P, Wahl R, Shao L, Frank R, Perlman E. The QIBA profile for quantitative FDG-PET/CT oncology imaging. J Nucl Med. 2014;55:1520.
Cited by
Sorted by citations
Swart, L. E., Gomes, A., Scholtens, A. M., Sinha, B. N. M., Tanis, W., Lam, M. G. E. H., van der Vlugt, M. J., Streukens, S. A. F., Aarntzen, E. H. J. G., Bucerius, J. A., et al. (2018) · Circulation · doi:10.1161/circulationaha.118.035032 · Cited by 196
EANM practice guideline for quantitative SPECT-CT
Dickson, J. C., Armstrong, I. S., Gabiña, P. M., Denis-Bacelar, A. M., Krizsan, A. K., Gear, J. I., WYNGAERT, T. V. D., de Geus‐Oei, L., & Herrmann, K. (2022) · European Journal of Nuclear Medicine and Molecular Imaging · doi:10.1007/s00259-022-06028-9 · Cited by 125
Recent Developments in SPECT/CT
Ritt, P. (2022) · Seminars in Nuclear Medicine · doi:10.1053/j.semnuclmed.2022.01.004 · Cited by 108
Schöder, H. M., Polley, M. C., Knopp, M. V., Hall, N. C., Kostakoglu, L., Zhang, J., Higley, H. R., Kelloff, G. J., Liu, H., Zelenetz, A. D., et al. (2020) · Blood · doi:10.1182/blood.2019003277 · Cited by 95
Nuclear medicine and molecular imaging advances in the 21st century
Vaz, S. C., Oliveira, F., Herrmann, K., & Veit-Haibach, P. (2020) · The British Journal of Radiology · doi:10.1259/bjr.20200095 · Cited by 86
Quantitative implications of the updated EARL 2019 PET–CT performance standards
Kaalep, A., Burggraaff, C. N., Pieplenbosch, S., Verwer, E. E., Sera, T., Zijlstra, J., Hoekstra, O. S., Oprea-Lager, D. E., & Boellaard, R. (2019) · EJNMMI Physics · doi:10.1186/s40658-019-0257-8 · Cited by 79
Self-citationPET/CT radiomics in breast cancer: Mind the step
Sollini, M., Cozzi, L., Ninatti, G., Antunovic, L., Cavinato, L., Chiti, A., & Kirienko, M. (2020) · Methods · doi:10.1016/j.ymeth.2020.01.007 · Cited by 75
Self-citationNienhuis, P. H., Antunes, I. F., Glaudemans, A. W. J. M., Jalving, M., Leung, D. K.-W., Noordzij, W., Slart, R. H. J. A., de Vries, E. F. J., & Hospers, G. A. P. (2021) · Journal of Nuclear Medicine · doi:10.2967/jnumed.121.262368 · Cited by 72
Radiomics Analysis for Clinical Decision Support in Nuclear Medicine
Ibrahim, A., Vallières, M., Woodruff, H. C., Primakov, S. P., Beheshti, M., Keek, S. A., Refaee, T., Sanduleanu, S., Walsh, S., Morin, O., et al. (2019) · Seminars in Nuclear Medicine · doi:10.1053/j.semnuclmed.2019.06.005 · Cited by 61
Vaz, S. C., Adam, J. A., Bolton, R. C. D., Véra, P., van Elmpt, W., Herrmann, K., Hicks, R. J., Lievens, Y. N., Santos, A., Schöder, H. M., et al. (2022) · European Journal of Nuclear Medicine and Molecular Imaging · doi:10.1007/s00259-021-05624-5 · Cited by 61
Robustness of PET Radiomics Features: Impact of Co-Registration with MRI
Stefano, A., Leal, A., Richiusa, S., Trang, P., Comelli, A., Benfante, V., Cosentino, S., SABINI, M. G., Tuttolomondo, A., Altieri, R., et al. (2021) · Applied Sciences · doi:10.3390/app112110170 · Cited by 56
EANM guidance document: dosimetry for first-in-human studies and early phase clinical trials
Stokke, C., Gnesin, S., Tran‐Gia, J., Cicone, F., Holm, S., Cremonesi, M., Blakkisrud, J., Wendler, T., Gillings, N., Herrmann, K., et al. (2024) · European Journal of Nuclear Medicine and Molecular Imaging · doi:10.1007/s00259-024-06640-x · Cited by 56
The diagnostic accuracy of 18F-FDG PET/CT in diagnosing fracture-related infections
Lemans, J. V. C., Hobbelink, M. G. G., IJpma, F. F. A., Plate, J. D. J., van den Kieboom, J., Bosch, P. G., Leenen, L. P. H., Kruyt, M. C., Glaudemans, A. W. J. M., & Govaert, G. A. M. (2018) · European Journal of Nuclear Medicine and Molecular Imaging · doi:10.1007/s00259-018-4218-6 · Cited by 55
Voskuilen, C. S., Schweitzer, D., Jensen, J. B., Nielsen, A. M., Joniau, S., Muilwijk, T., Necchi, A., Azizi, M., Spiess, P. E., Briganti, A., et al. (2019) · European Urology Oncology · doi:10.1016/j.euo.2019.09.004 · Cited by 54
Influences on PET Quantification and Interpretation
Rogasch, J. M. M., Hofheinz, F., van Heek, L., Voltin, C.-A., Boellaard, R., & Kobe, C. (2022) · Diagnostics · doi:10.3390/diagnostics12020451 · Cited by 57
Self-citationA review of harmonization strategies for quantitative PET
Akamatsu, G., Tsutsui, Y., Daisaki, H., Mitsumoto, K., Baba, S., & Sasaki, M. (2023) · Annals of Nuclear Medicine · doi:10.1007/s12149-022-01820-x · Cited by 52
Bone Metastases Are Measurable: The Role of Whole-Body MRI and Positron Emission Tomography
Oprea‐Lager, D. E., Cysouw, M. C. F., Boellaard, R., Deroose, C. M., de Geus‐Oei, L., Lopci, E., Bidaut, L. M., Herrmann, K., Fournier, L. S., Bäuerle, T., et al. (2021) · Frontiers in Oncology · doi:10.3389/fonc.2021.772530 · Cited by 49
Self-citationvan de Donk, P. P., Wind, T. T., Hooiveld-Noeken, J. S., van der Veen, E. L., Glaudemans, A. W. J. M., Diepstra, A., Jalving, M., de Vries, E. G. E., de Vries, E. F. J., & Hospers, G. A. P. (2021) · European Journal of Nuclear Medicine and Molecular Imaging · doi:10.1007/s00259-021-05407-y · Cited by 48
Liu, Z., Li, M., Zuo, C., Yang, Z., Yang, X., Ren, S., Peng, Y., Sun, G., Shen, J., Cheng, C., et al. (2021) · European Radiology · doi:10.1007/s00330-021-07778-0 · Cited by 46
van Sluis, J., van Snick, J. H., Brouwers, A., Noordzij, W., Dierckx, R., Borra, R., Slart, R., Lammertsma, A., Glaudemans, A., Boellaard, R., et al. (2022) · European Journal of Nuclear Medicine and Molecular Imaging · doi:10.1007/s00259-022-05919-1 · Cited by 43
Self-citationHarmonisation of PET/CT contrast recovery performance for brain studies
Verwer, E. E., Golla, S. S. V., Kaalep, A., Lubberink, M., van Velden, F. H. P., Bettinardi, V., Yaqub, M. M., Séra, T., Rijnsdorp, S., Lammertsma, A. A., et al. (2021) · European Journal of Nuclear Medicine and Molecular Imaging · doi:10.1007/s00259-021-05201-w · Cited by 41
Self-citationBouron, C., Mathie, C., Seegers, V., Morel, O., Jézéquel, P., Lasla, H., Guillerminet, C., Girault, S., Lacombe, M., Sher, A., et al. (2022) · Cancers · doi:10.3390/cancers14030637 · Cited by 35
EANM guidelines for PET-CT and PET-MR routine quality control
Koole, M. J. B., Armstrong, I. S., Krizsan, A. K., Stromvall, A., Visvikis, D., Sattler, B., Nekolla, S. G., & Dickson, J. C. (2022) · Zeitschrift für Medizinische Physik · doi:10.1016/j.zemedi.2022.08.003 · Cited by 34
Zorz, A., Rossato, M. A., Turco, P., Gomez, L. M. C., Bettinelli, A., Monte, F. D., Paiusco, M., Zucchetta, P., & Cecchin, D. (2024) · EJNMMI Physics · doi:10.1186/s40658-024-00671-x · Cited by 31
SUV variability in EARL-accredited conventional and digital PET
Koopman, D., Jager, P. L., Slump, C. H., Knollema, S., & van Dalen, J. A. (2019) · EJNMMI Research · doi:10.1186/s13550-019-0569-7 · Cited by 31
State-of-the-art of intelligent minimally invasive surgical robots
Fujie, M. G., & Zhang, B. (2020) · Frontiers of Medicine · doi:10.1007/s11684-020-0743-3 · Cited by 31
Martin, E., Geitenbeek, R., Coert, J. H., Hanff, D. F., Graven, L. H., Grünhagen, D. J., Verhoef, C. K., & Taal, W. (2020) · Neuro-Oncology · doi:10.1093/neuonc/noaa280 · Cited by 31
Sollini, M., Bandera, F., & Kirienko, M. (2019) · European Journal of Nuclear Medicine and Molecular Imaging · doi:10.1007/s00259-019-04531-0 · Cited by 30
Feasibility of PET/CT system performance harmonisation for quantitative multicentre 89Zr studies
on behalf of, E. A. R. L., Kaalep, A., EATRIS, Huisman, M. C., Séra, T., Vugts, D. J., & Boellaard, R. (2018) · EJNMMI Physics · doi:10.1186/s40658-018-0226-7 · Cited by 29
Self-citationHoudu, B., Lasnon, C., Licaj, I., Thomas, G., Do, P., Guizard, A.-V., Desmonts, C., & Aide, N. (2019) · European Journal of Nuclear Medicine and Molecular Imaging · doi:10.1007/s00259-018-4151-8 · Cited by 37
van den Bosch, S., Doornaert, P., Hoebers, F. J. P., Kreike, B., Vergeer, M. R., Zwijnenburg, E. M., Cox, M. C., Hannink, G., Dijkema, T., Kaanders, J. H. A. M., et al. (2025) · Journal of Clinical Oncology · doi:10.1200/jco-24-02194 · Cited by 28
Akamatsu, G., Shimada, N., Matsumoto, K., Daisaki, H., Suzuki, K., Watabe, H., Oda, K., Senda, M., Terauchi, T., & Tateishi, U. (2022) · Annals of Nuclear Medicine · doi:10.1007/s12149-021-01709-1 · Cited by 27
Guidance on prevention of unintended and accidental radiation exposures in nuclear medicine
Martin, C. J., Marengo, M., Vassileva, J., Giammarile, F., Poli, G. L., & Marks, P. (2019) · Journal of Radiological Protection · doi:10.1088/1361-6498/ab19d8 · Cited by 27
He, Y., Gu, Y., Yu, H., Wu, B., Wang, S., Tan, H., Cao, Y., Chen, S., Sui, X., Zhang, Y., et al. (2022) · EJNMMI Physics · doi:10.1186/s40658-022-00474-y · Cited by 27
Kosmala, A., Serfling, S. E., Michalski, K., Lindner, T., Schirbel, A., Higuchi, T., Hartrampf, P. E., Derlin, T., Buck, A. K., Weich, A., et al. (2023) · European Journal of Nuclear Medicine and Molecular Imaging · doi:10.1007/s00259-023-06245-w · Cited by 25
Gill, R. R., Tsao, A. S., Kindler, H. L., Richards, W. G., Armato, S. G., Francis, R. J., Gomez, D. R., Dahlberg, S. E., Rimner, A., Simone, C. B., et al. (2019) · Journal of Thoracic Oncology · doi:10.1016/j.jtho.2019.08.012 · Cited by 24
Radioactive 3D printing for the production of molecular imaging phantoms
Gear, J. I., Cummings, C., Sullivan, J., Cooper-Rayner, N., Downs, P., Murray, I., & Flux, G. (2020) · Physics in Medicine and Biology · doi:10.1088/1361-6560/aba40e · Cited by 23
Silvoniemi, A., Laine, J., Aro, K. L. S., Nissi, L., Bäck, L. J. J., Schildt, J., Hirvonen, J., Hagström, J., Irjala, H., Aaltonen, L., et al. (2023) · Cancers · doi:10.3390/cancers15153970 · Cited by 22
Daisaki, H., Kitajima, K., Nakajo, M., Watabe, T., Ito, K., Sakamoto, F., Nakahara, T., Ishibashi, M., & Toriihara, A. (2021) · Scientific Reports · doi:10.1038/s41598-021-87942-0 · Cited by 21
Driessen, J., Kersten, M. J., Visser, L., van den Berg, A., Tonino, S. H., Zijlstra, J. M., Lugtenburg, P. J., Morschhauser, F., Hutchings, M., Amorim, S., et al. (2022) · Leukemia · doi:10.1038/s41375-022-01717-8 · Cited by 21
Self-citationMiwa, K., Wagatsuma, K., Iimori, T., Sawada, K., Kamiya, T., Sakurai, M., Miyaji, N., Murata, T., & Sato, E. (2018) · Physica Medica · doi:10.1016/j.ejmp.2018.07.001 · Cited by 20
PET-based prognostic survival model after radiotherapy for head and neck cancer
Castelli, J., Depeursinge, A., Devillers, A., Campillo‐Gimenez, B., Dicente, Y., Prior, J. O., Chajon, É., Jégoux, F., Sire, C., Acosta, O., et al. (2018) · European Journal of Nuclear Medicine and Molecular Imaging · doi:10.1007/s00259-018-4134-9 · Cited by 20
Georgi, T., Kurch, L., Hasenclever, D., Warbey, V. S., Pike, L. C., Radford, J. A., Sabri, O., Kluge, R., & Barrington, S. F. (2020) · PLoS ONE · doi:10.1371/journal.pone.0231027 · Cited by 19
Kitajima, K., Miyoshi, Y., Sekine, T., Takei, H., Ito, K., Suto, A., Kaida, H., Ishii, K., Daisaki, H., & Yamakado, K. (2021) · Oncotarget · doi:10.18632/oncotarget.27851 · Cited by 19
Method to determine the statistical technical variability of SUV metrics
Luca, G. D. D., & Habraken, J. (2022) · EJNMMI Physics · doi:10.1186/s40658-022-00470-2 · Cited by 19
Puri, T., Frost, M., Moore, A. E. B., Choudhury, A., Vinjamuri, S., Mahajan, A., Fynbo, C., Vrist, M., Theil, J., Kairemo, K., et al. (2023) · Frontiers in Endocrinology · doi:10.3389/fendo.2023.1236881 · Cited by 17
Multicentre Trials on Standardised Quantitative Imaging and Dosimetry for Radionuclide Therapies
Laßmann, M., Eberlein, U., & Tran‐Gia, J. (2020) · Clinical Oncology · doi:10.1016/j.clon.2020.11.008 · Cited by 19
Taprogge, J., Leek, F. A. A., & Flux, G. (2019) · The Quarterly Journal of Nuclear Medicine and Molecular Imaging · doi:10.23736/s1824-4785.19.03202-3 · Cited by 18
Prieto, E., García‐Velloso, M. J., Aquerreta, J. D., Rosales, J. J., Bastidas, J. F., Soriano, I., Irazola, L., Rodríguez‐Otero, P., Quincoces, G., & Martí-Climent, J. M. (2021) · Physica Medica · doi:10.1016/j.ejmp.2021.03.019 · Cited by 18
Quantitative SPECT/CT for Dosimetry of Peptide Receptor Radionuclide Therapy
Kennedy, J. A., Chicheportiche, A., & Keidar, Z. (2021) · Seminars in Nuclear Medicine · doi:10.1053/j.semnuclmed.2021.11.004 · Cited by 17
Stokmo, H. L., Aly, M., Lothe, I. M. B., Borja, A. J., Seraj, S. M., Ghorpade, R., Miao, X., Hjortland, G. O., Malinen, E., Sørbye, H., et al. (2022) · Journal of Neuroendocrinology · doi:10.1111/jne.13170 · Cited by 17
Leube, J., Claeys, W., Gustafsson, J., Salas-Ramirez, M., Laßmann, M., Koole, M. J. B., & Tran‐Gia, J. (2024) · EJNMMI Physics · doi:10.1186/s40658-024-00662-y · Cited by 17
Long Axial Field-of-View PET for Ultra-Low-Dose Imaging of Non-Hodgkin Lymphoma during Pregnancy
van Sluis, J., Bellido, M., Glaudemans, A. W. J. M., & Slart, R. H. J. A. (2022) · Diagnostics · doi:10.3390/diagnostics13010028 · Cited by 16
SUV Harmonization Between Different Hybrid PET/CT Systems
Rubello, D., & Colletti, P. M. (2018) · Clinical Nuclear Medicine · doi:10.1097/rlu.0000000000002284 · Cited by 16
Valladares, A., Ahangari, S., Beyer, T., Boellaard, R., Chalampalakis, Z., Comtat, C., Toso, L. D., Hansen, A. E., Koole, M. J. B., Mackewn, J. E., et al. (2019) · Frontiers in Physics · doi:10.3389/fphy.2019.00136 · Cited by 16
Self-citationQuantitative Imaging for Radiation Oncology
van der Heide, U. A., & Thorwarth, D. (2018) · International Journal of Radiation Oncology*Biology*Physics · doi:10.1016/j.ijrobp.2018.06.012 · Cited by 15
Ferretti, A., Chondrogiannis, S., Rampin, L., Bellan, E., Marzola, M. C., Grassetto, G., Gusella, S., Maffione, A. M., Gava, M. M., & Rubello, D. (2018) · Physics in Medicine and Biology · doi:10.1088/1361-6560/aaee27 · Cited by 15
de Mooij, C. M., Mitea, C., Mottaghy, F. M., Smidt, M. L., & van Nijnatten, T. J. A. (2021) · EJNMMI Research · doi:10.1186/s13550-021-00861-z · Cited by 14
Krokos, G., Pike, L. C., Cook, G., & Marsden, P. K. (2021) · EJNMMI Physics · doi:10.1186/s40658-021-00400-8 · Cited by 15
A novel approach for quantitative harmonization in PET
Namías, M., Bradshaw, T., Menezes, V. O. M. D. O., Machado, M. A. D., & Jeraj, R. (2018) · Physics in Medicine and Biology · doi:10.1088/1361-6560/aabb5f · Cited by 14
Pennings, J. P., de Haas, R. J., Murshid, K. J. A., de Jong, K. P., Dierckx, R., & Kwee, T. C. (2018) · European Journal of Surgical Oncology · doi:10.1016/j.ejso.2018.12.011 · Cited by 13
WYNGAERT, T. V. D., Schepper, S. D., & Carp, L. (2020) · Frontiers in Oncology · doi:10.3389/fonc.2020.01458 · Cited by 13
Mannheim, J. G., Rausch, I., Conti, M., la Fougère, C. J., & Schmidt, F. P. (2023) · EJNMMI Physics · doi:10.1186/s40658-023-00554-7 · Cited by 13
Sunderland, J. J., Boellaard, R., Dickson, J. C., Graves, S. A., & Bailey, D. (2025) · Journal of Nuclear Medicine · doi:10.2967/jnumed.124.269349 · Cited by 15
Self-citationFilippi, L., Urso, L., Schillaci, O., & Evangelista, L. (2023) · Diagnostics · doi:10.3390/diagnostics13152613 · Cited by 12
Galligan, A., Wallace, R., Krishnamurthy, B., Kay, T. W. H., Sachithanandan, N., Chiang, C. Y., Sandhu, S. K., Hicks, R. J., & Iravani, A. (2023) · Cancers · doi:10.3390/cancers15245803 · Cited by 13
Knip, J. J., Iqbal, R., Bonjer, E. C., Mammatas, L. H., van Zweeden, A. A., Perin, P., Teunissen, J. J. M., Diepenhorst, G. M. P., Schijf, L. J., Bakker, S. D., et al. (2025) · Radiology · doi:10.1148/radiol.241850 · Cited by 11
Self-citationQuality control in PET/CT and PET/MRI: Results of a survey amongst European countries
Reynés‐Llompart, G., Zorz, A., Boellaard, R., Ptáček, J., Pike, L. C., Soret, M., Vandenberghe, S., & Matheoud, R. (2022) · Physica Medica · doi:10.1016/j.ejmp.2022.05.004 · Cited by 11
Self-citationTavares, A., Mezzanotte, L., McDougald, W., Bernsen, M. R., Vanhove, C., Aswendt, M., Ielacqua, G. D., Gremse, F., MORAN, C. M., Warnock, G., et al. (2022) · Molecular Imaging and Biology · doi:10.1007/s11307-022-01790-6 · Cited by 11
Added Value of Abnormal Lymph Nodes Detected with FDG-PET/CT in Suspected Vascular Graft Infection
van Rijsewijk, N. D., Helthuis, J. H. G., Glaudemans, A. W. J. M., Wouthuyzen‐Bakker, M., Prakken, N. H. J., Liesker, D. J., Saleem, B. R., & Slart, R. H. J. A. (2023) · Biology · doi:10.3390/biology12020251 · Cited by 11
Bouchareb, Y., Tag, N., Sulaiman, H., Riyami, K. A., Jawa, Z. M., & Al-Dhuhli, H. (2023) · Nuclear Medicine and Molecular Imaging · doi:10.1007/s13139-023-00795-5 · Cited by 12
Cysouw, M. C. F., Kramer, G. M., Heijtel, D., Schuit, R. C., Morris, M. J., van den Eertwegh, A. J. M., Voortman, J., Hoekstra, O. S., Oprea‐Lager, D. E., & Boellaard, R. (2019) · EJNMMI Research · doi:10.1186/s13550-019-0531-8 · Cited by 11
Self-citationGalligan, A., Iravani, A., Lasocki, A., Wallace, R., Weppler, A. M., Sachithanandan, N., Chiang, C. Y., Colman, P. G., Wentworth, J. M., Spain, L. A., et al. (2023) · Frontiers in Endocrinology · doi:10.3389/fendo.2023.1295865 · Cited by 10
Oliveira, C., Oliveira, F. P. M., Constantino, C. S., Alves, C., Brito, M. J., Cardoso, F., & Costa, D. C. (2024) · European Journal of Nuclear Medicine and Molecular Imaging · doi:10.1007/s00259-024-06815-6 · Cited by 10
Toward Reliable Uptake Metrics in Large Vessel Vasculitis Studies
van Praagh, G. D., Nienhuis, P. H., de Jong, D. M., Reijrink, M., van der Geest, K. S. M., Brouwer, E., Glaudemans, A. W. J. M., Sinha, B. N. M., Willemsen, A. T. M., & Slart, R. H. J. A. (2021) · Diagnostics · doi:10.3390/diagnostics11111986 · Cited by 10
Mattoli, M. V., Calcagni, M. L., Taralli, S., Indovina, L., Spottiswoode, B. S., & Giordano, A. (2019) · Molecular Imaging and Biology · doi:10.1007/s11307-019-01342-5 · Cited by 9
EJNMMI supplement: bringing AI and radiomics to nuclear medicine
Veit‐Haibach, P., Buvat, I., & Herrmann, K. (2019) · European Journal of Nuclear Medicine and Molecular Imaging · doi:10.1007/s00259-019-04395-4 · Cited by 9
Vries, H. S., van Praagh, G. D., Nienhuis, P. H., Alić, L., & Slart, R. H. J. A. (2025) · Diagnostics · doi:10.3390/diagnostics15030367 · Cited by 8
Jessen, L., Kapidzic, S. C., Gustafsson, J., Larsson, E., Ljungberg, M. H., Sandström, M., Dalmo, J., Hagmarker, L., Hindorf, C., Taprogge, J., et al. (2025) · Physics in Medicine and Biology · doi:10.1088/1361-6560/add708 · Cited by 8
Vaz, S. C., Maclennan, S., van Nijnatten, T. V., Attard, A., Backhaus, P., Baltzer, P., Koretić, M. B., Buckle, T., Cook, G. J. R., Dibble, E. H., et al. (2025) · The EANM Journal · doi:10.1016/j.eanmj.2025.100004 · Cited by 7
Higgins, H., Nakhla, A., Lotfalla, A., Khalil, D., Doshi, P., Thakkar, V., Shirini, D., Bebawy, M., Ammari, S., Lopci, E., et al. (2023) · Diagnostics · doi:10.3390/diagnostics13223483 · Cited by 8
Machado, M. A. D., Menezes, V. O. M. D. O., Namías, M., Vieira, N. S., Queiroz, C. C., Matheoud, R., Alessio, A. M., & Oliveira, M. L. (2018) · Journal of Nuclear Medicine Technology · doi:10.2967/jnmt.118.213405 · Cited by 8
Fuchs, T., Kaiser, L., Müller, D., Papp, L., Fischer, R., & Tran‐Gia, J. (2023) · Nuklearmedizin - NuclearMedicine · doi:10.1055/a-2187-5701 · Cited by 7
Machado, M. A. D., Moraes, T. F., dos Anjos, B. H. L., de Alencar, N. R. G., Chang, T. M., Santana, B. C. R. F., Menezes, V. O. M. D. O., Vieira, L. O., Brandão, S. C. S., Salvino, M. A., et al. (2024) · Applied Radiation and Isotopes · doi:10.1016/j.apradiso.2024.111181 · Cited by 7
Inter‐scanner Aβ‐PET harmonization using barrel phantom spatial resolution matching
Ruwanpathirana, G. P., Williams, R. C., Masters, C. L., Rowe, C. C., Johnston, L. A., & Davey, C. E. (2024) · Alzheimer s & Dementia Diagnosis Assessment & Disease Monitoring · doi:10.1002/dad2.12561 · Cited by 7
Pini, C., Kirienko, M., Gelardi, F., Bossi, P., Rahal, D., Toschi, L., Ninatti, G., Rodari, M., Marulli, G., Antunovic, L., et al. (2024) · Cancer Imaging · doi:10.1186/s40644-024-00807-3 · Cited by 8
Self-citationRao, F., Yang, B., Chen, Y., Li, J., Wang, H., Ye, H., Wang, Y., Zhao, K., & Zhu, W. (2020) · Computer Methods and Programs in Biomedicine · doi:10.1016/j.cmpb.2020.105764 · Cited by 7
Vosoughi, H., Momennezhad, M., Emami, F., Hajizadeh, M., Rahmim, A., & Geramifar, P. (2023) · Quantitative Imaging in Medicine and Surgery · doi:10.21037/qims-22-443 · Cited by 7
Parkinson, C., Evans, M., Urbano, T. G., Michaelidou, A., Pike, L. C., Barrington, S. F., Jayaprakasam, V. S., Rackley, T., Palaniappan, N., Staffurth, J., et al. (2019) · Physica Medica · doi:10.1016/j.ejmp.2019.04.020 · Cited by 7
Lasnon, C., Enilorac, B., & Aide, N. (2018) · European Journal of Nuclear Medicine and Molecular Imaging · doi:10.1007/s00259-018-3938-y · Cited by 7
Agrigoroaie, L., Anizan, N., Garcia, C., Balleyguier, C., & Henry, T. (2025) · EJNMMI Research · doi:10.1186/s13550-025-01195-w · Cited by 6
Piwowarska-Bilska, H., Supińska, A., & Birkenfeld, B. (2022) · EJNMMI Physics · doi:10.1186/s40658-022-00434-6 · Cited by 6
Hamada, A., Kitajima, K., Suda, K., Koga, T., Soh, J., Kaida, H., Ito, K., Sekine, T., Takegahara, K., Daisaki, H., et al. (2023) · JTCVS Open · doi:10.1016/j.xjon.2023.02.004 · Cited by 9
Ferenc, N., Krizsan, A. K., Kukuts, K., Szoliková, M., Hascsi, Z., Barna, S. K., Acs, A., Szabo, P., Trón, L., Balkay, L., et al. (2021) · EJNMMI Physics · doi:10.1186/s40658-021-00371-w · Cited by 6
Miedema, I. H. C., Pouw, J. E. E., Kwakman, A., Zwezerijnen, G. J. C., Huisman, M. C., Timmer, F. E. F., van de Ven, R., de Gruijl, T. D., Hospers, G. A. P., Langen, A. J. D., et al. (2024) · Journal for ImmunoTherapy of Cancer · doi:10.1136/jitc-2024-008899 · Cited by 5
Color Maps: Facilitating the Clinical Impact of Quantitative MRI
Sollmann, N., Fuderer, M., Crameri, F., Weingärtner, S., Baeßler, B., Gulani, V., Keenan, K. E., Mandija, S., Golay, X., & deSouza, N. M. (2024) · Journal of Magnetic Resonance Imaging · doi:10.1002/jmri.29573 · Cited by 9
de Jesus, F. M., Vergote, V. K. J., Noordzij, W., Dierickx, D., Dierckx, R., Diepstra, A., Tousseyn, T., Gheysens, O. S., Kwee, T. C., Deroose, C. M., et al. (2021) · Journal of Clinical Medicine · doi:10.3390/jcm10020361 · Cited by 5
Cox, M. C., Jurcka, T., Arens, A. I. J., van Rijk, M. C., Kaanders, J. H. A. M., & van den Bosch, S. (2023) · EJNMMI Research · doi:10.1186/s13550-023-01042-w · Cited by 4
Filippi, L., Bianconi, F., Ferrari, C., Linguanti, F., Battisti, C., Urbano, N., Minestrini, M., Messina, S. G., Buci, L., Baldoncini, A., et al. (2025) · European Journal of Nuclear Medicine and Molecular Imaging · doi:10.1007/s00259-025-07508-4 · Cited by 4
Impact of scanner harmonization on PET-based treatment response assessment in metastatic melanoma
Weisman, A. J., Bradshaw, T., Namías, M., & Jeraj, R. (2020) · Physics in Medicine and Biology · doi:10.1088/1361-6560/abb6bb · Cited by 4
Metadata
- Authors
- Kaalep, A., Sera, T., Oyen, W., Krause, B. J., Chiti, A., Liu, Y., & Boellaard, R.
- Affiliations
- North Estonia Medical Centre (EE)
- Institute of Cancer Research (GB)
- Universitätsmedizin Rostock (DE)
- Humanitas University (IT)
- European Organisation for Research and Treatment of Cancer (NL)
- University Medical Center Groningen (NL)
- Corresponding author
- Kaalep, Andres
- Venue
- European Journal of Nuclear Medicine and Molecular Imaging
- Published
- 2017-12-01
- Volume
- 45
- Issue
- 3
- Pages
- 412-422
- ISSN
- 1619-7070 (ISSN-L)
- 1619-7089
- PMC
- PMC5787222
- OpenAlex
- W2773306697
- Cited by
- 174
- References
- 44
- Citations by year
- 2026: 18 · 2025: 30 · 2024: 20 · 2023: 22 · 2022: 22 · 2021: 20 · 2020: 14 · 2019: 13 · 2018: 15
- FWCI
- 8.82
- Type
- journal article
- Language
- en
- Open access
- hybrid
- doi.org
- Licence
- Locations
- European Journal of Nuclear Medicine and Molecular Imaging (publishedVersion, cc-by)
- PubMed Central (publishedVersion, cc-by)
- PubMed (publishedVersion)
- Pure Amsterdam UMC (publishedVersion, cc-by)
- SZTE Publicatio Repozitórium (University of Szeged) (acceptedVersion, other-oa)
- Archivio Istituzionale della Ricerca - Università Vita-Salute San Raffaele (submittedVersion, cc-by)
- Amsterdam UMC (VU Amsterdam) - Institutional Repository (submittedVersion, other-oa)
- University of Groningen research database (University of Groningen / Centre for Information Technology) (submittedVersion, cc-by)
- Data Archiving and Networked Services (DANS) (submittedVersion, other-oa)
- Topics
- Health Sciences › Medicine › Radiology, Nuclear Medicine and Imaging › Medical Imaging Techniques and Applications
- Health Sciences › Medicine › Radiology, Nuclear Medicine and Imaging › Radiation Dose and Imaging
- Physical Sciences › Physics and Astronomy › Radiation › Advanced Radiotherapy Techniques
- Keywords
- quality control, image quality control, standardized uptake value
- MeSH terms
- Accreditation, Positron Emission Tomography Computed Tomography, Calibration, Nuclear Medicine, Societies, Medical, Phantoms, Imaging, Fluorodeoxyglucose F18
About these checks
Registry, retraction, Cites and statistics results are computed, not judged, with one exception: a printed reference that no index lists is read once by a model before it counts as a citation error. Claims are extracted by a model and kept only when their quote appears verbatim in the text; each cited source is then checked, with a model’s help, for whether it says what the claim relies on. Those verdicts can be wrong — read the claim’s quote and the cited source before relying on one.
Statistics and arithmetic are recomputed, not judged.
Confidence bands are shown only for fields calibrated on our annotated test set. None is calibrated yet, so no band is shown.
What counts as a claim ›How we measure confidence ›How we check this ›
Are you an author, or do you see a problem with this page? Request a review
