

The DOI matches its Crossref record; 44 of the 44 references it cites were found in a registry or an index.
Inflammatory dysregulation of blood monocytes in Parkinson’s disease patients
Open accessAbstract
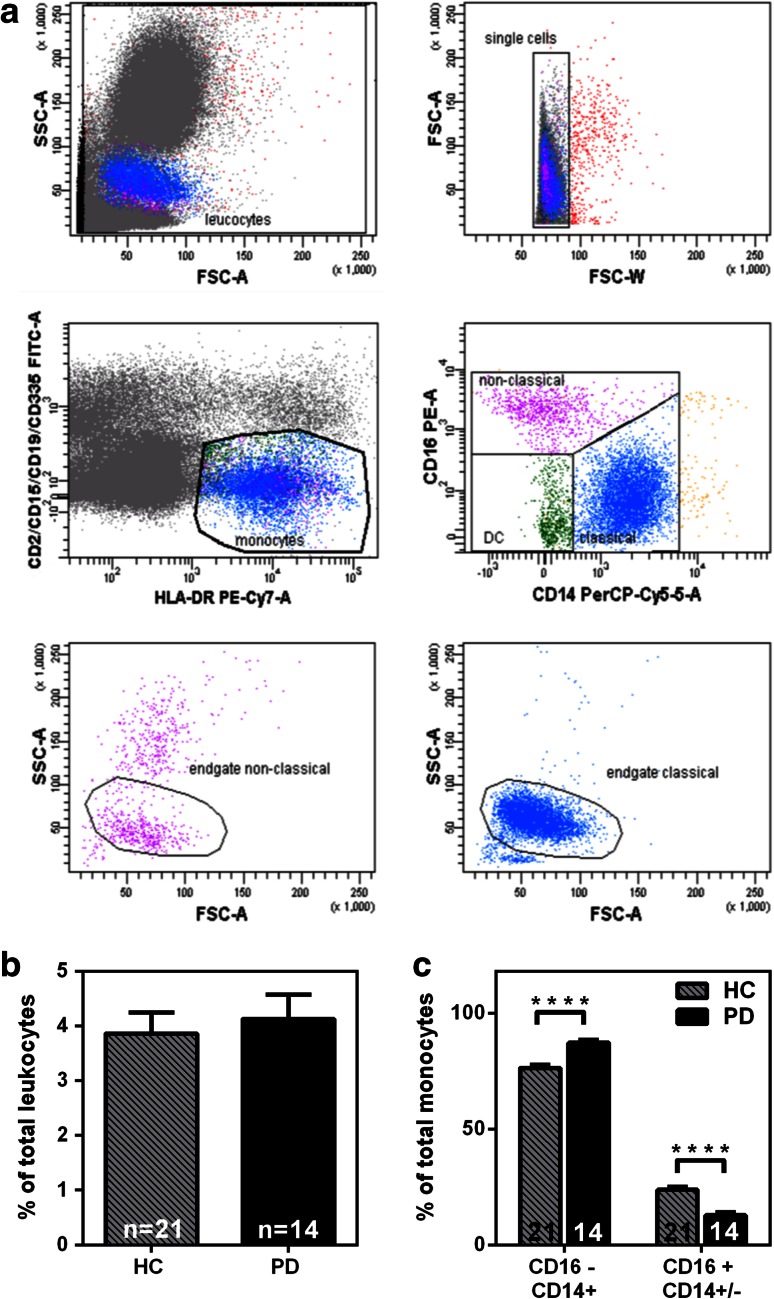
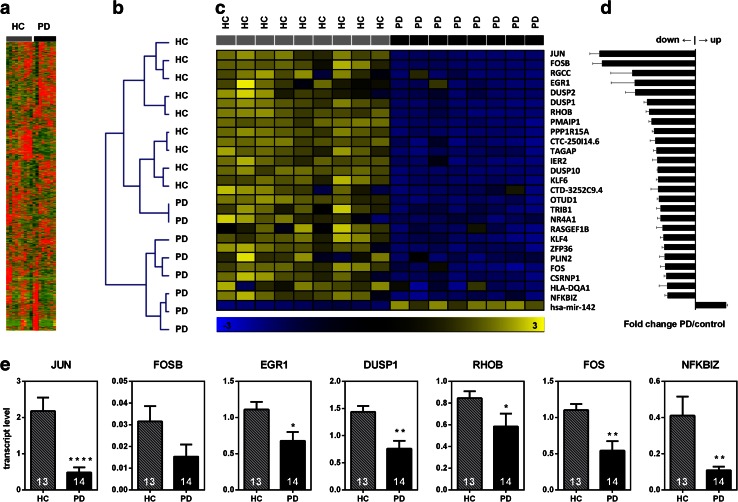
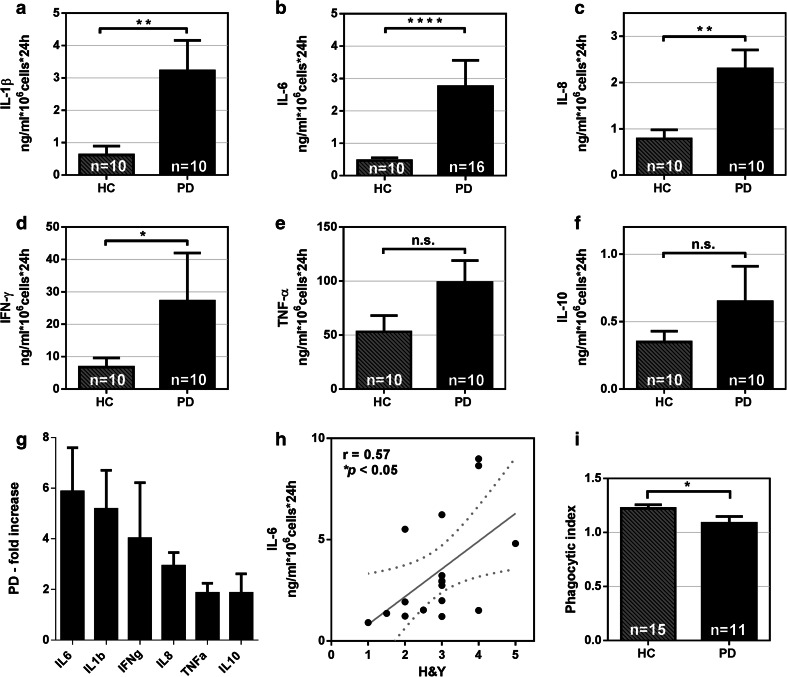
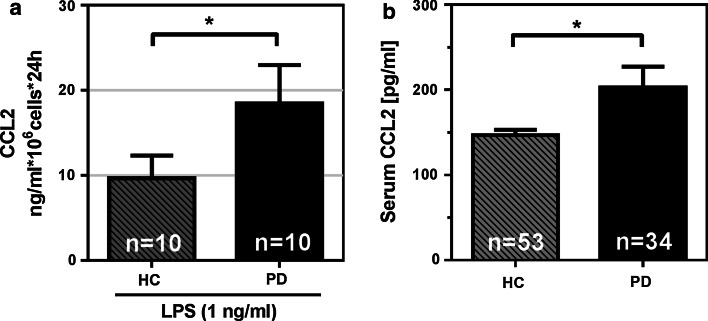
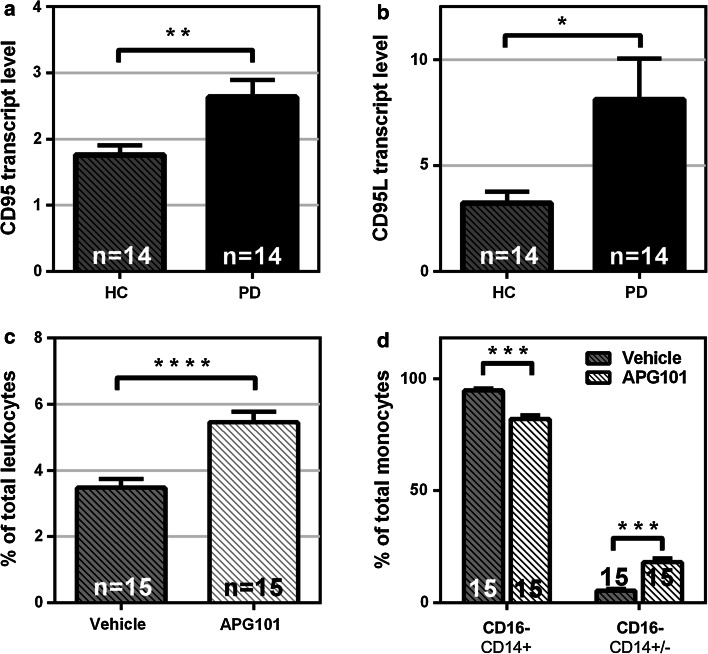
Despite extensive effort on studying inflammatory processes in the CNS of Parkinson's disease (PD) patients, implications of peripheral monocytes are still poorly understood. Here, we set out to obtain a comprehensive picture of circulating myeloid cells in PD patients. We applied a human primary monocyte culture system and flow cytometry-based techniques to determine the state of monocytes from PD patients during disease. We found that the classical monocytes are enriched in the blood of PD patients along with an increase in the monocyte-recruiting chemoattractant protein CCL2. Moreover, we found that monocytes from PD patients display a pathological hyperactivity in response to LPS stimulation that correlates with disease severity. Inflammatory pre-conditioning was also reflected on the transcriptome in PD monocytes using next-generation sequencing. Further, we identified the CD95/CD95L as a key regulator for the PD-associated alteration of circulating monocytes. Pharmacological neutralization of CD95L reverses the dysregulation of monocytic subpopulations in favor of non-classical monocytes. Our results suggest that PD monocytes are in an inflammatory predisposition responding with hyperactivation to a "second hit". These results provide the first direct evidence that circulating human peripheral blood monocytes are altered in terms of their function and composition in PD patients. This study provides insights into monocyte biology in PD and establishes a basis for future studies on peripheral inflammation.
Overview
The claims and statistics of this paper haven’t been checked yet.
Run the check — free, no account needed. It reads the open-access text and checks the sources it cites.
Integrity signals
Registry
Cites
Statistics
Figures
Verification
Claims the paper makes
The claims and statistics of this paper haven’t been checked yet.
Run the check — free, no account needed. It reads the open-access text and checks the sources it cites.
Claims other papers make about this one
Each is checked against this paper’s own text: does it say what the citing paper says it does?
In the citing paper
“However, it has now been well demonstrated in models of severe trauma or advanced disease states that BM-derived monocytes traffic to and influence inflammatory signaling in the brain (Zhou et al, 2009;Grozdanov et al, 2014).”
From Repeated Social Defeat, Neuroinflammation, and Behavior: Monocytes Carry the Signal (2017) · cites this paper as Grozdanov et al, 2014
Self-check
Percentages, sums and reported differences re-computed from the paper’s own numbers.
The self-check needs the paper’s full text.
Citations
Cites
Parkinsonism: onset, progression, and mortality
Hoehn, M. M., & Yahr, M. D. (1967) · Neurology · doi:10.1212/wnl.17.5.427 · Cited by 12,107 · cited 1×
“To assess the progression of PD in patients, the modified Hoehn & Yahr staging system was used [29].”
MethodBlood Monocytes Consist of Two Principal Subsets with Distinct Migratory Properties
Geissmann, F., Jung, S., & Littman, D. R. (2003) · Immunity · doi:10.1016/s1074-7613(03)00174-2 · Cited by 3,504
Identification of a unique TGF-β–dependent molecular and functional signature in microglia
Butovsky, O., Jedrychowski, M. P., Moore, C. S., Cialic, R., Lanser, A. J., Gabriely, G., Koeglsperger, T., Dake, B., Wu, P. M., Doykan, C. E., et al. (2014) · Nature Neuroscience · doi:10.1038/nn.3599 · Cited by 2,543
Nomenclature of monocytes and dendritic cells in blood
Ziegler‐Heitbrock, L., Ancuța, P., Crowe, S. M., Dalod, M., Grau, V., Hart, D. N. J., Leenen, P. J. M., Liu, Y.-J., MacPherson, G. G., Randolph, G. J., et al. (2010) · Blood · doi:10.1182/blood-2010-02-258558 · Cited by 2,436
Genesis: cluster analysis of microarray data
Sturn, A., Quackenbush, J., & Trajanoski, Z. (2002) · Bioinformatics · doi:10.1093/bioinformatics/18.1.207 · Cited by 1,761
Blood Monocytes: Development, Heterogeneity, and Relationship with Dendritic Cells
Auffray, C., Sieweke, M. H., & Geissmann, F. (2009) · Annual Review of Immunology · doi:10.1146/annurev.immunol.021908.132557 · Cited by 1,745
Serbina, N. V., & Pamer, E. G. (2006) · Nature Immunology · doi:10.1038/ni1309 · Cited by 1,658
Human CD14dim Monocytes Patrol and Sense Nucleic Acids and Viruses via TLR7 and TLR8 Receptors
Cros, J. F., Cagnard, N., Woollard, K. J., Patey, N., Zhang, S., Sénéchal, B., Puel, A., Biswas, S. K., Moshous, D., Pïcard, C., et al. (2010) · Immunity · doi:10.1016/j.immuni.2010.08.012 · Cited by 1,320
Brochard, V., Combadière, B., Prigent, A., Laouar, Y., Perrin, A., Beray-Berthat, V., Bonduelle, O., Alvarez-Fischer, D., Callebert, J., Launay, J.-M., et al. (2008) · Journal of Clinical Investigation · doi:10.1172/jci36470 · Cited by 1,172
Infiltrating monocytes trigger EAE progression, but do not contribute to the resident microglia pool
Ajami, B., Bennett, J. L., Krieger, C., McNagny, K. M., & Rossi, F. M. V. (2011) · Nature Neuroscience · doi:10.1038/nn.2887 · Cited by 1,061
D'Mello, C., Le, T., & Swain, M. G. (2009) · The Journal of Neuroscience · doi:10.1523/jneurosci.3567-08.2009 · Cited by 675
Cunningham, C., Campion, S., Lunnon, K., Murray, C. L., Woods, J. F. C., Deacon, R. M. J., Rawlins, J. N. P., & Perry, V. H. (2009) · Biological Psychiatry · doi:10.1016/j.biopsych.2008.07.024 · Cited by 584
Peripheral cytokines profile in parkinson’s disease
Reale, M., Iarlori, C., Thomas, A., Gambi, D., Perfetti, B., Di Nicola, M., & Onofrj, M. (2009) · Brain, Behavior, and Immunity · doi:10.1016/j.bbi.2008.07.003 · Cited by 547
Modulating inflammatory monocytes with a unique microRNA gene signature ameliorates murine ALS
Butovsky, O., Siddiqui, S., Gabriely, G., Lanser, A. J., Dake, B., Murugaiyan, G., Doykan, C. E., Wu, P. M., Gali, R. R., Iyer, L. K., et al. (2012) · Journal of Clinical Investigation · doi:10.1172/jci62636 · Cited by 481
Mildner, A., Mack, M., Schmidt, H., Brück, W., Djukic, M., Zabel, M. D., Hille, A., Priller, J., & Prinz, M. (2009) · Brain · doi:10.1093/brain/awp144 · Cited by 445
Harms, A. S., Cao, S., Rowse, A. L., Thome, A. D., Li, X., Mangieri, L. R., Cron, R. Q., Shacka, J. J., Raman, C., & Standaert, D. G. (2013) · Journal of Neuroscience · doi:10.1523/jneurosci.5610-12.2013 · Cited by 406
Gao, H.-M., Zhang, F., Zhou, H., Kam, W., Wilson, B., & Hong, J.-S. (2011) · Environmental Health Perspectives · doi:10.1289/ehp.1003013 · Cited by 355 · cited 1×
“[22], who showed that LPS-induced inflammation and alpha-synuclein pathology act synergistically and potentiate neurodegeneration in a genetic mouse model of PD.”
BackgroundPeripheral Inflammatory Biomarkers and Risk of Parkinson's Disease
Chen, H., O'Reilly, E. J., Schwarzschild, M. A., & Ascherio, A. (2007) · American Journal of Epidemiology · doi:10.1093/aje/kwm260 · Cited by 325
Fas ligand/Fas system in the brain: regulator of immune and apoptotic responses
Choi, C., & Benveniste, E. N. (2004) · Brain Research Reviews · doi:10.1016/j.brainresrev.2003.08.007 · Cited by 270
Monocytes: subsets, origins, fates and functions
Yona, S., & Jung, S. (2009) · Current Opinion in Hematology · doi:10.1097/moh.0b013e3283324f80 · Cited by 267
Appel, S. H., Beers, D. R., & Henkel, J. S. (2010) · Trends in Immunology · doi:10.1016/j.it.2009.09.003 · Cited by 256
Nguyen, M. D., D'Aigle, T., Gowing, G., Julien, J.-P., & Rivest, S. (2004) · The Journal of Neuroscience · doi:10.1523/jneurosci.4786-03.2004 · Cited by 248
Djukic, M. (2006) · Brain · doi:10.1093/brain/awl206 · Cited by 195
Association of Parkinson Disease with Structural and Regulatory Variants in the HLA Region
Wissemann, W. T., Hill-Burns, E. M., Zabetian, C. P., Factor, S. A., Patsopoulos, N., Hoglund, B., Holcomb, C., Donahue, R. J., Thomson, G., Erlich, H., et al. (2013) · The American Journal of Human Genetics · doi:10.1016/j.ajhg.2013.10.009 · Cited by 189
Park, D. R., Thomsen, A. R., Frevert, C. W., Pham, U., Skerrett, S. J., Kiener, P. A., & Liles, W. C. (2003) · The Journal of Immunology · doi:10.4049/jimmunol.170.12.6209 · Cited by 176
The role of inflammation in sporadic and familial Parkinson’s disease
Deleidi, M., & Gasser, T. (2013) · Cellular and Molecular Life Sciences · doi:10.1007/s00018-013-1352-y · Cited by 169
Stypuła, G., Radek, M., Stepien, H., Żylińska, K., & Pawlikowski, M. (1996) · NeuroImmunoModulation · doi:10.1159/000097237 · Cited by 134
Letellier, E., Kumar, S., Sancho-Martinez, I., Krauth, S. J., Funke-Kaiser, A., Laudenklos, S., Konecki, K., Klußmann, S., Corsini, N. S., Kleber, S., et al. (2010) · Immunity · doi:10.1016/j.immuni.2010.01.011 · Cited by 127
Hayley, S. P., Crocker, S. J., Smith, P. D., Shree, T., Jackson-Lewis, V. R., Przedborski, S., Mount, M., Slack, R. S., Anisman, H., & Park, D. S. (2004) · Journal of Neuroscience · doi:10.1523/jneurosci.4564-03.2004 · Cited by 125
Association between Parkinson's disease and the HLA‐DRB1 locus
Ahmed, I., Tamouza, R., Delord, M., Krishnamoorthy, R., Tzourio, C., Mulot, C., Nacfer, M., Lambert, J., Beaune, P. H., Laurent‐Puig, P., et al. (2012) · Movement Disorders · doi:10.1002/mds.25035 · Cited by 124
Cultured rat microglia express functional β-chemokine receptors
Boddeke, E., Meigel, I., Frentzel, S., Gourmala, N. G., Harrison, J. K., Buttini, M., Spleiss, O., & Gebicke‐Haerter, P. J. (1999) · Journal of Neuroimmunology · doi:10.1016/s0165-5728(99)00096-x · Cited by 120
Immunologic diseases, anti-inflammatory drugs, and Parkinson disease: A case-control study
Bower, J. H., Maraganore, D. M., Peterson, B. J., Ahlskog, J. E., & Rocca, W. A. (2006) · Neurology · doi:10.1212/01.wnl.0000227906.99570.cc · Cited by 113
Gardai, S. J., Mao, W., Schüle, B., Babcock, M., Schoebel, S., Lorenzana, C., Alexander, J., Kim, S., Glick, H., Hilton, K., et al. (2013) · PLoS ONE · doi:10.1371/journal.pone.0071634 · Cited by 107
Solomon, J. N., Lewis, C. B., Ajami, B., Corbel, S. Y., Rossi, F. M. V., & Krieger, C. (2006) · Glia · doi:10.1002/glia.20331 · Cited by 105
Depboylu, C., Stricker, S., Ghobril, J.-P., Oertel, W. H., Priller, J., & Höglinger, G. U. (2012) · Experimental Neurology · doi:10.1016/j.expneurol.2012.08.020 · Cited by 104
Characterization of peripheral hematopoietic stem cells and monocytes in Parkinson's disease
Funk, N., Wieghofer, P., Grimm, S., Schäfer, R., Bühring, H., Gasser, T., & Biskup, S. (2013) · Movement Disorders · doi:10.1002/mds.25300 · Cited by 81
Hasegawa, Y., Inagaki, T., Sawada, M., & Suzumura, A. (2000) · Acta Neurologica Scandinavica · doi:10.1034/j.1600-0404.2000.101003159.x · Cited by 78
Association of Parkinson's disease with infections and occupational exposure to possible vectors
Harris, M. A., Tsui, J. K. C., Marion, S. A., Shen, H., & Teschke, K. (2012) · Movement Disorders · doi:10.1002/mds.25077 · Cited by 70
Toward a functional characterization of blood monocytes
Saha, P., & Geissmann, F. (2010) · Immunology and Cell Biology · doi:10.1038/icb.2010.130 · Cited by 68
Defective Fas expression exacerbates neurotoxicity in a model of Parkinson's disease
Landau, A. M., Luk, K. C., Jones, M.-L., Siegrist‐Johnstone, R., Young, Y. K., Kouassi, É., Rymar, V. V., Dagher, A., Sadikot, A. F., & Desbarats, J. (2005) · The Journal of Experimental Medicine · doi:10.1084/jem.20050163 · Cited by 50
Tuettenberg, J., Seiz, M., Debatin, K., Hollburg, W., von Staden, M., Thiemann, M., Hareng, B., Fricke, H., & Kunz, C. (2012) · International Immunopharmacology · doi:10.1016/j.intimp.2012.03.004 · Cited by 38
Czeslick, E. G., Simm, A., Grond, S., Silber, R., & Sablotzki, A. (2003) · European Journal of Clinical Investigation · doi:10.1046/j.1365-2362.2003.01241.x · Cited by 37
DJ-1 inhibits TRAIL-induced apoptosis by blocking pro-caspase-8 recruitment to FADD
Fu, K., Ren, H., Wang, Y., Fei, E., Wang, H., & Wang, G. (2011) · Oncogene · doi:10.1038/onc.2011.315 · Cited by 32
CD95/Fas in the Brain—Not Just a Killer
Beier, C. P., & Schulz, J. B. (2009) · Cell stem cell · doi:10.1016/j.stem.2009.07.008 · Cited by 13
Cited by
Sorted by citations
Inflammation and immune dysfunction in Parkinson disease
Tansey, M. G., Wallings, R. L., Houser, M. C., Herrick, M. K., Keating, C. E., & Joers, V. (2022) · Nature Reviews Immunology · doi:10.1038/s41577-022-00684-6 · Cited by 1,382
MCP-1: Function, regulation, and involvement in disease
Singh, S., Anshita, D., & Ravichandiran, V. (2021) · International Immunopharmacology · doi:10.1016/j.intimp.2021.107598 · Cited by 936
Genome-wide pleiotropy between Parkinson disease and autoimmune diseases
Witoelar, A., Jansen, I. E., Wang, Y., Desikan, R. S., Gibbs, J. R., Blauwendraat, C., Thompson, W. K., Hernandez, D. G., Djurovic, S., Schork, A. J., et al. (2017) · JAMA Neurology · doi:10.1001/jamaneurol.2017.0469 · Cited by 352
Williams‐Gray, C. H., Wijeyekoon, R., Yarnall, A. J., Lawson, R. A., Breen, D. P., Evans, J., Cummins, G. A., Duncan, G. W., Khoo, T. K., Burn, D. J., et al. (2016) · Movement Disorders · doi:10.1002/mds.26563 · Cited by 310
Repeated Social Defeat, Neuroinflammation, and Behavior: Monocytes Carry the Signal
Weber, M. D., Godbout, J. P., & Sheridan, J. F. (2017) · Neuropsychopharmacology · doi:10.1038/npp.2016.102 · Cited by 283
Metadata
- Authors
- Grozdanov, V., Bliederhaeuser, C., Ruf, W. P., Roth, V., Fundel-Clemens, K., Zondler, L., Brenner, D., Martin-Villalba, A., Hengerer, B., Kassubek, J., Ludolph, A. C., Weishaupt, J. H., & Danzer, K. M.
- Affiliations
- Universität Ulm (DE)
- Boehringer Ingelheim (Germany) (DE)
- Corresponding author
- Danzer, Karin M.
- ORCID
- Venue
- Acta Neuropathologica
- Published
- 2014-10-05
- Volume
- 128
- Issue
- 5
- Pages
- 651-663
- ISSN
- 0001-6322 (ISSN-L)
- 1432-0533
- PMC
- PMC4201759
- OpenAlex
- W2003612310
- Cited by
- 295
- References
- 44
- Citations by year
- 2026: 23 · 2025: 31 · 2024: 38 · 2023: 23 · 2022: 37 · 2021: 40 · 2020: 26 · 2019: 19 · 2018: 18 · 2017: 18 · 2016: 13 · 2015: 9
- FWCI
- 8.69
- Type
- journal article
- Language
- en
- Open access
- hybrid
- doi.org
- Locations
- Acta Neuropathologica (publishedVersion, cc-by)
- PubMed Central (publishedVersion, cc-by)
- PubMed (publishedVersion)
- Funders
- Fondation Charcot
- Universität Ulm
- Medizinische Fakultät, Universität Ulm
- Topics
- Health Sciences › Medicine › Clinical Neurology › Parkinson's Disease Mechanisms and Treatments
- Life Sciences › Neuroscience › Neurology › Neuroinflammation and Neurodegeneration Mechanisms
- Life Sciences › Biochemistry, Genetics and Molecular Biology › Molecular Biology › Nuclear Receptors and Signaling
- Keywords
- Parkinson's disease, peripheral blood monocytes, classical monocytes, MCP-1, lipopolysaccharide response, non-classical monocytes, peripheral inflammation, monocyte transcriptome, disease severity
- MeSH terms
- Cells, Cultured, Culture Media, Female, Flow Cytometry, Humans, Inflammation, Lipopolysaccharides, Male, Monocytes, Parkinson Disease, Phagocytosis, Psychiatric Status Rating Scales, RNA, Messenger, Cohort Studies, Antigens, CD, Interleukin-6, Cytokines, Chemokine CCL2
About these checks
Registry, retraction, Cites and statistics results are computed, not judged, with one exception: a printed reference that no index lists is read once by a model before it counts as a citation error. Claims are extracted by a model and kept only when their quote appears verbatim in the text; each cited source is then checked, with a model’s help, for whether it says what the claim relies on. Those verdicts can be wrong — read the claim’s quote and the cited source before relying on one.
Statistics and arithmetic are recomputed, not judged.
Confidence bands are shown only for fields calibrated on our annotated test set. None is calibrated yet, so no band is shown.
What counts as a claim ›How we measure confidence ›How we check this ›
Are you an author, or do you see a problem with this page? Request a review
