Student or educator? Sign up with your school email and get 6 months of Pro free.
Cited by 107

The DOI matches its Crossref record; 14 of the 14 references it cites were found in a registry or an index.

TIA1 regulates the generation and response to toxic tau oligomers

Jiang, Lulu, Ash, Peter E. A., Maziuk, Brandon F., Ballance, Heather I., Boudeau, Samantha, Abdullatif, Ali Al, Orlando, Marcello, Petrucelli, Leonard, Ikezu, Tsuneya, Wolozin, Benjamin·2019·Acta Neuropathologica

Overview

The claims and statistics of this paper haven’t been checked yet.

Run the check — free, no account needed. It reads the open-access text and checks the sources it cites.

A few free checks a day · papers already verified open instantly · results are public

Integrity signals

Registry

Crossref · 10.1007/s00401-018-1937-5

Cites

14 of 14 references verified0 citation errors · 0 not checkable

Statistics

Figures

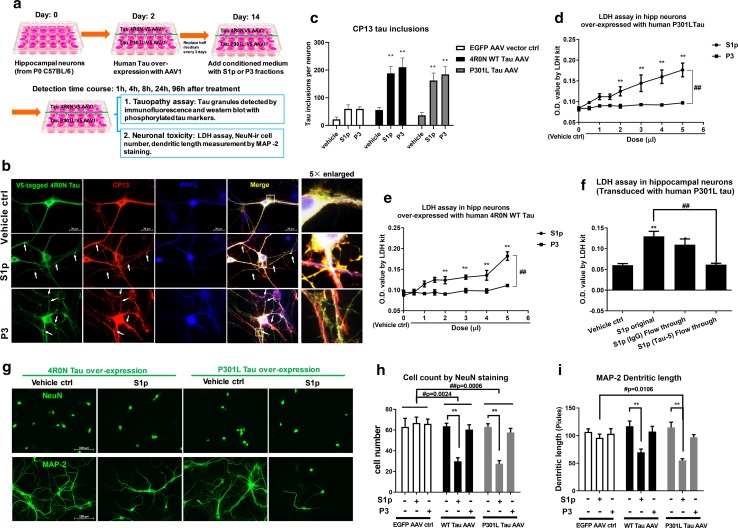
Fig. 1 Oligomeric tau fractions trigger neurotoxicity. a Diagram of experiment design using C57BL/6 primary hippocampal cultures, including plating, transduction, treatment and harvest in time course. b Representative images showed the co-localization (yellow) of CP13 (red) marked phosphorylated tau with V-5 (green) tagged tau at 24 h after S1p or P3 fraction treatment. Scale bar 20 µm. c quantitative analysis of tau aggregation induced by the S1P and P3 fractions. The number of tau inclusions was quantified by Image J. Data expressed as average number of tau inclusions per neuron. **p < 0.001 compared to their corresponding vehicle control in EGFP-AAV vector, WT tau and P301L tau over-expression groups. d–e The LDH assay showed dose-dependent toxicity in hippocampal neurons over-expressed human 4R0 N tau or P301L upon S1p treatment. Toxicity was not elicited by treatment with P3 fractions, ##p < 0.001 in the linear comparison of S1p and P3, **p < 0.001 compared to the corresponsive vehicle control. f The LDH assay of neurons treated with vehicle or S1p fractions ± immuno-depletion of tau, **p = 0.0011, *p = 0.0148 compared to vehicle control, ##p = 0.0014 compared to original S1p treated neurons. g Representative images showing the cell loss (NeuN) and shorter dendritic length (MAP-2) at 96 h after S1p treatment. Scale bar 100 µm. h Quantification of NeuN-positive cell number by image J. Cell number equals total count per 5 images each well. **p < 0.001 compared to corresponsive vehicle control. WT tau over-expression VS EGFP vector control, #p = 0.0024; P301L tau over-expression VS EGFP vector control, ##p = 0.0006. i Measurement of dendritic length at 96 h after S1p or P3 treatment. **p < 0.001 compared to corresponsive vehicle control. In S1p treated groups, cells of P301L tau over-expression VS EGFP vector control, #p = 0.0106. Data are represented as mean ± SEM. Independent experiments were repeated at least 4 times with triplicate wells each time
Fig. 1 Oligomeric tau fractions trigger neurotoxicity. a Diagram of experiment design using C57BL/6 primary hippocampal cultures, including plating, transduction, treatment and harvest in time course. b Representative images showed the co-localization (yellow) of CP13 (red) marked phosphorylated tau with V-5 (green) tagged tau at 24 h after S1p or P3 fraction treatment. Scale bar 20 µm. c quantitative analysis of tau aggregation induced by the S1P and P3 fractions. The number of tau inclusions was quantified by Image J. Data expressed as average number of tau inclusions per neuron. **p < 0.001 compared to their corresponding vehicle control in EGFP-AAV vector, WT tau and P301L tau over-expression groups. d–e The LDH assay showed dose-dependent toxicity in hippocampal neurons over-expressed human 4R0 N tau or P301L upon S1p treatment. Toxicity was not elicited by treatment with P3 fractions, ##p < 0.001 in the linear comparison of S1p and P3, **p < 0.001 compared to the corresponsive vehicle control. f The LDH assay of neurons treated with vehicle or S1p fractions ± immuno-depletion of tau, **p = 0.0011, *p = 0.0148 compared to vehicle control, ##p = 0.0014 compared to original S1p treated neurons. g Representative images showing the cell loss (NeuN) and shorter dendritic length (MAP-2) at 96 h after S1p treatment. Scale bar 100 µm. h Quantification of NeuN-positive cell number by image J. Cell number equals total count per 5 images each well. **p < 0.001 compared to corresponsive vehicle control. WT tau over-expression VS EGFP vector control, #p = 0.0024; P301L tau over-expression VS EGFP vector control, ##p = 0.0006. i Measurement of dendritic length at 96 h after S1p or P3 treatment. **p < 0.001 compared to corresponsive vehicle control. In S1p treated groups, cells of P301L tau over-expression VS EGFP vector control, #p = 0.0106. Data are represented as mean ± SEM. Independent experiments were repeated at least 4 times with triplicate wells each timeCC BY · PubMed Central
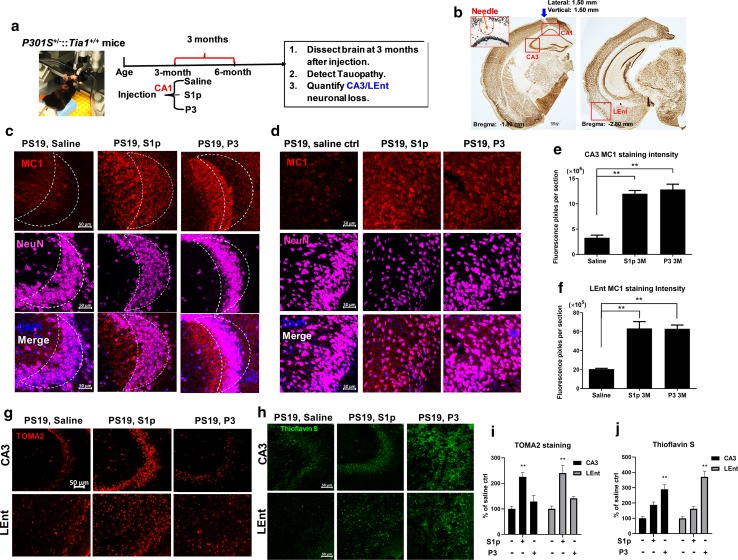
Fig. 2 Propagated oligomeric and fibrillar tau species accumulate in separate neuronal compartments in vivo. a The design for the in vivo tau propagation experiments. The saline ctrl, S1p or P3 fractions were stereotaxically injected into the CA1 region of PS19 mice at 3 months of age. The mice were then aged three more months, and then killed at 6 months, whereupon the brains were harvested to assess tauopathy and neuronal loss. b IHC of DAB stained brain sections showing the position of injection site (inset coordinates: 1.80 mm posterior and 1.50 mm lateral to bregma; 1.50 mm ventral to cortical surface). The red boxes highlight the CA1 injection site, as well as the sites used for analysis, which include the neighboring CA3 site and the lateral entorhinal cortex (LEnt, bregma − 2.80 mm), a remote projection site. Shown are coronal sections at two z-coordinates (corresponding to neurons that were labelled for tauopathy and neurotoxicity). Scale bar 300 µm. c Images showing the S1p- and P3-induced hyperphosphorylated tau inclusions in CA3: MC1 (red) staining, neuronal marker, NeuN (violet), and DAPI (blue). Scale bar 50 µm. d Images showing the S1p- and P3-induced hyperphosphorylated tau inclusions in LEnt with detection of MC1 (red), NeuN (violet) and DAPI (blue). Scale bar 50 µm. e Quantification of the MC1 fluorescence intensity in the CA3. N = 4 (average of two brain slice from each mouse), saline vs S1p, **p < 0.001; saline vs P3, **p < 0.001. No difference observed between S1p and P3, p = 0.8467. f Quantification of the MC1 fluorescence intensity in the LEnt. N = 4 (average of two brain slice from each mouse), saline vs S1p, **p < 0.001; saline vs P3, **p < 0.001. No difference between S1p and P3, p = 0.9979. g Representative images of TOMA2 (labeling oligomeric tau) staining detect tau oligomers’ accumulation in CA3 and LEnt after S1p or P3 injection. h Representative images of thioflavin S staining in CA3 and LEnt detect tau fibrils accumulation after S1p or P3 injection. i Quantitative analysis of TOMA2 staining in CA3 and LEnt after S1p or P3 injection, respectively. **p < 0.001 compared to saline control. j Quantitative analysis of thioflavin S staining in CA3 and LEnt after S1p or P3 injection, respectively. **p < 0.001 compared to saline control. Data are represented as mean ± SEM
Fig. 2 Propagated oligomeric and fibrillar tau species accumulate in separate neuronal compartments in vivo. a The design for the in vivo tau propagation experiments. The saline ctrl, S1p or P3 fractions were stereotaxically injected into the CA1 region of PS19 mice at 3 months of age. The mice were then aged three more months, and then killed at 6 months, whereupon the brains were harvested to assess tauopathy and neuronal loss. b IHC of DAB stained brain sections showing the position of injection site (inset coordinates: 1.80 mm posterior and 1.50 mm lateral to bregma; 1.50 mm ventral to cortical surface). The red boxes highlight the CA1 injection site, as well as the sites used for analysis, which include the neighboring CA3 site and the lateral entorhinal cortex (LEnt, bregma − 2.80 mm), a remote projection site. Shown are coronal sections at two z-coordinates (corresponding to neurons that were labelled for tauopathy and neurotoxicity). Scale bar 300 µm. c Images showing the S1p- and P3-induced hyperphosphorylated tau inclusions in CA3: MC1 (red) staining, neuronal marker, NeuN (violet), and DAPI (blue). Scale bar 50 µm. d Images showing the S1p- and P3-induced hyperphosphorylated tau inclusions in LEnt with detection of MC1 (red), NeuN (violet) and DAPI (blue). Scale bar 50 µm. e Quantification of the MC1 fluorescence intensity in the CA3. N = 4 (average of two brain slice from each mouse), saline vs S1p, **p < 0.001; saline vs P3, **p < 0.001. No difference observed between S1p and P3, p = 0.8467. f Quantification of the MC1 fluorescence intensity in the LEnt. N = 4 (average of two brain slice from each mouse), saline vs S1p, **p < 0.001; saline vs P3, **p < 0.001. No difference between S1p and P3, p = 0.9979. g Representative images of TOMA2 (labeling oligomeric tau) staining detect tau oligomers’ accumulation in CA3 and LEnt after S1p or P3 injection. h Representative images of thioflavin S staining in CA3 and LEnt detect tau fibrils accumulation after S1p or P3 injection. i Quantitative analysis of TOMA2 staining in CA3 and LEnt after S1p or P3 injection, respectively. **p < 0.001 compared to saline control. j Quantitative analysis of thioflavin S staining in CA3 and LEnt after S1p or P3 injection, respectively. **p < 0.001 compared to saline control. Data are represented as mean ± SEMCC BY · PubMed Central
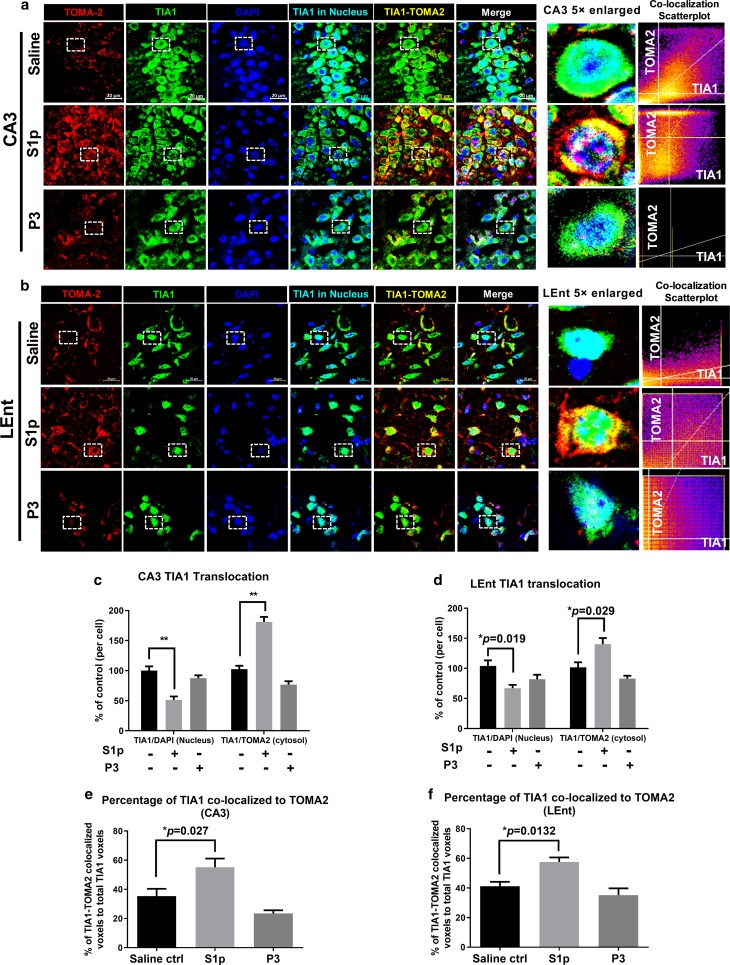
Fig. 3 Oligomeric Tau co-localized with TIA1 positive granules in soma of neurons. a–b Representative images of CA3 (a) and LEnt b for oligomeric tau marker TOMA2 (red) staining overlapped with TIA1 (green) and DAPI (blue) at 3 months after injection. Scale bar 20 µm. The nucleus TIA1 was masked by DAPI (light blue) and the cytosolic TIA1 co-localized with oligomer tau was masked by TOMA2 (yellow). The 5 × enlarged single cell images showed the localization of TIA1 in nucleus (light blue) or cytosol (green or yellow). And the co-localization intensity of TIA1 to TOMA2 was highlighted by scatterplot. c–d Translocation of TIA1 from nucleus to cytosol in neurons of CA3 c and LEnt d was quantified by DAPI masked TIA1 in nucleus and TOMA2 masked TIA1 in cytosol. The number of colocalized voxels of TIA1 to DAPI or TIA1 to TOMA2 in each neuron of saline group was normalized into 100%, and comparison made between S1p- or P3-treated animals to Saline. In CA3, **p < 0.001 S1p compared to saline. In LEnt, *p = 0.019 and *p = 0.029 comparing S1p-treated animals to saline group of TIA1-DAPI co-localization and TIA1-TOMA2 co-localization, respectively. e–f Quantification for the percentage of TIA1 that co-localized with TOMA2 to its total voxels, in CA3 neurons e and LEnt neurons f respectively. S1p compared to saline, *p = 0.027 in CA3, *p = 0.0132 in LEnt. Analysis of TIA1-DAPI or TIA1-TOMA2 co-localization was by Image J Fiji coloc 2 plugin. N = 15 (15 neurons from 3 sections of 3 mice). Data are represented as mean ± SEM
Fig. 3 Oligomeric Tau co-localized with TIA1 positive granules in soma of neurons. a–b Representative images of CA3 (a) and LEnt b for oligomeric tau marker TOMA2 (red) staining overlapped with TIA1 (green) and DAPI (blue) at 3 months after injection. Scale bar 20 µm. The nucleus TIA1 was masked by DAPI (light blue) and the cytosolic TIA1 co-localized with oligomer tau was masked by TOMA2 (yellow). The 5 × enlarged single cell images showed the localization of TIA1 in nucleus (light blue) or cytosol (green or yellow). And the co-localization intensity of TIA1 to TOMA2 was highlighted by scatterplot. c–d Translocation of TIA1 from nucleus to cytosol in neurons of CA3 c and LEnt d was quantified by DAPI masked TIA1 in nucleus and TOMA2 masked TIA1 in cytosol. The number of colocalized voxels of TIA1 to DAPI or TIA1 to TOMA2 in each neuron of saline group was normalized into 100%, and comparison made between S1p- or P3-treated animals to Saline. In CA3, **p < 0.001 S1p compared to saline. In LEnt, *p = 0.019 and *p = 0.029 comparing S1p-treated animals to saline group of TIA1-DAPI co-localization and TIA1-TOMA2 co-localization, respectively. e–f Quantification for the percentage of TIA1 that co-localized with TOMA2 to its total voxels, in CA3 neurons e and LEnt neurons f respectively. S1p compared to saline, *p = 0.027 in CA3, *p = 0.0132 in LEnt. Analysis of TIA1-DAPI or TIA1-TOMA2 co-localization was by Image J Fiji coloc 2 plugin. N = 15 (15 neurons from 3 sections of 3 mice). Data are represented as mean ± SEMCC BY · PubMed Central
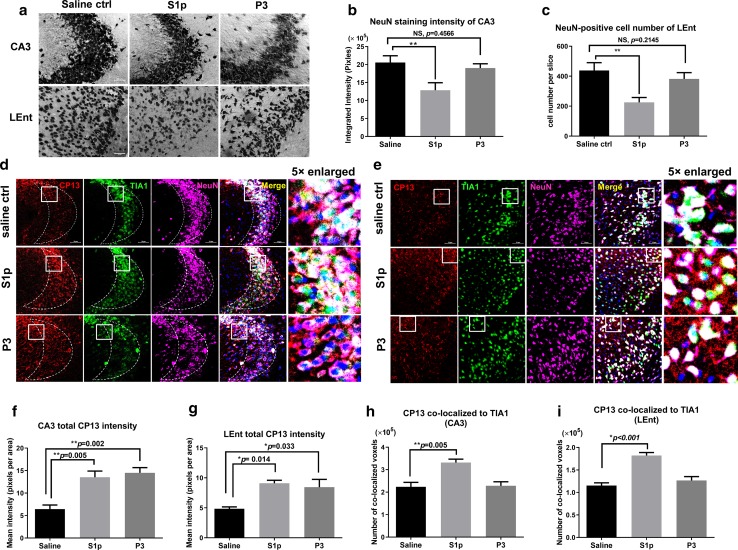
Fig. 4 The propagated oligomeric tau fraction induces neuron loss. a Images show the immunohistochemistry DAB labeling of NeuN-positive neurons in CA3 and LEnt at 3 months after injection. Scale bar 50 µm. b Quantification of NeuN staining intensity of CA3 by Image J. N = 4 (average pixels of two sections from each mouse), **p = 0.0004. No difference observed between P3 and saline, p = 0.4566. c Cell count of NeuN-positive neurons in LEnt by Image J automatic count. N = 4 (average number of two sections from each mouse), **p = 0.0002. No difference observed between P3 and saline, p = 0.2145. d-–e Images represent the CP13 (red) marked phosphorylated tau co-localization (yellow) with RBP TIA1 (green), neuronal marker NeuN (violet) and DAPI (blue) of CA3 d and LEnt e after 3 months of injection, respectively. Scale bar 50 µm. f–g Quantification of CP13 staining intensity in CA3 f and LEnt g. Data showed by the mean pixels per area of each quantified section, N = 4 (average of two sections from each animal). In CA3 f, **p = 0.005 S1p compared to saline and **p = 0.002 P3 compared to saline. In LEnt g, *p = 0.014 S1p compared to saline and *p = 0.033 P3 compared to saline. h–i Quantification for the number of co-localized voxels in CP13-TIA1 overlap (as shown yellow in d, e). Data showed by the total number of co-localized voxels in each quantified brain section, N = 4 (average of two sections from each animal). In CA3 h, **p = 0.005 S1p compared to saline. In LEnt i, *p < 0.001 S1p compared to saline. Multiple comparison test by Tukey’s. Data are represented as mean ± SEM
Fig. 4 The propagated oligomeric tau fraction induces neuron loss. a Images show the immunohistochemistry DAB labeling of NeuN-positive neurons in CA3 and LEnt at 3 months after injection. Scale bar 50 µm. b Quantification of NeuN staining intensity of CA3 by Image J. N = 4 (average pixels of two sections from each mouse), **p = 0.0004. No difference observed between P3 and saline, p = 0.4566. c Cell count of NeuN-positive neurons in LEnt by Image J automatic count. N = 4 (average number of two sections from each mouse), **p = 0.0002. No difference observed between P3 and saline, p = 0.2145. d-–e Images represent the CP13 (red) marked phosphorylated tau co-localization (yellow) with RBP TIA1 (green), neuronal marker NeuN (violet) and DAPI (blue) of CA3 d and LEnt e after 3 months of injection, respectively. Scale bar 50 µm. f–g Quantification of CP13 staining intensity in CA3 f and LEnt g. Data showed by the mean pixels per area of each quantified section, N = 4 (average of two sections from each animal). In CA3 f, **p = 0.005 S1p compared to saline and **p = 0.002 P3 compared to saline. In LEnt g, *p = 0.014 S1p compared to saline and *p = 0.033 P3 compared to saline. h–i Quantification for the number of co-localized voxels in CP13-TIA1 overlap (as shown yellow in d, e). Data showed by the total number of co-localized voxels in each quantified brain section, N = 4 (average of two sections from each animal). In CA3 h, **p = 0.005 S1p compared to saline. In LEnt i, *p < 0.001 S1p compared to saline. Multiple comparison test by Tukey’s. Data are represented as mean ± SEMCC BY · PubMed Central
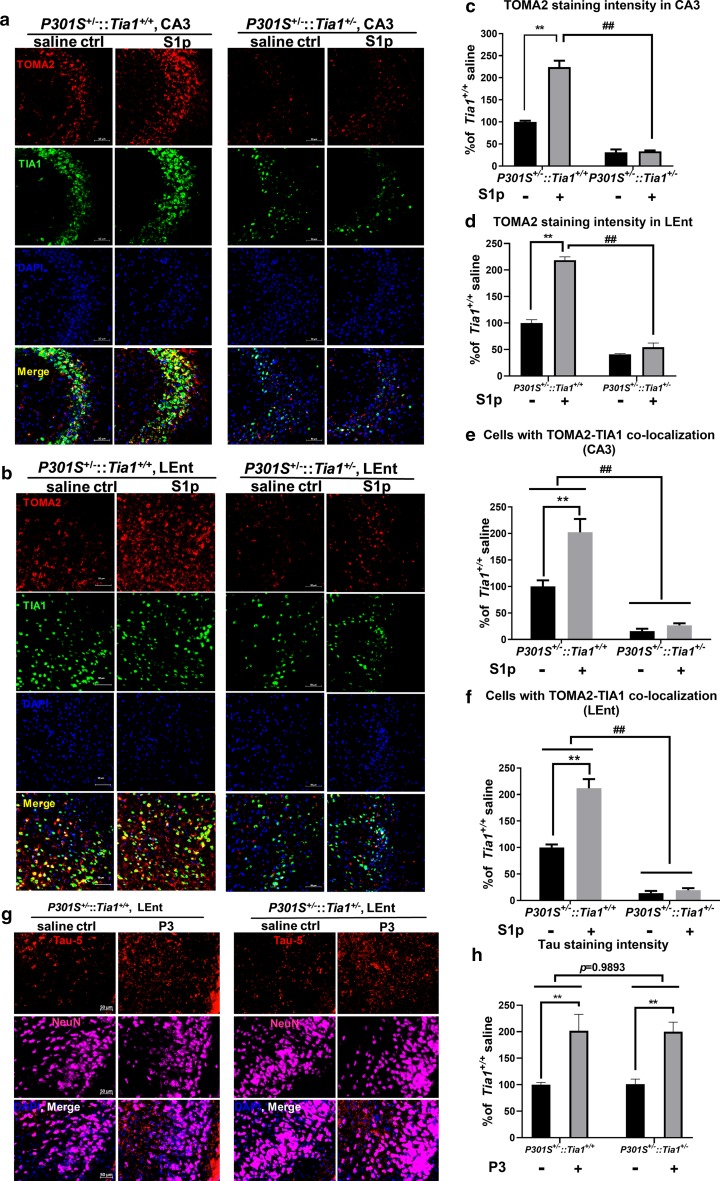
Fig. 5 TIA1 reduction prevents tau propagation from the oligomeric tau fraction. a–b Representative images showing co-localization of TOMA2 (red) and TIA1 (green) in CA3 a and LEnt b of PS19 Tia1+/+ and PS19 Tia1+/− mouse brain, respectively, 3 months after injection in CA1of saline or S1p. With the co-staining, total cell nuclei are stained with DAPI (blue). Scale bar 50 µm. c–d Quantitative analysis of TOMA2 staining intensity of CA3 and LEnt in PS19::Tia1+/+ and PS19::Tia1+/− mice, respectively. In PS19::Tia1+/+ mice, S1p VS saline, **p < 0.001; With S1p injection, PS19::Tia1+/− VS PS19::Tia1+/+, ##p < 0.001. e–f Quantification of cells with TOMA2-TIA1 co-localization. The number of cells with co-localization in the saline group of Tia1 wild-type animals was normalized to 100 for CA3 e and LEnt f, respectively. For CA3 e, in PS19::Tia1+/+ mice, S1p compared to saline, **p < 0.0001; in PS19::Tia1+/− mice, S1p compared to saline, no difference observed, p = 0.6019. Genotype difference ##p < 0.0001. For LEnt f, in PS19::Tia1+/+ mice, S1p compared to saline, **p < 0.0001; in PS19::Tia1+/− mice, S1p compared to saline, no difference was observed, p = 0.6922. Genotype difference ##p < 0.0001. g–h Representative images of tau-5 staining (red) showed that fibrillary tau in P3 fractions propagated into LEnt and elevated tau inclusions equally in P301S+/−:: Tia1+/+ and PS19::Tia1+/− mice. **p < 0.001 compared to saline control within the corresponding genotype. Gene factor p = 0.9893 between P301S+/−:: Tia1+/+ and PS19::Tia1+/− mice. Scale bar 50 µm. Data are represented as mean ± SEM, N = 4 (average of two sections from each animal)
Fig. 5 TIA1 reduction prevents tau propagation from the oligomeric tau fraction. a–b Representative images showing co-localization of TOMA2 (red) and TIA1 (green) in CA3 a and LEnt b of PS19 Tia1+/+ and PS19 Tia1+/− mouse brain, respectively, 3 months after injection in CA1of saline or S1p. With the co-staining, total cell nuclei are stained with DAPI (blue). Scale bar 50 µm. c–d Quantitative analysis of TOMA2 staining intensity of CA3 and LEnt in PS19::Tia1+/+ and PS19::Tia1+/− mice, respectively. In PS19::Tia1+/+ mice, S1p VS saline, **p < 0.001; With S1p injection, PS19::Tia1+/− VS PS19::Tia1+/+, ##p < 0.001. e–f Quantification of cells with TOMA2-TIA1 co-localization. The number of cells with co-localization in the saline group of Tia1 wild-type animals was normalized to 100 for CA3 e and LEnt f, respectively. For CA3 e, in PS19::Tia1+/+ mice, S1p compared to saline, **p < 0.0001; in PS19::Tia1+/− mice, S1p compared to saline, no difference observed, p = 0.6019. Genotype difference ##p < 0.0001. For LEnt f, in PS19::Tia1+/+ mice, S1p compared to saline, **p < 0.0001; in PS19::Tia1+/− mice, S1p compared to saline, no difference was observed, p = 0.6922. Genotype difference ##p < 0.0001. g–h Representative images of tau-5 staining (red) showed that fibrillary tau in P3 fractions propagated into LEnt and elevated tau inclusions equally in P301S+/−:: Tia1+/+ and PS19::Tia1+/− mice. **p < 0.001 compared to saline control within the corresponding genotype. Gene factor p = 0.9893 between P301S+/−:: Tia1+/+ and PS19::Tia1+/− mice. Scale bar 50 µm. Data are represented as mean ± SEM, N = 4 (average of two sections from each animal)CC BY · PubMed Central
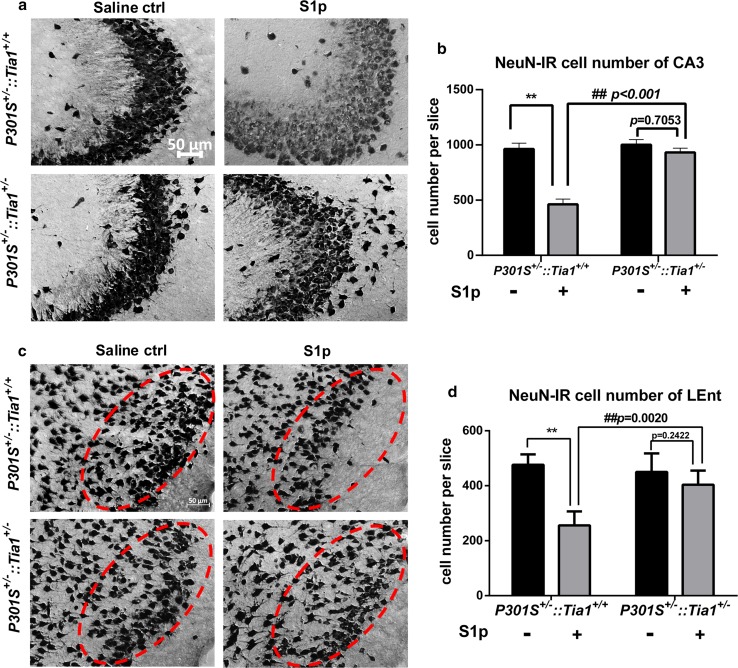
Fig. 6 TIA1 reduction prevents neurotoxicity induced by oligomeric tau propagation. a Representative NeuN-positive images showed the DAB immunohistochemical staining of CA3 at 3 months after injection of saline or S1p in PS19 TIA1 heterozygous mice compared to PS19 TIA1 wild type. Scale bar 50 µm. b Count of NeuN-positive cell number from DAB stained CA3 sections in a, **p < 0.001 compared to corresponsive saline control in PS19::Tia1+/+. In PS19::Tia1+/− mice, S1p compared to saline, p = 0.7053. Under S1p injection, compare PS19::Tia1+/− to PS19::Tia1+/+ mice, ##p < 0.001. c Representative NeuN-positive images showed the DAB immunohistochemical staining of LEnt at 3 months after injection of saline or S1p in PS19 TIA1 heterozygous mice compared to PS19 TIA1 wild type. The red ovals identify similar areas in each tissue section and highlight loss of neurons in the PS19 TIA1 wild-type mouse, with rescue in the PS19 TIA1 heterozygous mouse. Scale bar 50 µm. d Count of NeuN-positive cell number from DAB stained Lent sections in c, **p < 0.0001 compared to corresponsive saline control in PS19::Tia1+/+. In PS19::Tia1+/− mice, S1p compared to saline, p = 0.2422. Under S1p injection, compare PS19::Tia1+/− to PS19::Tia1+/+ mice, ##p = 0.0020. Data are represented as mean ± SEM. N = 4; average cell number of three sections from each mouse was used. Data analysis was by two-way ANOVA, post hoc multiple comparison test by Fisher’s LSD
Fig. 6 TIA1 reduction prevents neurotoxicity induced by oligomeric tau propagation. a Representative NeuN-positive images showed the DAB immunohistochemical staining of CA3 at 3 months after injection of saline or S1p in PS19 TIA1 heterozygous mice compared to PS19 TIA1 wild type. Scale bar 50 µm. b Count of NeuN-positive cell number from DAB stained CA3 sections in a, **p < 0.001 compared to corresponsive saline control in PS19::Tia1+/+. In PS19::Tia1+/− mice, S1p compared to saline, p = 0.7053. Under S1p injection, compare PS19::Tia1+/− to PS19::Tia1+/+ mice, ##p < 0.001. c Representative NeuN-positive images showed the DAB immunohistochemical staining of LEnt at 3 months after injection of saline or S1p in PS19 TIA1 heterozygous mice compared to PS19 TIA1 wild type. The red ovals identify similar areas in each tissue section and highlight loss of neurons in the PS19 TIA1 wild-type mouse, with rescue in the PS19 TIA1 heterozygous mouse. Scale bar 50 µm. d Count of NeuN-positive cell number from DAB stained Lent sections in c, **p < 0.0001 compared to corresponsive saline control in PS19::Tia1+/+. In PS19::Tia1+/− mice, S1p compared to saline, p = 0.2422. Under S1p injection, compare PS19::Tia1+/− to PS19::Tia1+/+ mice, ##p = 0.0020. Data are represented as mean ± SEM. N = 4; average cell number of three sections from each mouse was used. Data analysis was by two-way ANOVA, post hoc multiple comparison test by Fisher’s LSDCC BY · PubMed Central
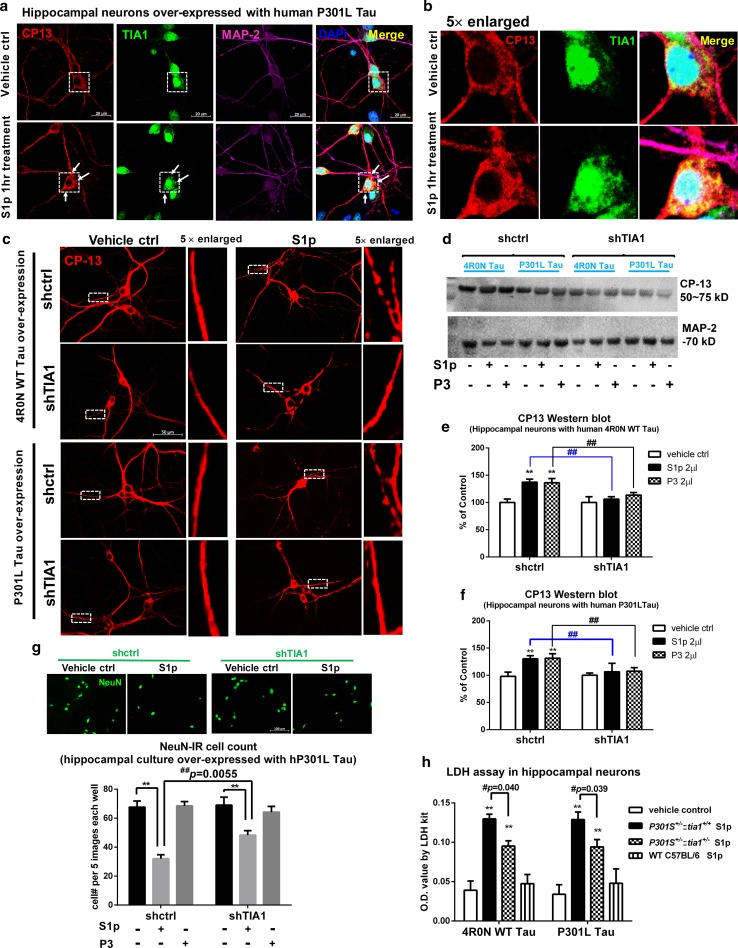
Fig. 7 Silencing of TIA1 expression protects against oligomeric Tau toxicity. a Representative images showing the co-localization of phosphorylated tau inclusions CP13 (red) with TIA1 granules (green) in hippocampal neurons over-expressing human P301L tau, at 1 h after S1p or vehicle treatment. Co-labeled markers are MAP-2 (violet) for neurons and DAPI (blue) for nuclear. Scale bar 20 µm. b To show the translocation of TIA1 from nuclear to cytosol and co-localization with tau inclusions in neuronal soma, high-magnification images were enlarged fivefold from the boxed neurons in a. c CP13 staining representative images show that TIA1 knock down disperses S1p induced bead-like tau granules in synapse and dendrites, creating a more continuous, less consolidated distribution of CP13 positive tau. CP13 staining of hippocampal cultures over-expressing human 4R0 N WT or P301L tau fixed at 24 h after treatment. d TIA1 knockdown prevents the elevation of CP13 phospho-tau from S1p or P3 treatment. Immunoblots of primary neuron lysates expressing either 4R0N WT or P301L tau, knocked down with either shCtrl or shTIA1 and treated for 24 h with S1p or P3 fractions. Phosphorylated tau detected by CP13 and MAP-2 internal control. e Quantification of CP13 immunoblot in cell lysate of hippocampal cultures over-expressing human 4R0 N WT tau, transduced with shTIA1 or shCtrl AAV on day- 4, treated with vehicle control, S1p or P3 on day 14 and harvested at 24 h after treatment. N = 3, in shCtrl, S1p compared to vehicle **p < 0.001, P3 to vehicle **p < 0.001. For S1p treatment, shTIA1 compared to shCtrl, ##p = 0.001. For P3 treatment, shTIA1 compared to shCtrl, ##p = 0.0016. f Quantification of CP13 immunoblot in cell lysate of hippocampal cultures over-expressing human P301L tau, transduced with shTIA1 or shCtrl AAV on day 4, treated with vehicle control, S1p or P3 on day 14 and harvested at 24 h after treatment. N = 3, in shctrl, S1p compared to vehicle **p = 0.007, P3 to vehicle **p = 0.006. For S1p treatment, shTIA1 compared to shCtrl, ##p = 0.006. For P3 treatment, shTIA1 compared to shCtrl, ##p = 0.006. Two-way ANOVA multiple comparison test by Fisher’s LSD. g NeuN-positive neurons in shctrl and shTIA1 cultures after saline or S1p treatment. **p < 0.0001 compared to corresponding control, ##p = 0.0055 compared to S1p group in shctrl cultures. h LDH assay with conditioned medium at 24 h after vehicle or S1p treatment in hippocampal neurons over-expressed with human WT or P301L Tau. The S1p fractions are from three genotypes of 9-month-old brains, including PS19 Tia1+/+, PS19 Tia1+/− and C57BL/6 wild-type mice. N = 4 separate times of experiment (triplicate wells each time). **p < 0.001 compared to corresponsive saline control. In WT tau over-expressed neurons, Tia1+/+ S1p compared to Tia1+/− S1p, #p = 0.0402. In P301L tau over-expressed neurons, Tia1+/+ S1p compared to Tia1+/− S1p, #p = 0.0394. Two-way ANOVA, post hoc multiple comparison test by Fisher’s LSD. Data are represented as mean ± SEM
Fig. 7 Silencing of TIA1 expression protects against oligomeric Tau toxicity. a Representative images showing the co-localization of phosphorylated tau inclusions CP13 (red) with TIA1 granules (green) in hippocampal neurons over-expressing human P301L tau, at 1 h after S1p or vehicle treatment. Co-labeled markers are MAP-2 (violet) for neurons and DAPI (blue) for nuclear. Scale bar 20 µm. b To show the translocation of TIA1 from nuclear to cytosol and co-localization with tau inclusions in neuronal soma, high-magnification images were enlarged fivefold from the boxed neurons in a. c CP13 staining representative images show that TIA1 knock down disperses S1p induced bead-like tau granules in synapse and dendrites, creating a more continuous, less consolidated distribution of CP13 positive tau. CP13 staining of hippocampal cultures over-expressing human 4R0 N WT or P301L tau fixed at 24 h after treatment. d TIA1 knockdown prevents the elevation of CP13 phospho-tau from S1p or P3 treatment. Immunoblots of primary neuron lysates expressing either 4R0N WT or P301L tau, knocked down with either shCtrl or shTIA1 and treated for 24 h with S1p or P3 fractions. Phosphorylated tau detected by CP13 and MAP-2 internal control. e Quantification of CP13 immunoblot in cell lysate of hippocampal cultures over-expressing human 4R0 N WT tau, transduced with shTIA1 or shCtrl AAV on day- 4, treated with vehicle control, S1p or P3 on day 14 and harvested at 24 h after treatment. N = 3, in shCtrl, S1p compared to vehicle **p < 0.001, P3 to vehicle **p < 0.001. For S1p treatment, shTIA1 compared to shCtrl, ##p = 0.001. For P3 treatment, shTIA1 compared to shCtrl, ##p = 0.0016. f Quantification of CP13 immunoblot in cell lysate of hippocampal cultures over-expressing human P301L tau, transduced with shTIA1 or shCtrl AAV on day 4, treated with vehicle control, S1p or P3 on day 14 and harvested at 24 h after treatment. N = 3, in shctrl, S1p compared to vehicle **p = 0.007, P3 to vehicle **p = 0.006. For S1p treatment, shTIA1 compared to shCtrl, ##p = 0.006. For P3 treatment, shTIA1 compared to shCtrl, ##p = 0.006. Two-way ANOVA multiple comparison test by Fisher’s LSD. g NeuN-positive neurons in shctrl and shTIA1 cultures after saline or S1p treatment. **p < 0.0001 compared to corresponding control, ##p = 0.0055 compared to S1p group in shctrl cultures. h LDH assay with conditioned medium at 24 h after vehicle or S1p treatment in hippocampal neurons over-expressed with human WT or P301L Tau. The S1p fractions are from three genotypes of 9-month-old brains, including PS19 Tia1+/+, PS19 Tia1+/− and C57BL/6 wild-type mice. N = 4 separate times of experiment (triplicate wells each time). **p < 0.001 compared to corresponsive saline control. In WT tau over-expressed neurons, Tia1+/+ S1p compared to Tia1+/− S1p, #p = 0.0402. In P301L tau over-expressed neurons, Tia1+/+ S1p compared to Tia1+/− S1p, #p = 0.0394. Two-way ANOVA, post hoc multiple comparison test by Fisher’s LSD. Data are represented as mean ± SEMCC BY · PubMed Central

Verification

Claims the paper makes

The claims and statistics of this paper haven’t been checked yet.

Run the check — free, no account needed. It reads the open-access text and checks the sources it cites.

A few free checks a day · papers already verified open instantly · results are public

Claims other papers make about this one

Each is checked against this paper’s own text: does it say what the citing paper says it does?

Self-check

Percentages, sums and reported differences re-computed from the paper’s own numbers.

The self-check needs the paper’s full text.

Citations

Cites

Show all 14 references

Research works printed but not linked: 38

  1. Ahmed Z, Cooper J, Murray TK, Garn K, Mcnaughton E, Clarke H et al. (2014) A novel in vivo model of tau propagation with rapid and progressive neurofibrillary tangle pathology: the pattern of spread is determined by connectivity, not proximity. Acta Neuropathol 3:667–683. https://doi.org/10.1007/s00401-014-1254-6 · DOI
  2. Asai H, Ikezu S, Tsunoda S, Medalla M, Luebke J, Haydar T et al. (2015) Depletion of microglia and inhibition of exosome synthesis halt tau propagation. Nat Neurosci 18:1584–1593. https://doi.org/10.1038/nn.4132 · DOI · Paper page
  3. Ash PEA, Vanderweyde TE, Youmans KL, Apicco DJ, Wolozin B (2014) Pathological stress granules in Alzheimer’s disease. Brain Res 1584:52–58. https://doi.org/10.1016/J.BRAINRES.2014.05.052 · DOI · Paper page
  4. Berger Z, Roder H, Hanna A, Carlson A, Rangachari V, Yue M et al. (2007) Accumulation of pathological tau species and memory loss in a conditional model of tauopathy. J Neurosci 27:3650–3662. https://doi.org/10.1523/JNEUROSCI.0587-07.2007 · DOI
  5. Bezaire MJ, Soltesz I (2013) Quantitative assessment of CA1 local circuits: knowledge base for interneuron-pyramidal cell connectivity. Hippocampus 23:751–785. https://doi.org/10.1002/hipo.22141 · DOI · Paper page
  6. Brunello CA, Yan X, Huttunen HJ (2016) Internalized Tau sensitizes cells to stress by promoting formation and stability of stress granules. Sci Rep 6:1–13. https://doi.org/10.1038/srep30498 · DOI
  7. Chen L, Liu B (2017) Relationships between stress granules, oxidative stress, and neurodegenerative diseases. Oxid Med Cell Longev 2017:1–10. https://doi.org/10.1155/2017/1809592 · DOI
  8. Davis AA, Leyns CEG, Holtzman DM (2018) Intercellular spread of protein aggregates in neurodegenerative disease. Annu Rev Cell Dev Biol 34:545–568. https://doi.org/10.1146/annurev-cellbio-100617-062636 · DOI · Paper page
  9. Gerson JE, Kayed R (2013) Formation and propagation of tau oligomeric seeds. Front Neurol 4:1–10. https://doi.org/10.3389/fneur.2013.00093 · DOI
  10. Grad LI, Yerbury JJ, Turner BJ, Guest WC, Pokrishevsky E, O’Neill MA et al. (2014) Intercellular propagated misfolding of wild-type Cu/Zn superoxide dismutase occurs via exosome-dependent and -independent mechanisms. Proc Natl Acad Sci USA 111:3620–3625. https://doi.org/10.1073/pnas.1312245111 · DOI · Paper page
  11. Hackman P, Sarparanta J, Lehtinen S, Vihola A, Evilä A, Jonson PH et al. (2013) Welander distal myopathy is caused by a mutation in the RNA-binding protein TIA1. Ann Neurol 73:500–509. https://doi.org/10.1002/ana.23831 · DOI
  12. Jiang L, Chen S-H, Chu C-H, Wang S-J, Oyarzabal E, Wilson B et al. (2015) A novel role of microglial NADPH oxidase in mediating extra-synaptic function of norepinephrine in regulating brain immune homeostasis. Glia 63:1057–1072. https://doi.org/10.1002/glia.22801 · DOI
  13. Kaufman SK, Sanders DW, Thomas TL, Ruchinskas AJ, Vaquer-Alicea J, Sharma AM et al. (2016) Tau prion strains dictate patterns of cell pathology, progression rate, and regional vulnerability in vivo. Neuron 92:796–812. https://doi.org/10.1016/j.neuron.2016.09.055 · DOI · Paper page
  14. Lee Y, Jonson PH, Sarparanta J, Palmio J, Sarkar M, Vihola A et al. (2018) TIA1 variant drives myodegeneration in multisystem proteinopathy with SQSTM1 mutations. J Clin Invest 128:1164–1177. https://doi.org/10.1172/JCI97103 · DOI
  15. Lewis J, McGowan E, Rockwood J, Melrose H, Nacharaju P, Van Slegtenhorst M et al. (2000) Neurofibrillary tangles, amyotrophy and progressive motor disturbance in mice expressing mutant (P301L) tau protein. Nat Genet 25:402–405. https://doi.org/10.1038/78078 · DOI · Paper page
  16. Liu L, Drouet V, Wu JW, Witter MP, Small SA, Clelland C et al. (2012) Trans-synaptic spread of tau pathology in vivo. PLoS One 7:e31302. https://doi.org/10.1371/journal.pone.0031302 · DOI
  17. LoPresti P, Szuchet S, Papasozomenos SC, Zinkowski RP, Binder LI (1995) Functional implications for the microtubule-associated protein tau: localization in oligodendrocytes. Proc Natl Acad Sci USA 92:10369–10373. https://doi.org/10.1073/PNAS.92.22.10369 · DOI · Paper page
  18. Mackenzie IR, Nicholson AM, Sarkar M, Messing J, Purice MD, Pottier C et al. (2017) TIA1 mutations in amyotrophic lateral sclerosis and frontotemporal dementia promote phase separation and alter stress granule dynamics. Neuron 95:808.e9–816.e9. https://doi.org/10.1016/J.NEURON.2017.07.025 · DOI
  19. Maziuk B, Ballance HI, Wolozin B (2017) Dysregulation of RNA binding protein aggregation in neurodegenerative disorders. Front Mol Neurosci 10:89. https://doi.org/10.3389/fnmol.2017.00089 · DOI
  20. Münch C, O’Brien J, Bertolotti A (2011) Prion-like propagation of mutant superoxide dismutase-1 misfolding in neuronal cells. Proc Natl Acad Sci USA 108:3548–3553. https://doi.org/10.1073/pnas.1017275108 · DOI
  21. Narasimhan S, Guo JL, Changolkar L, Stieber A, McBride JD, Silva LV et al. (2017) Pathological tau strains from human brains recapitulate the diversity of tauopathies in nontransgenic mouse brain. J Neurosci 37:11406–11423. https://doi.org/10.1523/JNEUROSCI.1230-17.2017 · DOI · Paper page
  22. Paxinos G, Franklin KBJ (2003) Full-Text, 2nd edn. Academic press, San Diego
  23. Peng C, Gathagan RJ, Lee VM-Y (2018) Distinct α-synuclein strains and implications for heterogeneity among α-synucleinopathies. Neurobiol Dis 109:209–218. https://doi.org/10.1016/J.NBD.2017.07.018 · DOI
  24. Phillips K, Kedersha N, Shen L, Blackshear PJ, Anderson P (2004) Arthritis suppressor genes TIA-1 and TTP dampen the expression of tumor necrosis factor alpha, cyclooxygenase 2, and inflammatory arthritis. Proc Natl Acad Sci USA 101:2011–2016. https://doi.org/10.1073/pnas.0400148101 · DOI
  25. Sanders DW, Kaufman SK, DeVos SL, Sharma AM, Mirbaha H, Li A et al. (2014) Distinct tau prion strains propagate in cells and mice and define different tauopathies. Neuron 82:1271–1288. https://doi.org/10.1016/j.neuron.2014.04.047 · DOI · Paper page
  26. Sanders DW, Kaufman SK, DeVos SL, Sharma AM, Mirbaha H, Li A et al. (2014) Distinct tau prion strains propagate in cells and mice and define different tauopathies. Neuron 82:1271–1288. https://doi.org/10.1016/j.neuron.2014.04.047 · DOI · Paper page
  27. Sanders DW, Kaufman SK, Holmes BB, Diamond MI (2016) Prions and protein assemblies that convey biological information in health and disease. Neuron 89:433–448. https://doi.org/10.1016/j.neuron.2016.01.026 · DOI
  28. Schmitz SK, Hjorth JJJ, Joemai RMS, Wijntjes R, Eijgenraam S, de Bruijn P et al. (2011) Automated analysis of neuronal morphology, synapse number and synaptic recruitment. J Neurosci Methods 195:185–193. https://doi.org/10.1016/J.JNEUMETH.2010.12.011 · DOI
  29. Stopschinski BE, Diamond MI (2017) The prion model for progression and diversity of neurodegenerative diseases. Lancet Neurol 16:323–332. https://doi.org/10.1016/S1474-4422(17)30037-6 · DOI
  30. Takeda S, Wegmann S, Cho H, Devos SL, Commins C, Roe AD et al. (2015) Neuronal uptake and propagation of a rare phosphorylated high-molecular-weight tau derived from Alzheimer’s disease brain. Nat Commun 6:8490. https://doi.org/10.1038/ncomms9490 · DOI · Paper page
  31. Telling GC, Parchi P, DeArmond SJ, Cortelli P, Montagna P, Gabizon R et al. (1996) Evidence for the conformation of the pathologic isoform of the prion protein enciphering and propagating prion diversity. Science 274:2079–2082. https://doi.org/10.1126/SCIENCE.274.5295.2079 · DOI
  32. Vanderweyde T, Apicco DJ, Youmans-Kidder K, Ash PEA, Cook C, Lummertz da Rocha E et al. (2016) Interaction of tau with the RNA-binding protein TIA1 regulates tau pathophysiology and toxicity. Cell Rep 15:1455–1466. https://doi.org/10.1016/j.celrep.2016.04.045 · DOI · Paper page
  33. Vanderweyde T, Yu H, Varnum M, Liu-Yesucevitz L, Citro A, Ikezu T et al. (2012) Contrasting pathology of the stress granule proteins TIA-1 and G3BP in tauopathies. J Neurosci 32:8270–8283. https://doi.org/10.1523/JNEUROSCI.1592-12.2012 · DOI
  34. Volpicelli-Daley LA, Luk KC, Lee VM-Y (2014) Addition of exogenous α-synuclein preformed fibrils to primary neuronal cultures to seed recruitment of endogenous α-synuclein to Lewy body and Lewy neurite–like aggregates. Nat Protoc 9:2135–2146. https://doi.org/10.1038/nprot.2014.143 · DOI · Paper page
  35. Volpicelli-Daley LA, Luk KC, Patel TP, Tanik SA, Riddle DM, Stieber A et al. (2011) Exogenous α-synuclein fibrils induce lewy body pathology leading to synaptic dysfunction and neuron death. Neuron 72:57–71. https://doi.org/10.1016/J.NEURON.2011.08.033 · DOI · Paper page
  36. Wang Y, Mandelkow E (2016) Tau in physiology and pathology. Nat Publ Neurosci 17:5–21. https://doi.org/10.1038/nrn.2015.1 · DOI · Paper page
  37. Weaver CL, Espinoza M, Kress Y, Davies P (2000) Conformational change as one of the earliest alterations of tau in Alzheimer’s disease. Neurobiol Aging 21:719–727. https://doi.org/10.1016/S0197-4580(00)00157-3 · DOI · Paper page
  38. Wegmann S, Maury EA, Kirk MJ, Saqran L, Roe A, DeVos SL et al. (2015) Removing endogenous tau does not prevent tau propagation yet reduces its neurotoxicity. EMBO J 34:3028–3041. https://doi.org/10.15252/embj.201592748 · DOI · Paper page

Cited by

See all 107

Metadata

Authors
Jiang, L., Ash, P. E. A., Maziuk, B. F., Ballance, H. I., Boudeau, S., Abdullatif, A. A., Orlando, M., Petrucelli, L., Ikezu, T., & Wolozin, B.
Venue
Acta Neuropathologica
Published
2018-11-21
Volume
137
Issue
2
Pages
259-277
ISSN
  • 0001-6322
  • 1432-0533
Cited by
107
References
14
Language
en
Funders
  • National Institutes of Health (AG050471, NS089544, AG056318)
  • BrightFocus Foundation
  • Alzheimer Association (Cure Alzheimer’s Fund)
  • Thome Medical Foundation

About these checks

Registry, retraction, Cites and statistics results are computed, not judged, with one exception: a printed reference that no index lists is read once by a model before it counts as a citation error. Claims are extracted by a model and kept only when their quote appears verbatim in the text; each cited source is then checked, with a model’s help, for whether it says what the claim relies on. Those verdicts can be wrong — read the claim’s quote and the cited source before relying on one.

Statistics and arithmetic are recomputed, not judged.

Confidence bands are shown only for fields calibrated on our annotated test set. None is calibrated yet, so no band is shown.

What counts as a claim ›How we measure confidence ›How we check this ›

Are you an author, or do you see a problem with this page? Request a review

How to cite

Cite CoChat for the checks on this page, and the paper for its own findings.

This page
CoChat. (2026). Citation check: TIA1 regulates the generation and response to toxic tau oligomers. https://app.cochat.ai/papers/10.1007/s00401-018-1937-5
The paper
Jiang, L., Ash, P. E. A., Maziuk, B. F., Ballance, H. I., Boudeau, S., Abdullatif, A. A., Orlando, M., Petrucelli, L., Ikezu, T., & Wolozin, B. (2019). TIA1 regulates the generation and response to toxic tau oligomers. Acta Neuropathologica. https://doi.org/10.1007/s00401-018-1937-5

Data sources

Bibliographic data: Semantic Scholar, OpenAlex, Crossref.

Contains information from the Semantic Scholar Academic Graph Datasets, made available under the ODC Attribution License (ODC-BY 1.0).

Semantic Scholar’s data is described in: Kinney, R., et al. (2023). The Semantic Scholar Open Data Platform. arXiv:2301.10140.