

The DOI matches its Crossref record; 48 of the 48 references it cites were found in a registry or an index.
Seeding selectivity and ultrasensitive detection of tau aggregate conformers of Alzheimer disease
Open accessAbstract
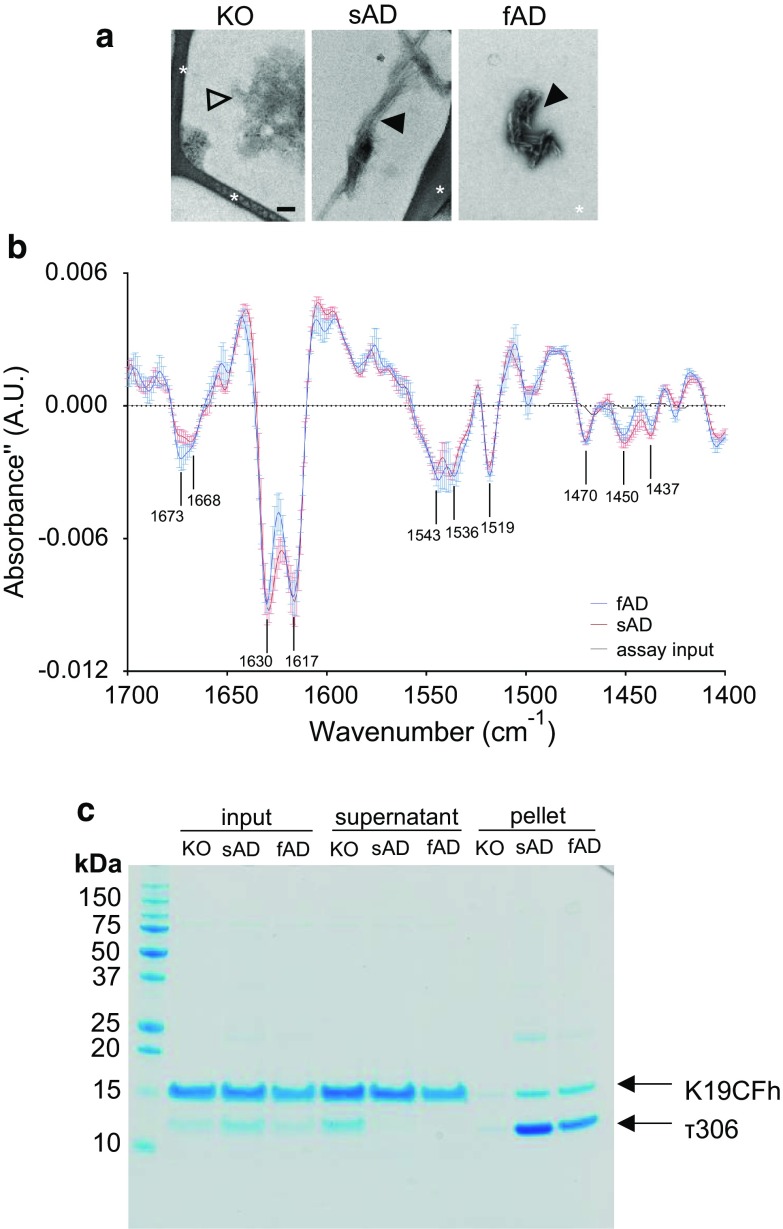
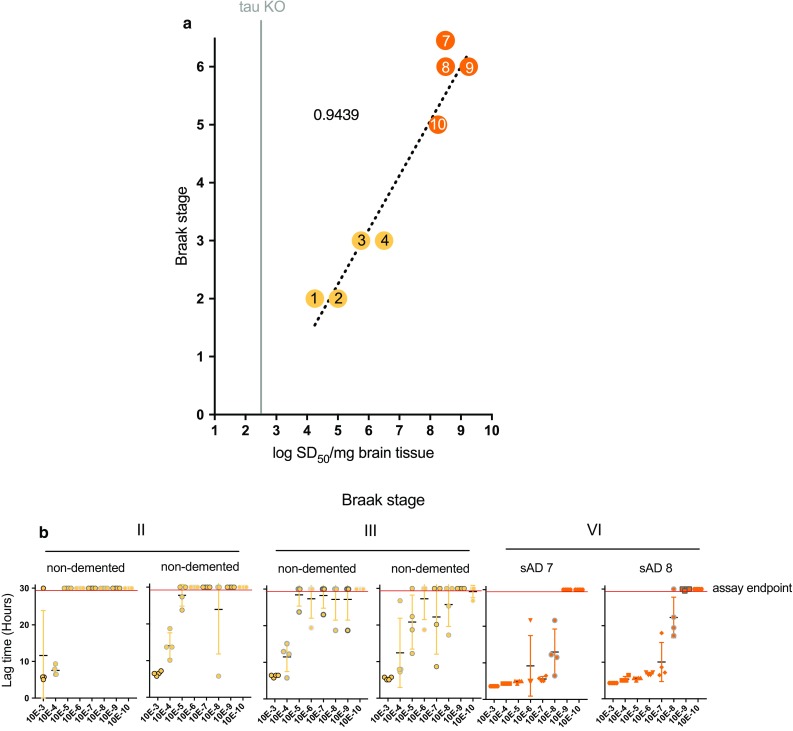
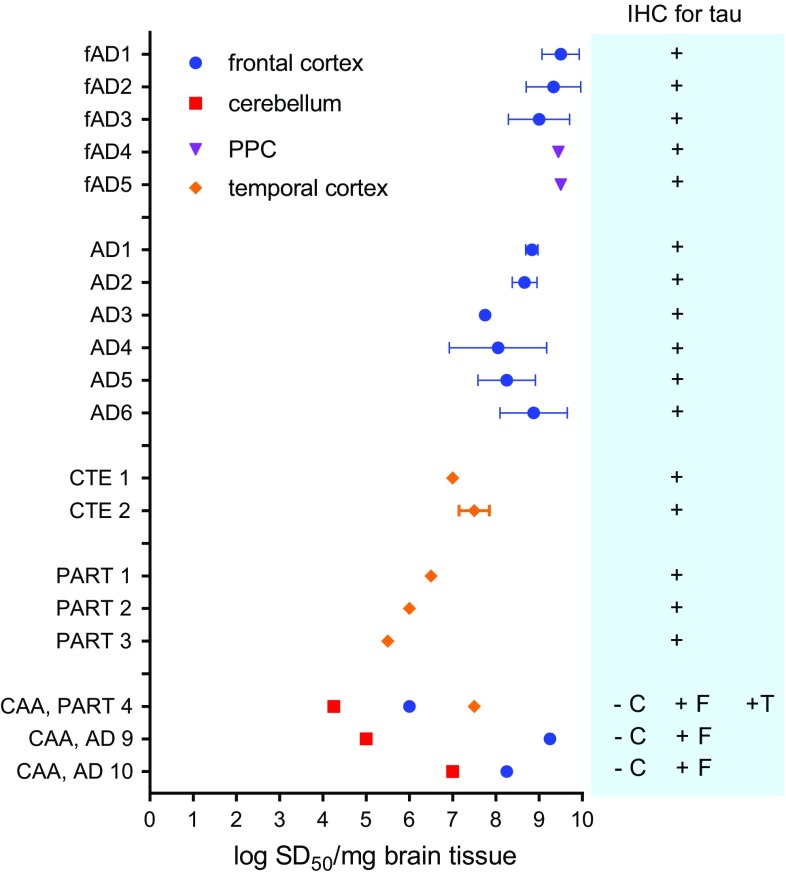
Alzheimer disease (AD) and chronic traumatic encephalopathy (CTE) involve the abnormal accumulation in the brain of filaments composed of both three-repeat (3R) and four-repeat (4R) (3R/4R) tau isoforms. To probe the molecular basis for AD’s tau filament propagation and to improve detection of tau aggregates as potential biomarkers, we have exploited the seeded polymerization growth mechanism of tau filaments to develop a highly selective and ultrasensitive cell-free tau seed amplification assay optimized for AD (AD real-time quaking-induced conversion or AD RT-QuIC). The reaction is based on the ability of AD tau aggregates to seed the formation of amyloid fibrils made of certain recombinant tau fragments. AD RT-QuIC detected seeding activity in AD ( n = 16) brains at dilutions as extreme as 10 7 –10 10 -fold, but was 10 2 –10 6 -fold less responsive when seeded with brain from most cases of other types of tauopathy with comparable loads of predominant 3R or 4R tau aggregates. For example, AD brains had average seeding activities that were orders of magnitude higher than Pick disease brains with predominant 3R tau deposits, but the opposite was true using our previously described Pick-optimized tau RT-QuIC assay. CTE brains ( n = 2) had seed concentrations comparable to the weakest of the AD specimens, and higher than 3 of 4 specimens with 3R/4R primary age-related tauopathy. AD seeds shared properties with the tau filaments found in AD brains, as AD seeds were sarkosyl-insoluble, protease resistant, and reactive with tau antibodies. Moreover, AD RT-QuIC detected as little as 16 fg of pure synthetic tau fibrils. The distinctive seeding activity exhibited by AD and CTE tau filaments compared to other types of tauopathies in these seeded polymerization reactions provides a mechanistic basis for their consistent propagation as specific conformers in patients with 3R/4R tau diseases. Importantly, AD RT-QuIC also provides rapid ultrasensitive quantitation of 3R/4R tau-seeding activity as a biomarker.
Overview
The claims and statistics of this paper haven’t been checked yet.
Run the check — free, no account needed. It reads the open-access text and checks the sources it cites.
Integrity signals
Registry
Cites
Statistics
Figures
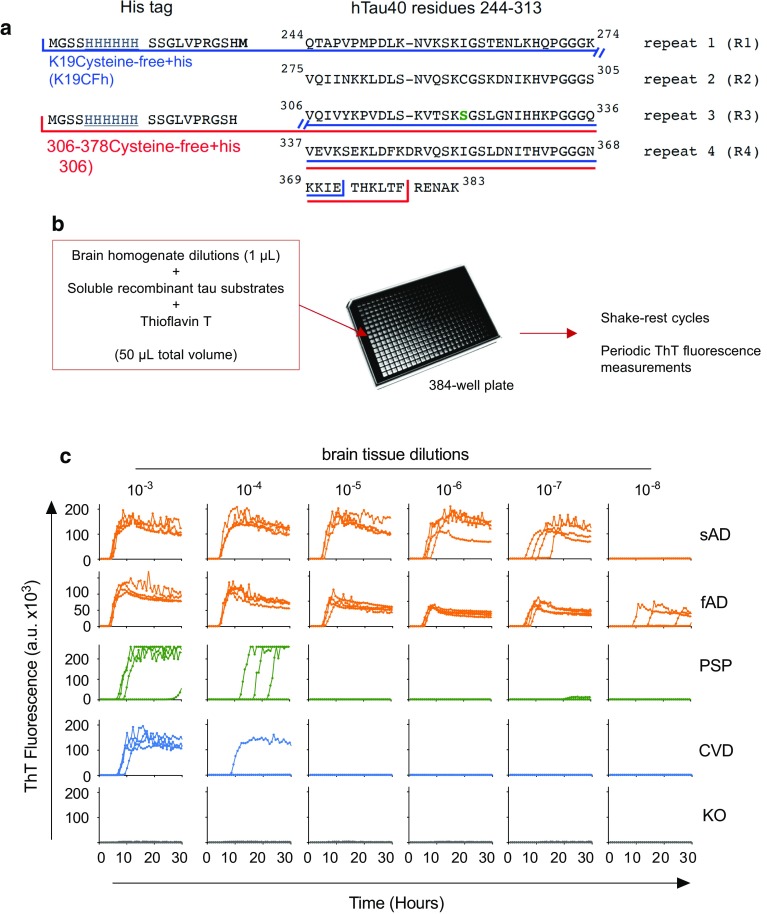
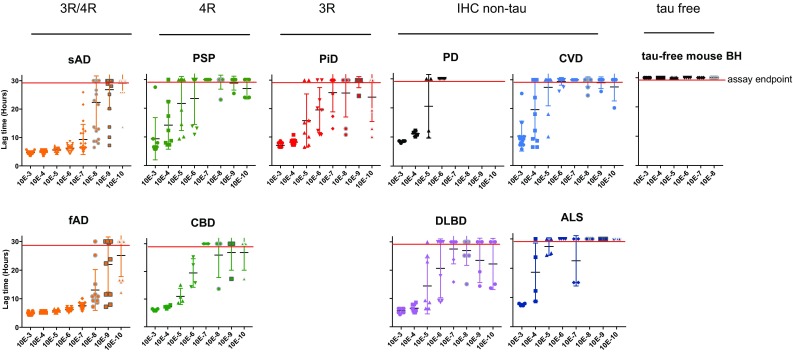
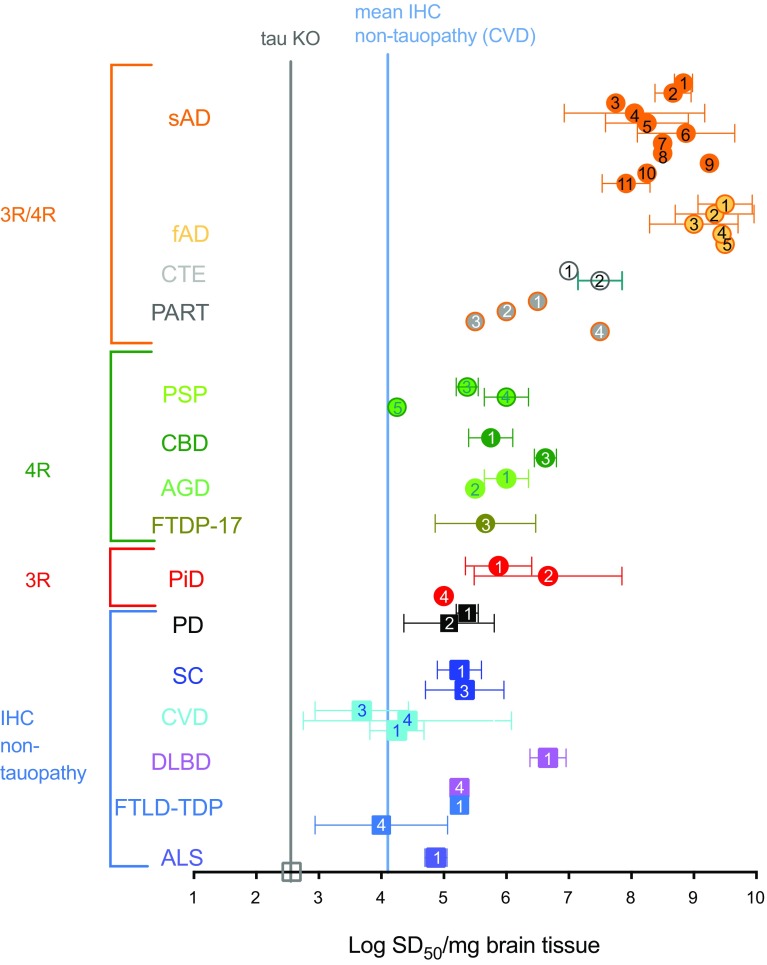
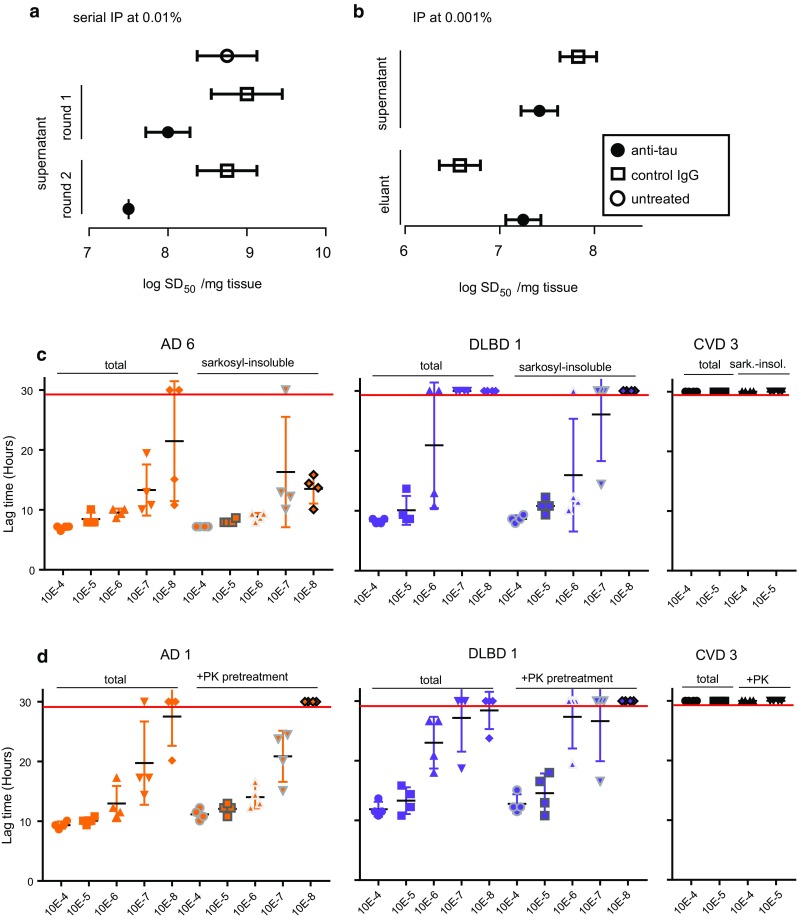
Verification
Claims the paper makes
The claims and statistics of this paper haven’t been checked yet.
Run the check — free, no account needed. It reads the open-access text and checks the sources it cites.
Claims other papers make about this one
Each is checked against this paper’s own text: does it say what the citing paper says it does?
The cited source says what the claim attributes to it.
In the citing paper
“As a pathological readout, seeding activity has been shown to identify the action of high molecular weight tau (Martinez et al., 2022) and even differentiate between specific conformers in 3R/4R tau diseases (Kraus et al., 2019).”
From Network analysis identifies strain-dependent response to tau and tau seeding-associated genes (2023) · cites this paper as Kraus et al., 2019
Self-check
Percentages, sums and reported differences re-computed from the paper’s own numbers.
The self-check needs the paper’s full text.
Citations
Cites
Staging of brain pathology related to sporadic Parkinson’s disease
Braak, H., Tredici, K. D., Rüb, U., de Vos, R. A. I., Jansen Steur, E. N. H., & Braak, E. (2003) · Neurobiology of Aging · doi:10.1016/s0197-4580(02)00065-9 · Cited by 10,777
NIA‐AA Research Framework: Toward a biological definition of Alzheimer's disease
Jack, C. R., Bennett, D. A., Blennow, K., Carrillo, M. C., Dunn, B., Haeberlein, S. B., Holtzman, D. M., Jagust, W., Jessen, F., Karlawish, J., et al. (2018) · Alzheimer's & Dementia · doi:10.1016/j.jalz.2018.02.018 · Cited by 10,537
Protein production by auto-induction in high-density shaking cultures
Studier, F. W. (2005) · Protein Expression and Purification · doi:10.1016/j.pep.2005.01.016 · Cited by 5,949
Hyman, B. T., Phelps, C. H., Beach, T. G., Bigio, E. H., Cairns, N. J., Carrillo, M. C., Dickson, D. W., Duyckaerts, C., Frosch, M. P., Masliah, E., et al. (2012) · Alzheimer's & Dementia · doi:10.1016/j.jalz.2011.10.007 · Cited by 3,092
Cryo-EM structures of tau filaments from Alzheimer’s disease
Fitzpatrick, A. W. P., Falcon, B., He, S., Murzin, A. G., Murshudov, G., Garringer, H. J., Crowther, R. A., Ghetti, B., Goedert, M., & Scheres, S. H. W. (2017) · Nature · doi:10.1038/nature23002 · Cited by 2,061
Self-citationCaughey, B., & Lansbury, P. T. (2003) · Annual Review of Neuroscience · doi:10.1146/annurev.neuro.26.010302.081142 · Cited by 1,650
Self-citationProtein secondary structures in water from second-derivative amide I infrared spectra
Dong, A., Huang, P., & Caughey, W. S. (1990) · Biochemistry · doi:10.1021/bi00465a022 · Cited by 1,333
New insight into protein secondary structure from resolution-enhanced infrared spectra.
Surewicz, W., & Mantsch, H. (1988) · Biochimica et Biophysica Acta · doi:10.1016/0167-4838(88)90107-0 · Cited by 1,184
A mutation in the Amyloid Precursor Protein Associated with Hereditary Alzheimer's Disease
Murrell, J. R., Farlow, M. R., Ghetti, B. F., & Benson, M. D. (1991) · Science · doi:10.1126/science.1925564 · Cited by 1,142
Self-citationGoedert, M., Spillantini, M. G., Cairns, N. J., & Crowther, R. A. (1992) · Neuron · doi:10.1016/0896-6273(92)90117-v · Cited by 1,122
Cairns, N. J., Bigio, E. H., Mackenzie, I. R. A., Neumann, M., Lee, V. M.-Y., Hatanpaa, K. J., White, C. L., Schneider, J. A., Grinberg, L. T., Halliday, G., et al. (2007) · Acta Neuropathologica · doi:10.1007/s00401-007-0237-2 · Cited by 1,110
Structures of filaments from Pick’s disease reveal a novel tau protein fold
Falcon, B., Zhang, W., Murzin, A. G., Murshudov, G. N., Garringer, H. J., Vidal, R., Crowther, R. A., Ghetti, B. F., Scheres, S. H. W., & Goedert, M. (2018) · Nature · doi:10.1038/s41586-018-0454-y · Cited by 837
Self-citationBrain homogenates from human tauopathies induce tau inclusions in mouse brain
Clavaguera, F., Akatsu, H., Fraser, G. M., Crowther, R. A., Frank, S., Hench, J., Probst, A., Winkler, D. T., Reichwald, J., Staufenbiel, M., et al. (2013) · Proceedings of the National Academy of Sciences · doi:10.1073/pnas.1301175110 · Cited by 792
Self-citationProteopathic tau seeding predicts tauopathy in vivo
Holmes, B. B., Furman, J. L., Mahan, T. E., Yamasaki, T. R., Mirbaha, H., Eades, W. C., Belaygorod, L., Cairns, N. J., Holtzman, D. M., & Diamond, M. I. (2014) · Proceedings of the National Academy of Sciences · doi:10.1073/pnas.1411649111 · Cited by 696
Ultrasensitive human prion detection in cerebrospinal fluid by real-time quaking-induced conversion
Atarashi, R., Satoh, K., Sano, K., Fuse, T., Yamaguchi, N., Ishibashi, D., Matsubara, T., Nakagaki, T., Yamanaka, H., Shirabe, S., et al. (2011) · Nature Medicine · doi:10.1038/nm.2294 · Cited by 655
Alpha‐synuclein RT ‐Qu IC in the CSF of patients with alpha‐synucleinopathies
Fairfoul, G., McGuire, L. I., Pal, S., Ironside, J. W., Neumann, J., Christie, S., Joachim, C., Esiri, M., Evetts, S. G., Rolinski, M., et al. (2016) · Annals of Clinical and Translational Neurology · doi:10.1002/acn3.338 · Cited by 608
Rapid End-Point Quantitation of Prion Seeding Activity with Sensitivity Comparable to Bioassays
Wilham, J. M., Orrú, C., Bessen, R., Atarashi, R., Sano, K., Race, B., Meade-White, K., Taubner, L. M., Timmes, A. G., & Caughey, B. (2010) · PLoS Pathogens · doi:10.1371/journal.ppat.1001217 · Cited by 509
Self-citationShahnawaz, M., Tokuda, T., Waragai, M., Méndez, N., Ishii, R., Trenkwalder, C., Mollenhauer, B., & Soto, C. A. (2016) · JAMA Neurology · doi:10.1001/jamaneurol.2016.4547 · Cited by 485
Kaufman, S. K., Sanders, D. W., Thomas, T. L., Ruchinskas, A. J., Vaquer-Alicea, J., Sharma, A. M., Miller, T. M., & Diamond, M. I. (2016) · Neuron · doi:10.1016/j.neuron.2016.09.055 · Cited by 450
Groveman, B. R., Orru, C. D., Hughson, A. G., Raymond, L. D., Zanusso, G., Ghetti, B. F., Campbell, K. J., Safar, J., Galasko, D. R., & Caughey, B. W. (2018) · Acta Neuropathologica Communications · doi:10.1186/s40478-018-0508-2 · Cited by 414
Self-citationMcGuire, L. I., Peden, A., Orru, C. D., Wilham, J. M., Appleford, N. E. J., Mallinson, G., Andrews, M., Head, M. W., Caughey, B. W., Will, R. G., et al. (2012) · Annals of Neurology · doi:10.1002/ana.23589 · Cited by 388
Self-citationNarasimhan, S., Guo, J. L., Changolkar, L., Stieber, A., McBride, J. D., Silva, L. V., He, Z., Zhang, B., Gathagan, R. J., Trojanowski, J. Q., et al. (2017) · The Journal of Neuroscience · doi:10.1523/jneurosci.1230-17.2017 · Cited by 374
Tau filaments from multiple cases of sporadic and inherited Alzheimer's disease adopt a common fold
Falcon, B., Zhang, W., Schweighauser, M., Murzin, A. G., Vidal, R., Garringer, H. J., Ghetti, B., Scheres, S. H. W., & Goedert, M. (2018) · Acta Neuropathologica · doi:10.1007/s00401-018-1914-z · Cited by 362
Self-citationA Test for Creutzfeldt–Jakob Disease Using Nasal Brushings
Orru, C. D., Bongianni, M., Tonoli, G., Ferrari, S., Hughson, A. G., Groveman, B. R., Fiorini, M., Pocchiari, M., Monaco, S., Caughey, B. W., et al. (2014) · New England Journal of Medicine · doi:10.1056/nejmoa1315200 · Cited by 355
Self-citationKhatoon, S., Grundke, I., & Iqbal, K. (1992) · Journal of Neurochemistry · doi:10.1111/j.1471-4159.1992.tb09432.x · Cited by 304
Williams, D. R. (2006) · Internal Medicine Journal · doi:10.1111/j.1445-5994.2006.01153.x · Cited by 259
Rapid and Sensitive RT-QuIC Detection of Human Creutzfeldt-Jakob Disease Using Cerebrospinal Fluid
Orru, C. D., Groveman, B. R., Hughson, A. G., Zanusso, G., Coulthart, M. B., & Caughey, B. W. (2015) · mBio · doi:10.1128/mbio.02451-14 · Cited by 248
Self-citationSchmidt, M., Zhukareva, V., Newell, K., Lee, V., & Trojanowski, J. (2001) · Acta Neuropathologica · doi:10.1007/s004010000330 · Cited by 230
Self-citationDeep clinical and neuropathological phenotyping of P ick disease
Irwin, D. J., Brettschneider, J., McMillan, C. T., Cooper, F. I., Olm, C. A., Arnold, S. E., Deerlin, V. M. V., Seeley, W. W., Miller, B. L., Lee, E. B., et al. (2015) · Annals of Neurology · doi:10.1002/ana.24559 · Cited by 219
Prions in the Urine of Patients with Variant Creutzfeldt–Jakob Disease
Moda, F., Gambetti, P. L., Notari, S., Concha‐Marambio, L., Catania, M., Park, K.-W., Maderna, E., Suardi, S., Haı̈k, S., Brandel, J., et al. (2014) · New England Journal of Medicine · doi:10.1056/nejmoa1404401 · Cited by 213
Detection of Misfolded Aβ Oligomers for Sensitive Biochemical Diagnosis of Alzheimer’s Disease
Salvadores, N., Shahnawaz, M., Scarpini, E. A., Tagliavini, F., & Soto, C. A. (2014) · Cell Reports · doi:10.1016/j.celrep.2014.02.031 · Cited by 205
Bongianni, M., Orru, C. D., Groveman, B. R., Sacchetto, L., Fiorini, M., Tonoli, G., Triva, G., Capaldi, S., Testi, S., Ferrari, S., et al. (2016) · JAMA Neurology · doi:10.1001/jamaneurol.2016.4614 · Cited by 202
Self-citationOrru, C. D., Groveman, B. R., Raymond, L. D., Hughson, A. G., Nonno, R., Zou, W., Ghetti, B. F., Gambetti, P. L., & Caughey, B. W. (2015) · PLoS Pathogens · doi:10.1371/journal.ppat.1004983 · Cited by 167
Self-citationProtein Misfolding Cyclic Amplification for Diagnosis and Prion Propagation Studies
Castilla, J., Saá, P., Morales, R., Abid, K., Maundrell, K., & Soto, C. A. (2006) · Methods in enzymology on CD-ROM/Methods in enzymology · doi:10.1016/s0076-6879(06)12001-7 · Cited by 150
Saijo, E., Ghetti, B. F., Zanusso, G., Oblak, A. L., Furman, J. L., Diamond, M. I., Kraus, A., & Caughey, B. W. (2017) · Acta Neuropathologica · doi:10.1007/s00401-017-1692-z · Cited by 147
Self-citationOrru, C. D., Yuan, J., Appleby, B. S., Li, B., Li, Y., Winner, D., Wang, Z., Zhan, Y.-A., Rodgers, M. S., Rarick, J. M., et al. (2017) · Science Translational Medicine · doi:10.1126/scitranslmed.aam7785 · Cited by 147
Self-citationWidespread tau seeding activity at early Braak stages
Furman, J. L., Vaquer‐Alicea, J., White, C. L., Cairns, N. J., Nelson, P. T., & Diamond, M. I. (2016) · Acta Neuropathologica · doi:10.1007/s00401-016-1644-z · Cited by 146
Schmitz, M., Cramm, M., Llorens, F., Müller-Cramm, D., Collins, S. J., Atarashi, R., Satoh, K., Orru, C. D., Groveman, B. R., Zafar, S., et al. (2016) · Nature Protocols · doi:10.1038/nprot.2016.120 · Cited by 140
Self-citationAdvanced tests for early and accurate diagnosis of Creutzfeldt–Jakob disease
Zanusso, G., Monaco, S., Pocchiari, M., & Caughey, B. W. (2016) · Nature Reviews Neurology · doi:10.1038/nrneurol.2016.65 · Cited by 129
Self-citationReappraisal of TDP-43 pathology in FTLD-U subtypes
Mackenzie, I. R., & Neumann, M. (2017) · Acta Neuropathologica · doi:10.1007/s00401-017-1716-8 · Cited by 118
Takeda, S., Commins, C., DeVos, S. L., Nobuhara, C. K., Wegmann, S., Roe, A. D., Costantino, I., Fan, Z., Nicholls, S. B., Sherman, A. E., et al. (2016) · Annals of Neurology · doi:10.1002/ana.24716 · Cited by 113
Characteristic CSF Prion Seeding Efficiency in Humans with Prion Diseases
Cramm, M., Schmitz, M., Karch, A., Zafar, S., Varges, D., Mitrova, E., Schroeder, B., Raeber, A. J., Kühn, F., & Zerr, I. (2014) · Molecular Neurobiology · doi:10.1007/s12035-014-8709-6 · Cited by 112
New generation QuIC assays for prion seeding activity
Orru, C. D., Wilham, J. M., Vascellari, S., Hughson, A. G., & Caughey, B. W. (2012) · Prion · doi:10.4161/pri.19430 · Cited by 101
Self-citationTechniques in Experimental Virology
Harris, H. J. C., & S., K. (1965) · The American Journal of the Medical Sciences · doi:10.1097/00000441-196508000-00058 · Cited by 98
Morozova, O. A., March, Z. M., Robinson, A. S., & Colby, D. W. (2013) · Biochemistry · doi:10.1021/bi400866w · Cited by 92
Amplification of Tau Fibrils from Minute Quantities of Seeds
Meyer, V., Dinkel, P. D., Hager, E. R., & Margittai, M. (2014) · Biochemistry · doi:10.1021/bi501050g · Cited by 76
Gorga, J. C., Dong, A., Manning, M. C., Woody, R. W., Caughey, W. S., & Strominger, J. L. (1989) · Proceedings of the National Academy of Sciences · doi:10.1073/pnas.86.7.2321 · Cited by 65
A Test for Creutzfeldt–Jakob Disease Using Nasal Brushings
Vinny, P. W., Vishnu, V. Y., & Lal, V. (2014) · New England Journal of Medicine · doi:10.1056/nejmc1410732 · Cited by 31
Cited by
Sorted by citations
Protein transmission in neurodegenerative disease
Peng, C., Trojanowski, J. Q., & Lee, V. M.-Y. (2020) · Nature Reviews Neurology · doi:10.1038/s41582-020-0333-7 · Cited by 625
Reducing acetylated tau is neuroprotective in brain injury
Shin, M.-K., Vázquez-Rosa, E., Koh, Y., Dhar, M., Chaubey, K., Cintrón-Pérez, C. J., Barker, S., Miller, E., Franke, K., Noterman, M. F., et al. (2021) · Cell · doi:10.1016/j.cell.2021.03.032 · Cited by 226
Self-citationRösler, T. W., Marvian, A. T., Brendel, M., Nykänen, N.-P., Höllerhage, M., Schwarz, S. C., Hopfner, F., Koeglsperger, T., Respondek, G., Schweyer, K., et al. (2019) · Progress in Neurobiology · doi:10.1016/j.pneurobio.2019.101644 · Cited by 231
Saijo, E., Metrick, M. A., Koga, S., Parchi, P., Litvan, I., Spina, S., Boxer, A. L., Rojas, J. C., Galasko, D. R., Kraus, A., et al. (2019) · Acta Neuropathologica · doi:10.1007/s00401-019-02080-2 · Cited by 177
Self-citationCerebrospinal Fluid Biomarkers of Alzheimer’s Disease: Current Evidence and Future Perspectives
McGrowder, D. A., Miller, F. G., Vaz, K., Nwokocha, C. R., Wilson-Clarke, C. F., Anderson, M., Brown, J., Anderson-Jackson, L., Williams, L., Latore, L., et al. (2021) · Brain Sciences · doi:10.3390/brainsci11020215 · Cited by 169
Metadata
- Authors
- Kraus, A., Saijo, E., Metrick, M. A., Newell, K., Sigurdson, C. J., Zanusso, G., Ghetti, B., & Caughey, B.
- Affiliations
- Rocky Mountain Laboratories (US)
- University of Kansas (US)
- University of California San Diego (US)
- University of Verona (IT)
- Indiana University School of Medicine (US)
- Corresponding author
- Caughey, Byron
- ORCID
- Venue
- Acta Neuropathologica
- Published
- 2018-12-20
- Volume
- 137
- Issue
- 4
- Pages
- 585-598
- ISSN
- 0001-6322 (ISSN-L)
- 1432-0533
- PMC
- PMC6426988
- OpenAlex
- W2906247002
- Cited by
- 143
- References
- 48
- Citations by year
- 2026: 15 · 2025: 25 · 2024: 17 · 2023: 18 · 2022: 20 · 2021: 17 · 2020: 17 · 2019: 14
- FWCI
- 8.25
- Type
- journal article
- Language
- en
- Open access
- hybrid
- doi.org
- Locations
- Acta Neuropathologica (publishedVersion, cc-by)
- Europe PMC (PubMed Central) (publishedVersion, cc-by)
- PubMed Central (publishedVersion, cc-by)
- PubMed (publishedVersion)
- Funders
- National Institute of Allergy and Infectious Diseases (ZIA AI001086-08)
- The CJD Foundation (none)
- National Institute on Aging (PHS P30-AG010133, P30- AG035982, P50 AG005131, P30 AG19610)
- Japan Society for the Promotion of Science (Fellowship for Japanese Biochemical, Behavioral Researchers at NIH)
- National Institute of Neurological Disorders and Stroke (none)
- National Institute of Mental Health (none)
- National Multiple Sclerosis Society (none)
- U.S. Department of Veterans Affairs (none)
- Arizona Biomedical Research Commission (4001, 0011, 05-901, 1001)
- Michael J. Fox Foundation for Parkinson's Research (none)
- Massachusetts Alzheimer's Disease Research Center (P50 AG005134)
- Topics
- Life Sciences › Neuroscience › Cellular and Molecular Neuroscience › Alzheimer's disease research and treatments
- Health Sciences › Medicine › Psychiatry and Mental health › Dementia and Cognitive Impairment Research
- Life Sciences › Biochemistry, Genetics and Molecular Biology › Molecular Biology › Prion Diseases and Protein Misfolding
- Keywords
- Alzheimer's disease, tau aggregates, RT-QuIC, tauopathy, chronic traumatic encephalopathy, Pick's disease, primary age-related tauopathy, ultrasensitive detection, biomarkers, sarkosyl-insoluble tau, protease resistance
- MeSH terms
- Alzheimer Disease, Animals, Brain, Humans, tau Proteins, Mice, Knockout, Tauopathies, Mice, Protein Aggregates
About these checks
Registry, retraction, Cites and statistics results are computed, not judged, with one exception: a printed reference that no index lists is read once by a model before it counts as a citation error. Claims are extracted by a model and kept only when their quote appears verbatim in the text; each cited source is then checked, with a model’s help, for whether it says what the claim relies on. Those verdicts can be wrong — read the claim’s quote and the cited source before relying on one.
Statistics and arithmetic are recomputed, not judged.
Confidence bands are shown only for fields calibrated on our annotated test set. None is calibrated yet, so no band is shown.
What counts as a claim ›How we measure confidence ›How we check this ›
Are you an author, or do you see a problem with this page? Request a review
