

The DOI matches its Crossref record; 79 of the 79 references it cites were found in a registry or an index.
APOE and TREM2 regulate amyloid-responsive microglia in Alzheimer’s disease
Open accessAbstract
Beta-amyloid deposition is a defining feature of Alzheimer's disease (AD). How genetic risk factors, like APOE and TREM2, intersect with cellular responses to beta-amyloid in human tissues is not fully understood. Using single-nucleus RNA sequencing of postmortem human brain with varied APOE and TREM2 genotypes and neuropathology, we identified distinct microglia subpopulations, including a subpopulation of CD163-positive amyloid-responsive microglia (ARM) that are depleted in cases with APOE and TREM2 risk variants. We validated our single-nucleus RNA sequencing findings in an expanded cohort of AD cases, demonstrating that APOE and TREM2 risk variants are associated with a significant reduction in CD163-positive amyloid-responsive microglia. Our results showcase the diverse microglial response in AD and underscore how genetic risk factors influence cellular responses to underlying pathologies.
Overview
The claims and statistics of this paper haven’t been checked yet.
Run the check — free, no account needed. It reads the open-access text and checks the sources it cites.
Integrity signals
Registry
Cites
Statistics
Figures
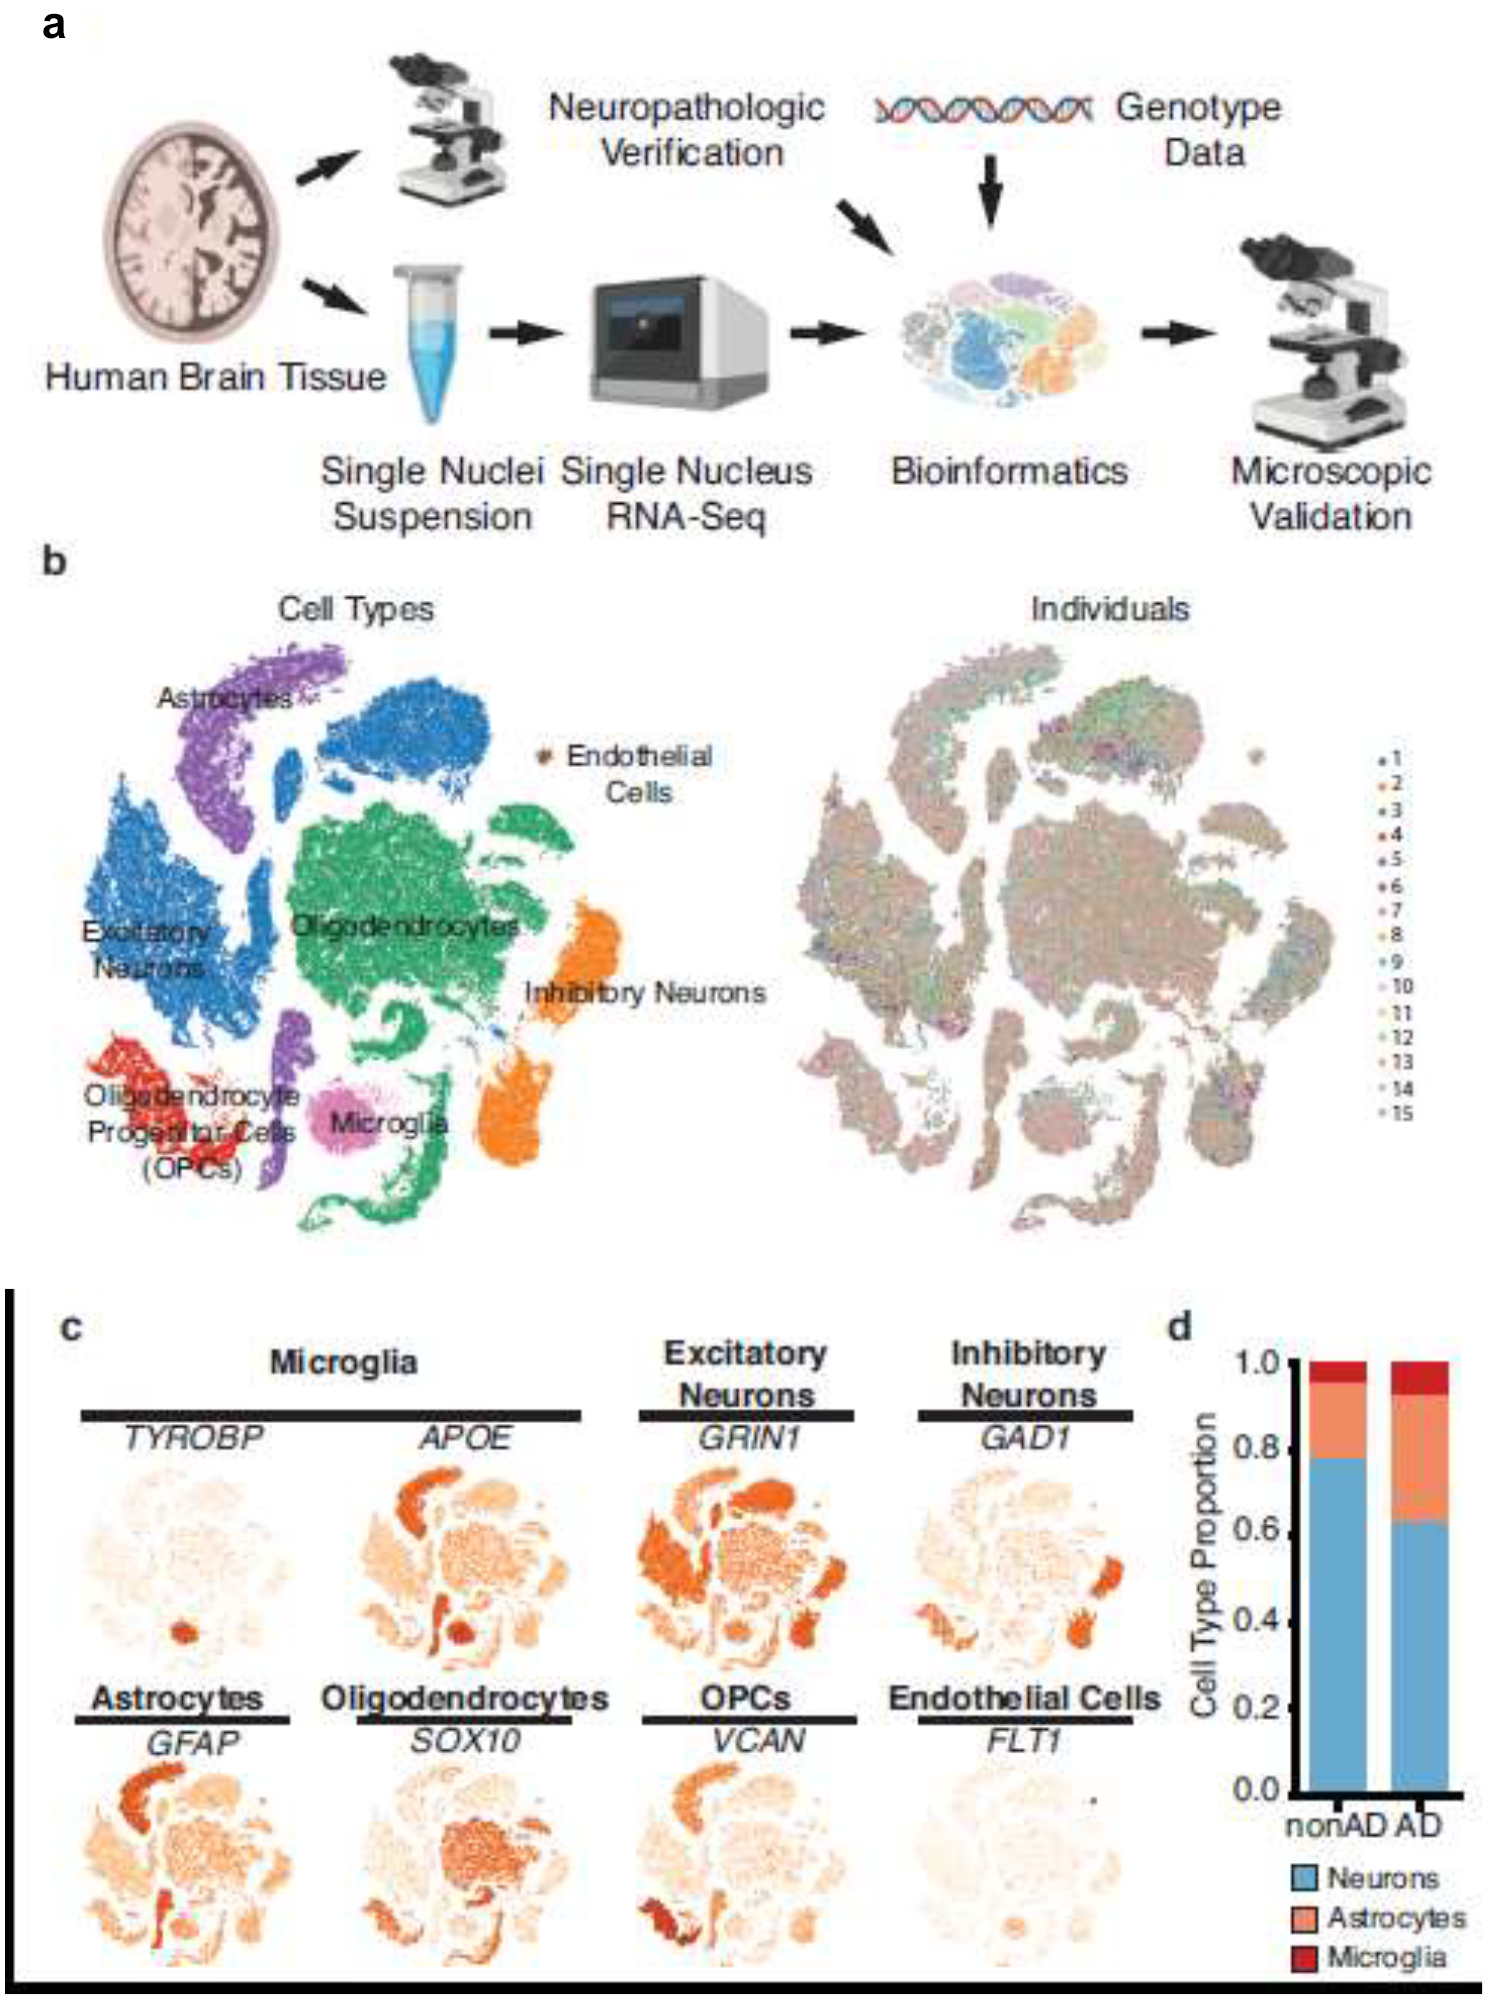
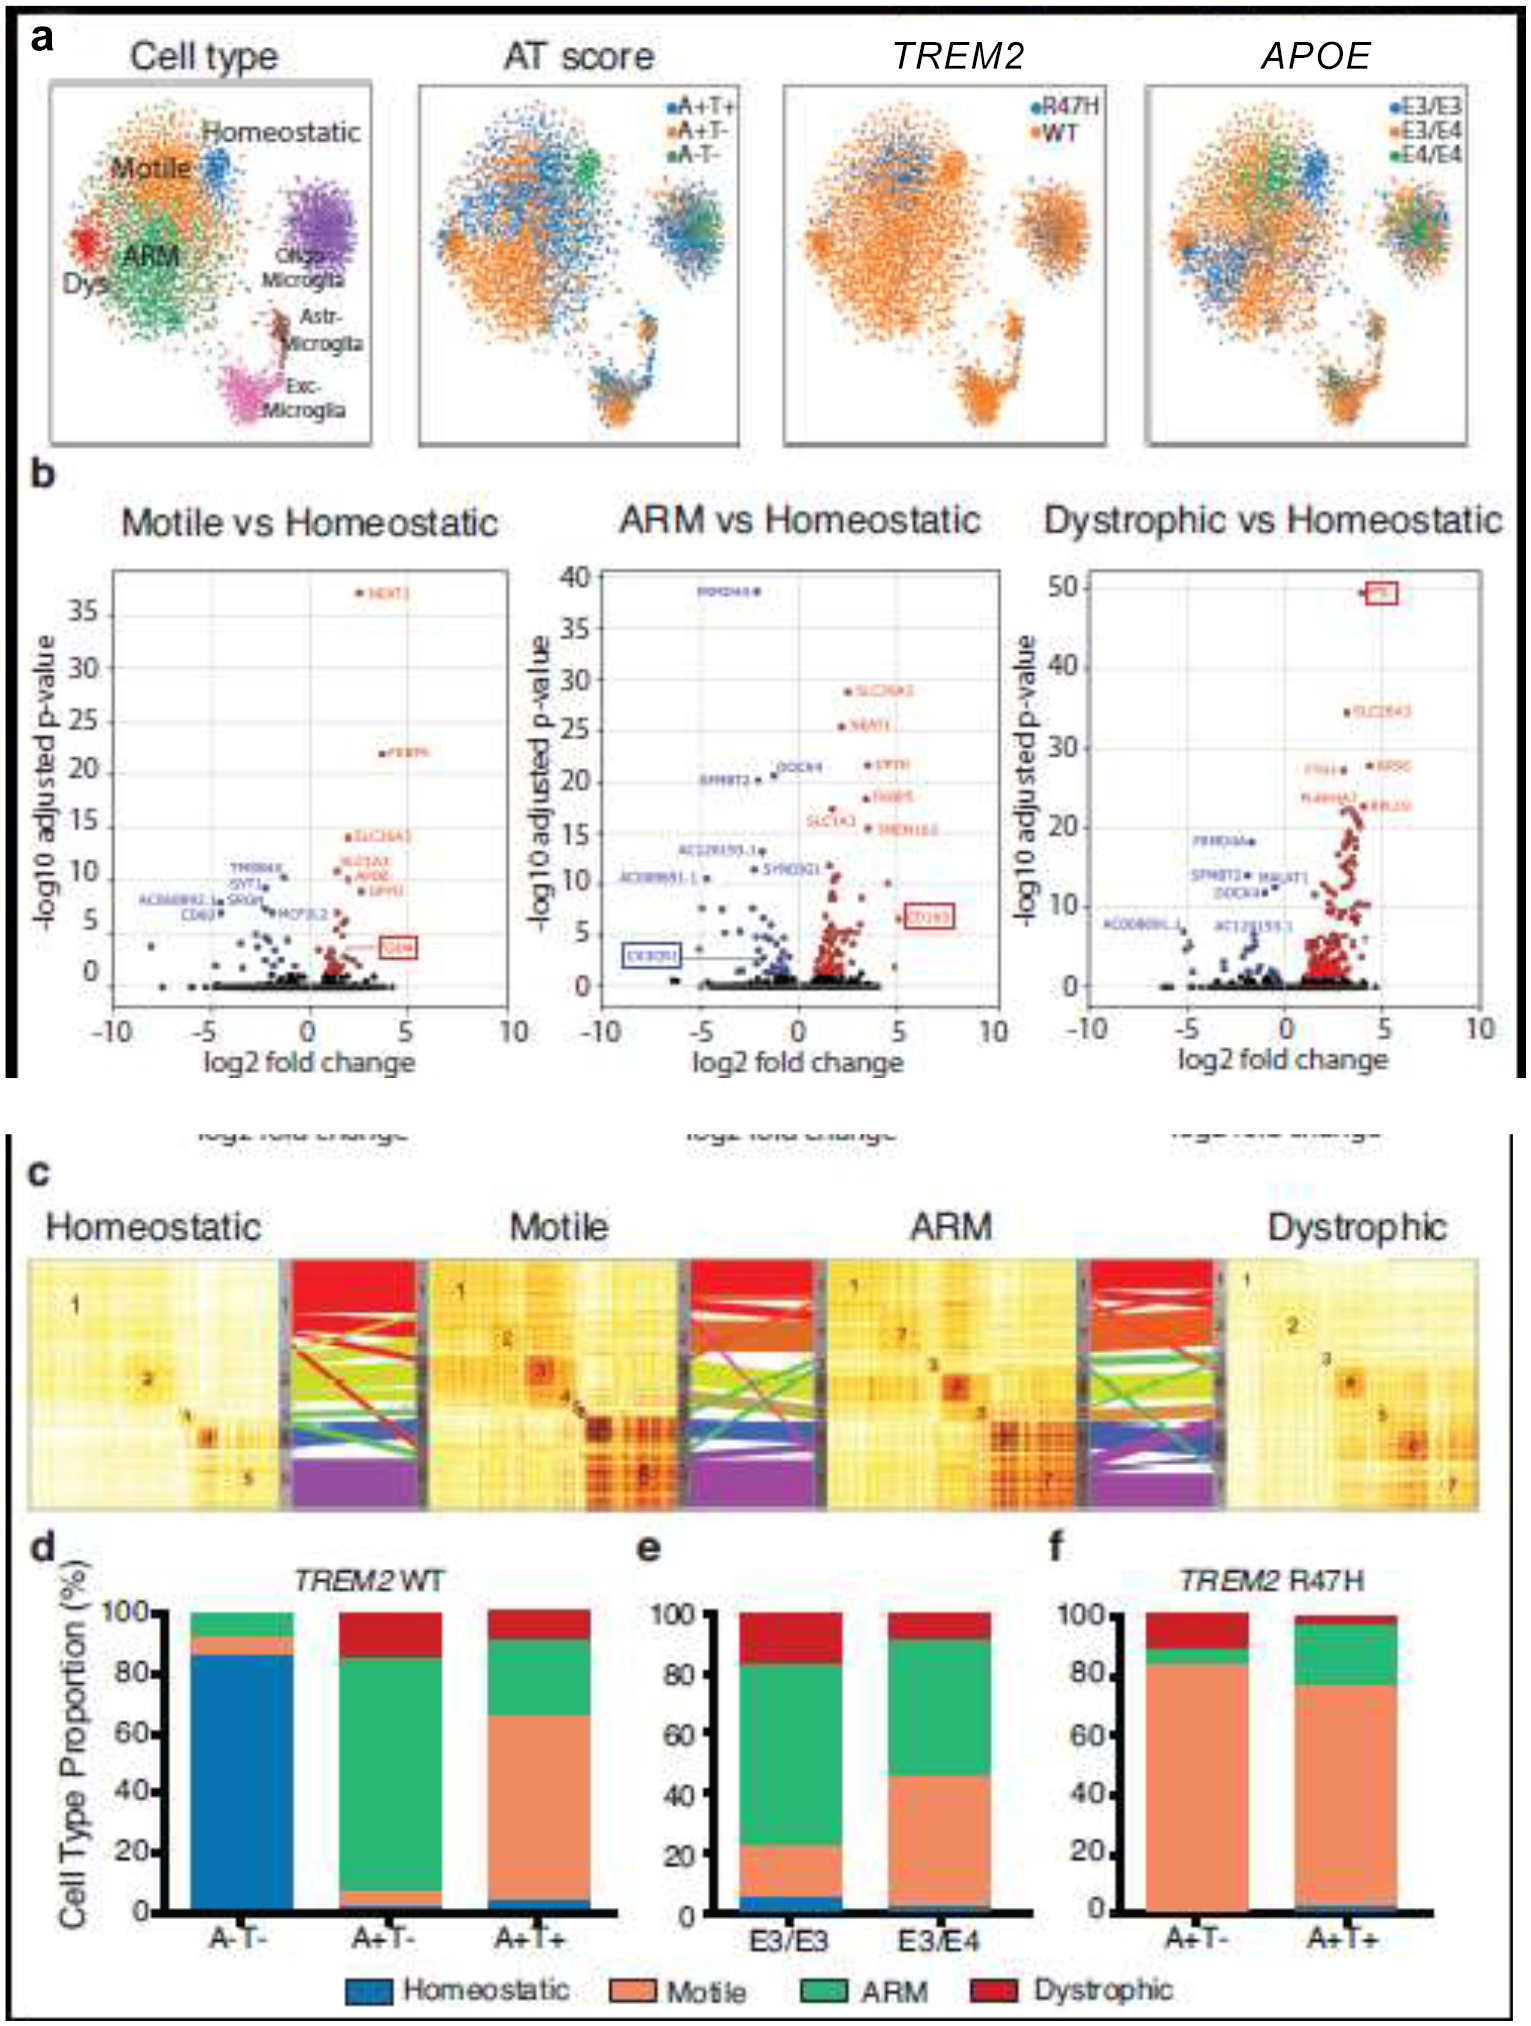
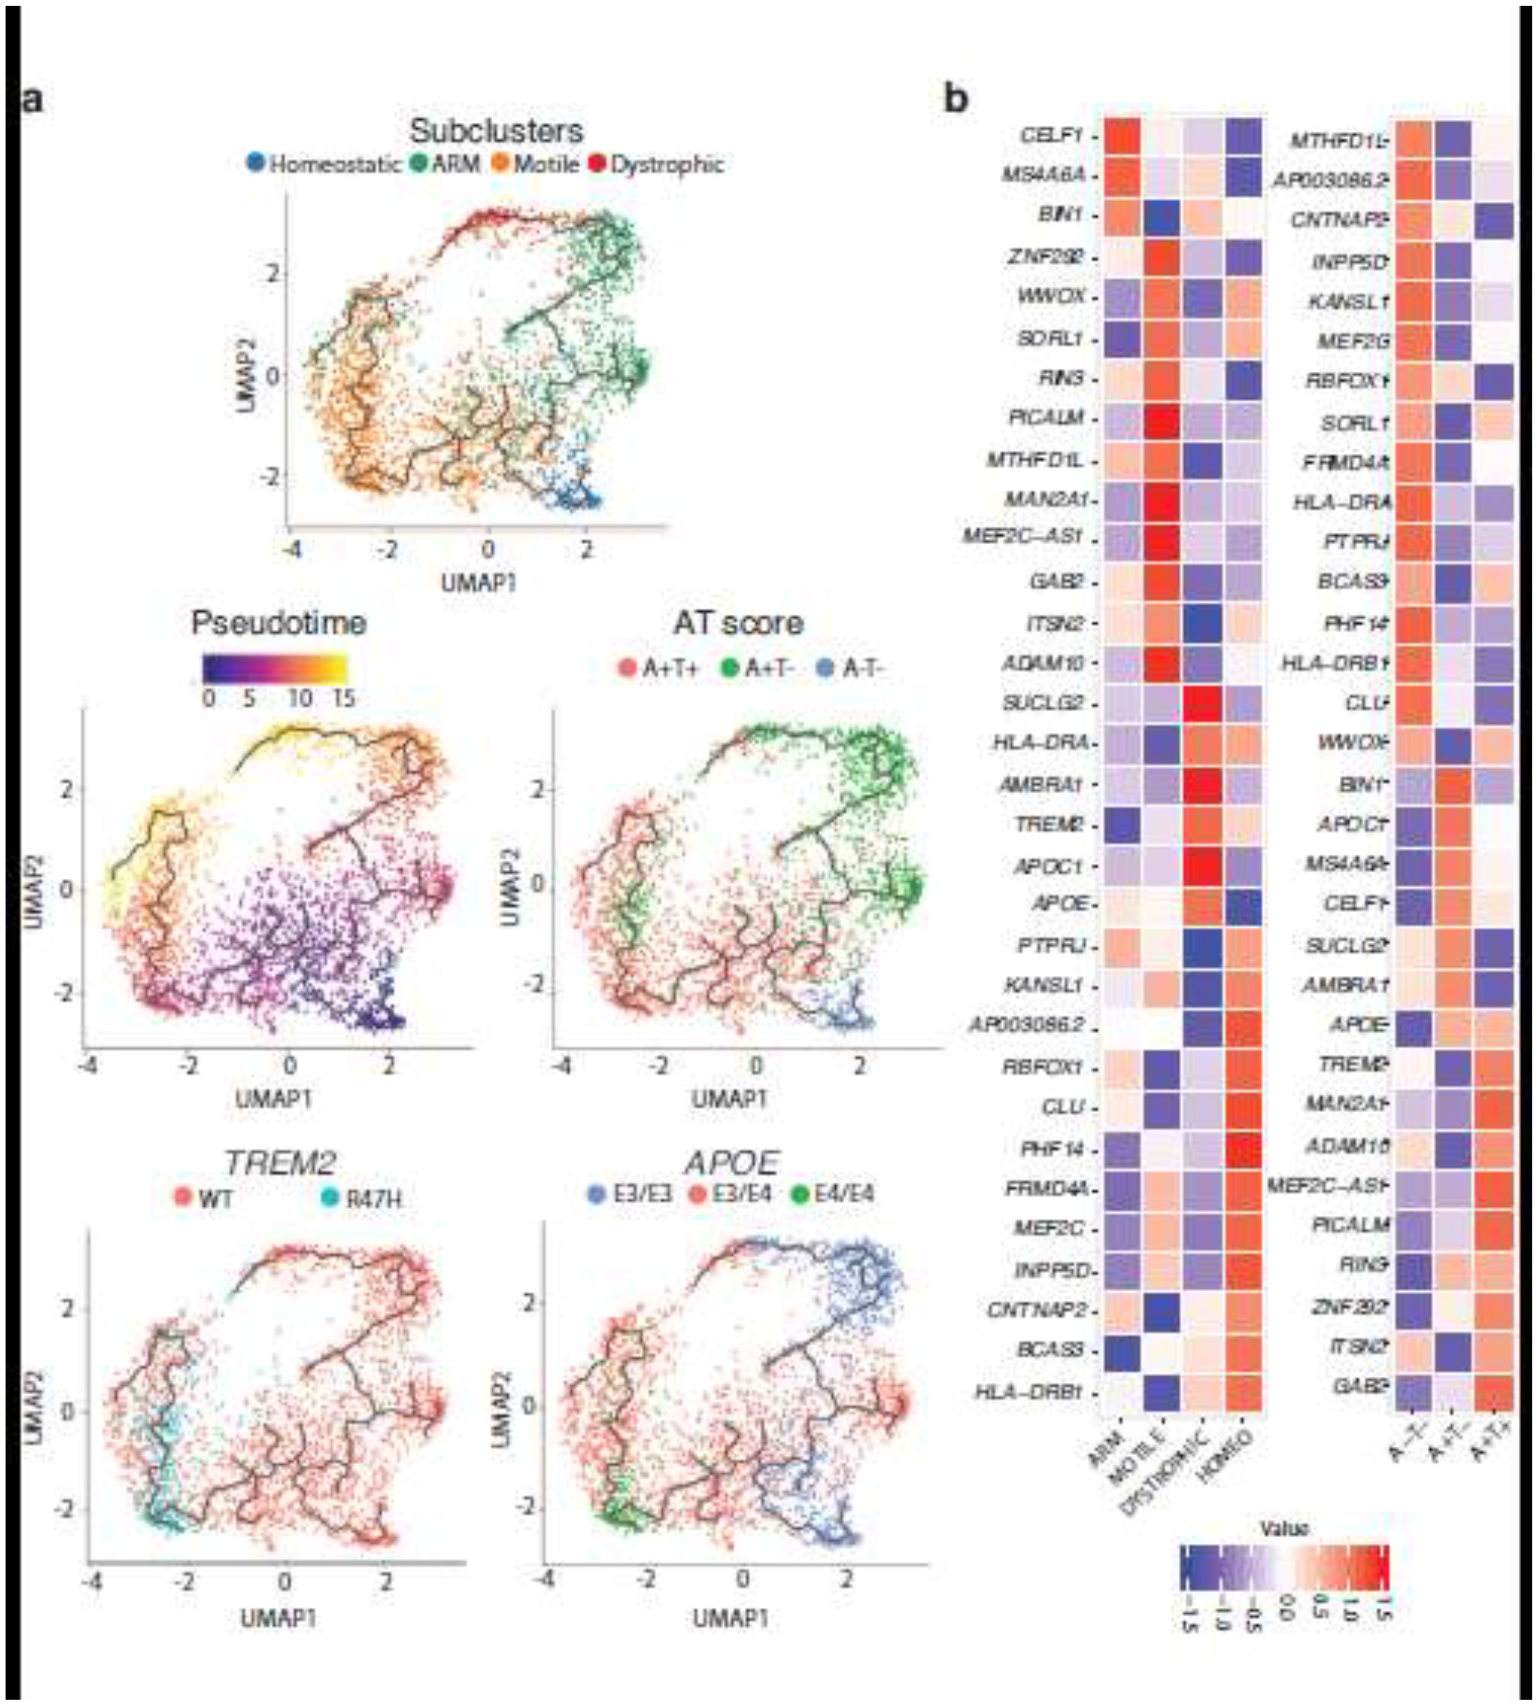
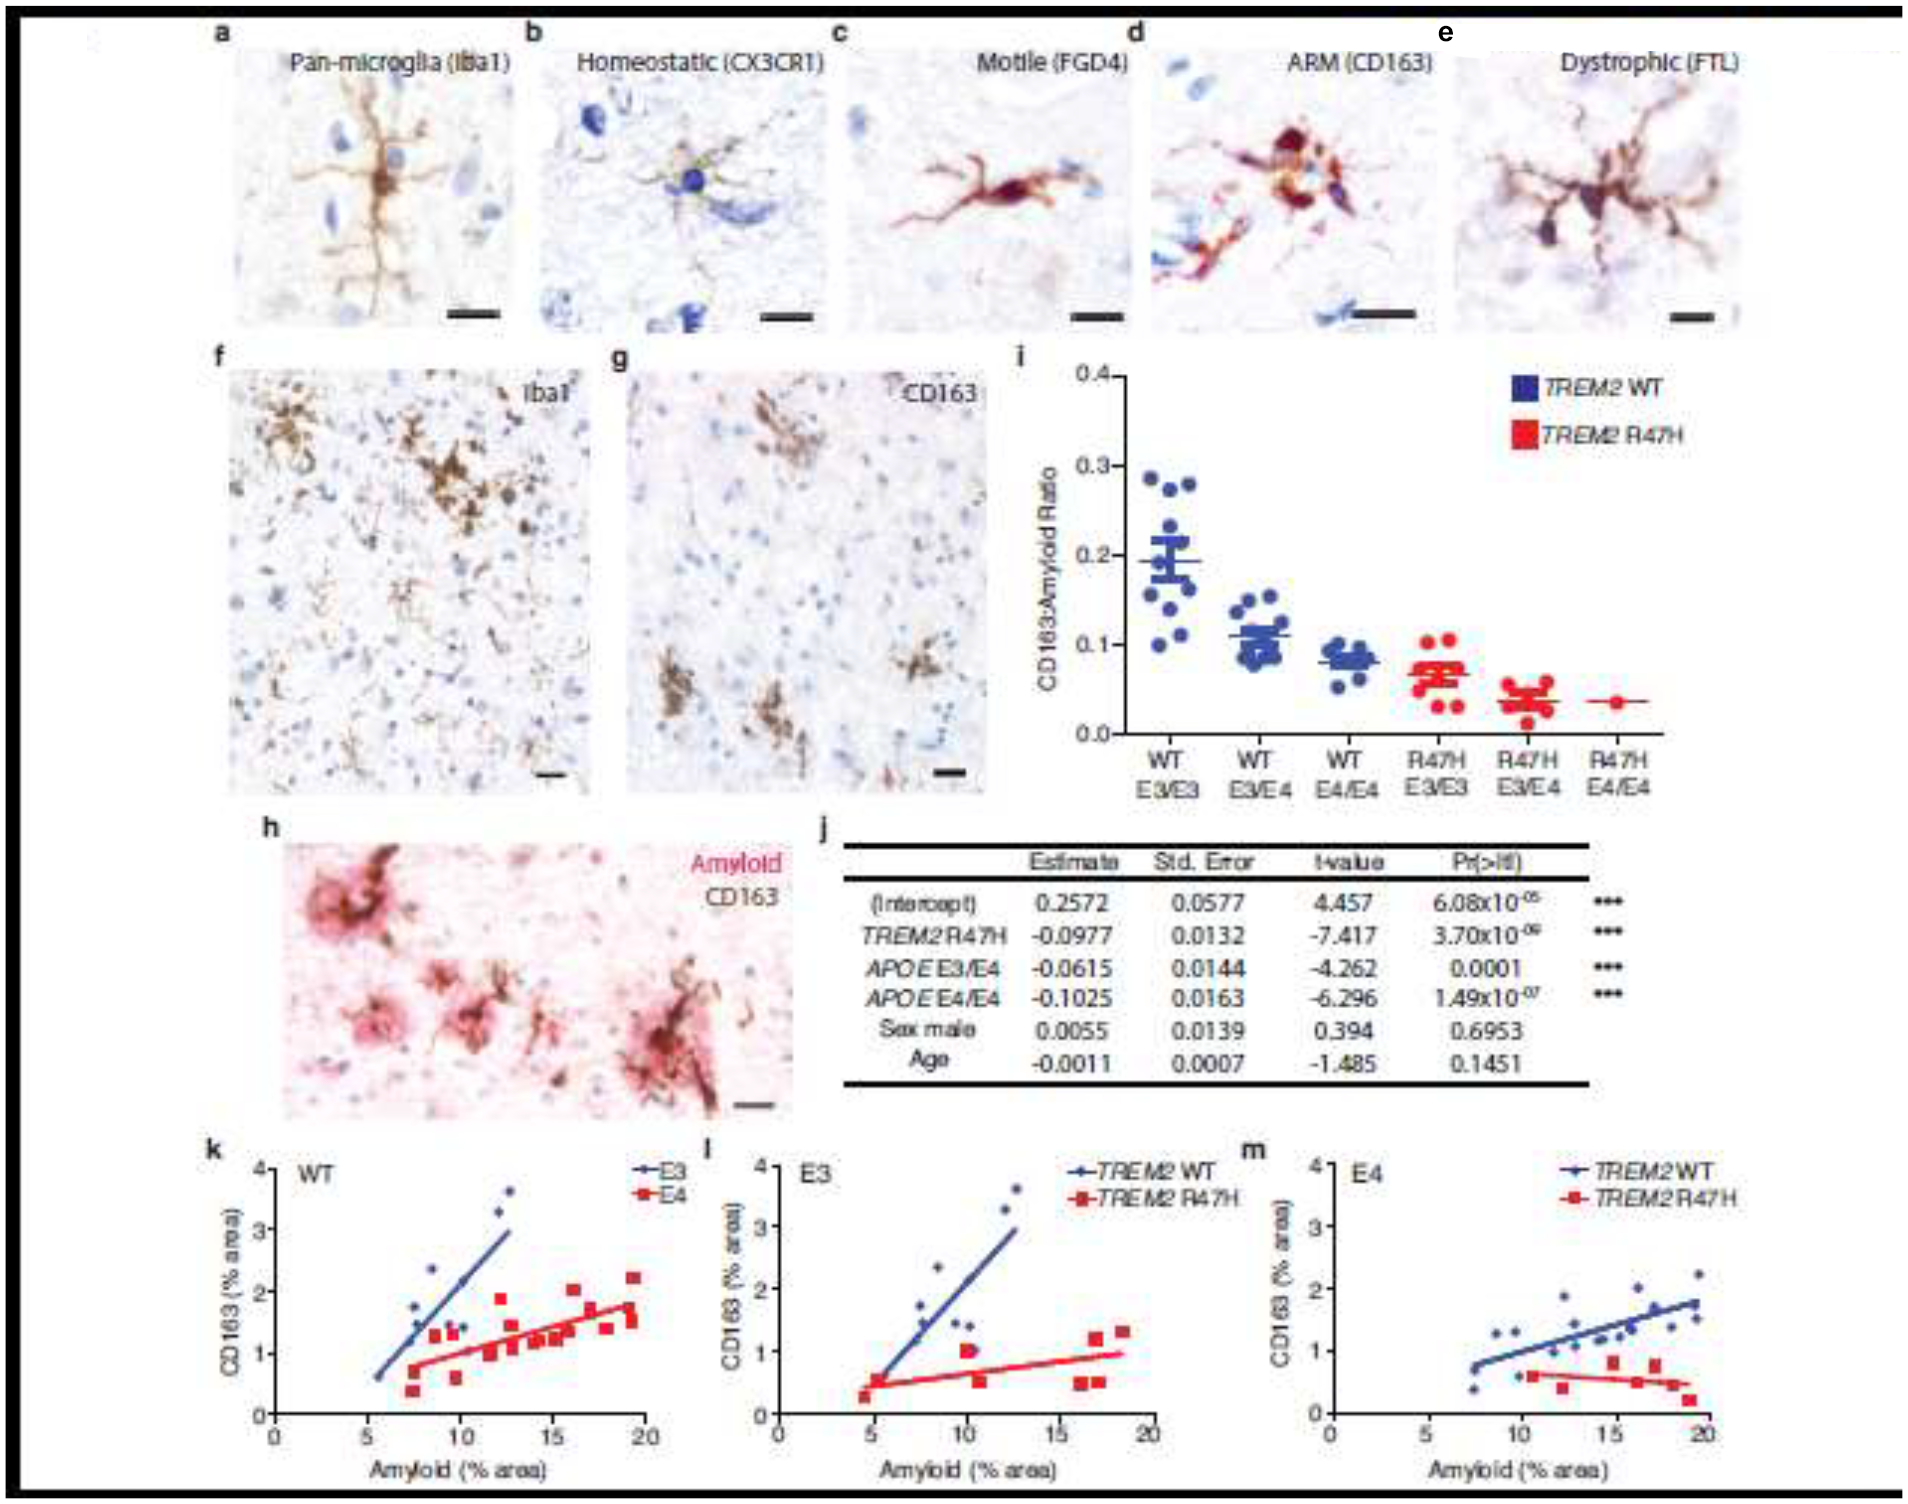
Verification
Claims the paper makes
The claims and statistics of this paper haven’t been checked yet.
Run the check — free, no account needed. It reads the open-access text and checks the sources it cites.
Claims other papers make about this one
Each is checked against this paper’s own text: does it say what the citing paper says it does?
The cited source says what the claim attributes to it.
In the citing paper
“The trajectory of MG-M4, containing CD163 as a hub gene, was consistent with that of DAM-like module MG-M1, and was enriched for processes including phagocytosis, myeloid cell differentiation, and neutrophil activation (Figure 6D); therefore, it is possible that MG-M4 represents an alternative microglial activation module.55”
From hdWGCNA identifies co-expression networks in high-dimensional transcriptomics data (2023) · cites this paper as [55]
The check wasn’t confident either way, so it gives no verdict — never disputed.
In the citing paper
“The trajectory of MG-M4, containing CD163 as a hub gene, was consistent with that of DAM-like module MG-M1, and was enriched for processes including phagocytosis, myeloid cell differentiation, and neutrophil activation (Figure 6D); therefore, it is possible that MG-M4 represents an alternative microglial activation module.55”
From hdWGCNA identifies co-expression networks in high-dimensional transcriptomics data (2023) · cites this paper as [55]
Experimental — accuracy not yet measuredThe check wasn’t confident either way, so it gives no verdict — never disputed.
In the citing paper
“The trajectory of MG-M4, containing CD163 as a hub gene, was consistent with that of DAM-like module MG-M1, and was enriched for processes including phagocytosis, myeloid cell differentiation, and neutrophil activation (Figure 6D); therefore, it is possible that MG-M4 represents an alternative microglial activation module.55”
From hdWGCNA identifies co-expression networks in high-dimensional transcriptomics data (2023) · cites this paper as [55]
Experimental — accuracy not yet measured
Self-check
Percentages, sums and reported differences re-computed from the paper’s own numbers.
The self-check needs the paper’s full text.
Citations
Cites
Fast unfolding of communities in large networks
Blondel, V. D., Guillaume, J.-L., Lambiotte, R., & Lefebvre, E. (2008) · Journal of Statistical Mechanics: Theory and Experiment · doi:10.1088/1742-5468/2008/10/p10008 · Cited by 21,424
The Amyloid Hypothesis of Alzheimer’s Disease: Progress and Problems on the Road to Therapeutics
Hardy, J., & Selkoe, D. J. (2002) · Science · doi:10.1126/science.1072994 · Cited by 13,864
Vos, T., Abajobir, A. A., Abate, K. H., Abbafati, C., Abbas, K. M., Abd-Allah, F., Abdulkader, R. S., Abdulle, A. M., Abebo, T. A., Abera, S. F., et al. (2017) · The Lancet · doi:10.1016/s0140-6736(17)32154-2 · Cited by 13,220
Self-citationNIA‐AA Research Framework: Toward a biological definition of Alzheimer's disease
Jack, C. R., Bennett, D. A., Blennow, K., Carrillo, M. C., Dunn, B., Haeberlein, S. B., Holtzman, D. M., Jagust, W., Jessen, F., Karlawish, J., et al. (2018) · Alzheimer's & Dementia · doi:10.1016/j.jalz.2018.02.018 · Cited by 10,537
Amyloid oligomers exacerbate tau pathology in a mouse model of tauopathy
Selenica, M.-L. B., Brownlow, M., Jimenez, J. P., Lee, D. C., Pena, G., Dickey, C. A., Gordon, M. N., & Morgan, D. (2013) · Neurodegenerative Diseases · doi:10.1159/000337230 · Cited by 10,359
Polazzi, E., Mengoni, I., Caprini, M., Peña‐Altamira, E., Kurtys, E., & Monti, B. (2012) · Neurosignals · doi:10.1159/000337115 · Cited by 9,023
QuPath: Open source software for digital pathology image analysis
Bankhead, P., Loughrey, M. B., Fernández, J. A., Dombrowski, Y., McArt, D. G., Dunne, P. D., McQuaid, S., Gray, R. T., Murray, L. J., Coleman, H. G., et al. (2017) · Scientific Reports · doi:10.1038/s41598-017-17204-5 · Cited by 8,908
SCANPY: large-scale single-cell gene expression data analysis
Wolf, F. A., Angerer, P., & Theis, F. J. (2018) · Genome Biology · doi:10.1186/s13059-017-1382-0 · Cited by 8,881
Trapnell, C., Cacchiarelli, D., Grimsby, J., Pokharel, P., Li, S., Morse, M., Lennon, N. J., Livak, K. J., Mikkelsen, T. S., & Rinn, J. L. (2014) · Nature Biotechnology · doi:10.1038/nbt.2859 · Cited by 7,314
Vos, T., Allen, C., Arora, M., Barber, R. M., Bhutta, Z. A., Brown, A., Carter, A., Casey, D. C., Charlson, F. J., Chen, A. Z., et al. (2016) · The Lancet · doi:10.1016/s0140-6736(16)31678-6 · Cited by 7,253
Research works printed but not linked: 2
- del Rio-Hortega P (1919) El Tercer Elemento de los Centros Nerviosos. IV. Poder Fagocitario y Movilidad de la Microglía. Bol Soc Esp Biol VIII 1919:154–171
- Kristiansen M, Graversen JH, Jacobsen C et al (2001) Identification of the haemoglobin scavenger receptor. Nature 409(6817):198–201. https://doi.org/10.1038/35051594 · DOI · Paper page
Cited by
Sorted by citations
Items 201–258 of 258
Human genetics: Establishment of cause-and-effect relationships
Saido, T. C. (2024) · Elsevier eBooks · doi:10.1016/b978-0-443-28979-8.00013-9
Liu, X., Chen, J., Zhou, S., & Lin, J. (2025) · SSRN Electronic Journal · doi:10.2139/ssrn.5343605
Turri, M., Aubin, M., Aumont, A., Vachon, A., Lopez, J. A., Mayhue, M., Plourde, M., & Fernandes, K. J. L. (2025) · bioRxiv (Cold Spring Harbor Laboratory) · doi:10.1101/2025.08.27.672447
Koivumäki, M., Martiskainen, H., Takalo, M., Lehtisalo, J., Ngandu, T., Snellman, A., Hiltunen, M., & Rinne, J. O. (2025) · doi:10.21203/rs.3.rs-7823342/v1
The Neuroimmune Landscape of the Lysosomal Storage Disorder Sanfilippo Syndrome
Badell‐Grau, R. A., & Schlachetzki, J. C. M. (2025) · BioEssays · doi:10.1002/bies.70083
Zhang, P., Gao, C., Guo, Q., Yang, D., Zhang, G., Lu, H., Zhang, L., Zhang, G., & Li, D. (2024) · Figshare · doi:10.6084/m9.figshare.26726468
Jagadeesan, N., Roules, G. C., Chandrashekar, D. V., Yang, J., Kolluru, S., & Sumbria, R. K. (2024) · Figshare · doi:10.6084/m9.figshare.26694843
Zhang, P., Gao, C., Guo, Q., Yang, D., Zhang, G., Lu, H., Zhang, L., Zhang, G., & Li, D. (2024) · Figshare · doi:10.6084/m9.figshare.26726459
Zhang, P., Gao, C., Guo, Q., Yang, D., Zhang, G., Lu, H., Zhang, L., Zhang, G., & Li, D. (2024) · Figshare · doi:10.6084/m9.figshare.26726483
Zhang, P., Gao, C., Guo, Q., Yang, D., Zhang, G., Lu, H., Zhang, L., Zhang, G., & Li, D. (2024) · Figshare · doi:10.6084/m9.figshare.26726480
Zhang, P., Gao, C., Guo, Q., Yang, D., Zhang, G., Lu, H., Zhang, L., Zhang, G., & Li, D. (2024) · Figshare · doi:10.6084/m9.figshare.26726474
Jagadeesan, N., Roules, G. C., Chandrashekar, D. V., Yang, J., Kolluru, S., & Sumbria, R. K. (2024) · Figshare · doi:10.6084/m9.figshare.26694840
Jagadeesan, N., Roules, G. C., Chandrashekar, D. V., Yang, J., Kolluru, S., & Sumbria, R. K. (2024) · Figshare · doi:10.6084/m9.figshare.26694825
Zhang, P., Gao, C., Guo, Q., Yang, D., Zhang, G., Lu, H., Zhang, L., Zhang, G., & Li, D. (2024) · Figshare · doi:10.6084/m9.figshare.26726489
Wang, X., Xie, Y., Fan, X., Wu, X., Wang, D., & Zhu, L. (2024) · Figshare · doi:10.6084/m9.figshare.26728936
Self-citationZhang, P., Gao, C., Guo, Q., Yang, D., Zhang, G., Lu, H., Zhang, L., Zhang, G., & Li, D. (2024) · Figshare · doi:10.6084/m9.figshare.26726477
Muñoz‐Castro, C., Mejias‐Ortega, M., Sánchez‐Mejías, E., Navarro, V., Trujillo‐Estrada, L., Jiménez, S., León, J. A. G., Fernandez-Valenzuela, J. J., Sanchez-Mico, M. V., Romero‐Molina, C., et al. (2024) · Figshare · doi:10.6084/m9.figshare.26571967
Zhang, P., Gao, C., Guo, Q., Yang, D., Zhang, G., Lu, H., Zhang, L., Zhang, G., & Li, D. (2024) · Figshare · doi:10.6084/m9.figshare.25918980
Zhang, P., Gao, C., Guo, Q., Yang, D., Zhang, G., Lu, H., Zhang, L., Zhang, G., & Li, D. (2024) · Figshare · doi:10.6084/m9.figshare.26726465
Jagadeesan, N., Roules, G. C., Chandrashekar, D. V., Yang, J., Kolluru, S., & Sumbria, R. K. (2024) · Figshare · doi:10.6084/m9.figshare.26694849
Eren, N., Gerike, S., Üsekes, B., Peters, O., Cosma, N.-C., & Hellmann‐Regen, J. (2023) · Figshare · doi:10.6084/m9.figshare.26626993
Jagadeesan, N., Roules, G. C., Chandrashekar, D. V., Yang, J., Kolluru, S., & Sumbria, R. K. (2024) · Figshare · doi:10.6084/m9.figshare.26694861
Jagadeesan, N., Roules, G. C., Chandrashekar, D. V., Yang, J., Kolluru, S., & Sumbria, R. K. (2024) · Figshare · doi:10.6084/m9.figshare.26694837
Jagadeesan, N., Roules, G. C., Chandrashekar, D. V., Yang, J., Kolluru, S., & Sumbria, R. K. (2024) · Figshare · doi:10.6084/m9.figshare.26694834
Zhang, P., Gao, C., Guo, Q., Yang, D., Zhang, G., Lu, H., Zhang, L., Zhang, G., & Li, D. (2024) · Figshare · doi:10.6084/m9.figshare.25919061
Zhang, P., Gao, C., Guo, Q., Yang, D., Zhang, G., Lu, H., Zhang, L., Zhang, G., & Li, D. (2024) · Figshare · doi:10.6084/m9.figshare.26726486
Eren, N., Gerike, S., Üsekes, B., Peters, O., Cosma, N.-C., & Hellmann‐Regen, J. (2024) · Figshare · doi:10.6084/m9.figshare.26626990
Jagadeesan, N., Roules, G. C., Chandrashekar, D. V., Yang, J., Kolluru, S., & Sumbria, R. K. (2024) · Figshare · doi:10.6084/m9.figshare.26694846
Jagadeesan, N., Roules, G. C., Chandrashekar, D. V., Yang, J., Kolluru, S., & Sumbria, R. K. (2024) · Figshare · doi:10.6084/m9.figshare.26694858
Murray, J., Meloni, G., Cortes, E. P., KimSilva, A., Jacobs, M. M., Ramkissoon, A., Crary, J., & Morgello, S. (2022) · Figshare · doi:10.6084/m9.figshare.19728442
Jagadeesan, N., Roules, G. C., Chandrashekar, D. V., Yang, J., Kolluru, S., & Sumbria, R. K. (2024) · Figshare · doi:10.6084/m9.figshare.26694852
Dai, D. L., Li, M., & Lee, E. B. (2024) · Figshare · doi:10.6084/m9.figshare.26608141
Self-citationJagadeesan, N., Roules, G. C., Chandrashekar, D. V., Yang, J., Kolluru, S., & Sumbria, R. K. (2024) · Figshare · doi:10.6084/m9.figshare.26694831
Zhang, P., Gao, C., Guo, Q., Yang, D., Zhang, G., Lu, H., Zhang, L., Zhang, G., & Li, D. (2024) · Figshare · doi:10.6084/m9.figshare.26726462
Wang, X., Liu, L., Jiang, X., Saredy, J., Xi, H., Cueto, R., Sigler, D., Khan, M., Wu, S., Ji, Y., et al. (2023) · Figshare · doi:10.6084/m9.figshare.24240230
Self-citationWang, X., Xie, Y., Fan, X., Wu, X., Wang, D., & Zhu, L. (2024) · Figshare · doi:10.6084/m9.figshare.26728939
Self-citationSnellman, A., Ekblad, L. L., Tuisku, J., Koivumäki, M., Ashton, N. J., Lantero‐Rodriguez, J., Karikari, T. K., Helin, S., Bucci, M., Löyttyniemi, E., et al. (2023) · Figshare · doi:10.6084/m9.figshare.22620676
Jagadeesan, N., Roules, G. C., Chandrashekar, D. V., Yang, J., Kolluru, S., & Sumbria, R. K. (2024) · Figshare · doi:10.6084/m9.figshare.26694828
Dai, D. L., Li, M., & Lee, E. B. (2024) · Figshare · doi:10.6084/m9.figshare.26608144
Self-citationZhang, P., Gao, C., Guo, Q., Yang, D., Zhang, G., Lu, H., Zhang, L., Zhang, G., & Li, D. (2024) · Figshare · doi:10.6084/m9.figshare.26726471
Jagadeesan, N., Roules, G. C., Chandrashekar, D. V., Yang, J., Kolluru, S., & Sumbria, R. K. (2024) · Figshare · doi:10.6084/m9.figshare.26694855
Al-Juhaishi, M. H. K., Al-Juhaishi, N. M. H., & Al-Juhaishi, A. M. H. (2024) · Neurophysiology · doi:10.1007/s11062-025-09989-3
Cannabinoids as modulators for Alzheimer’s disease: a role for microglia?
Vecchiarelli, H. A. (2026) · Elsevier eBooks · doi:10.1016/b978-0-443-27340-7.00002-4
Generalized SIMEX Method: Polynomial Approximation for Extrapolation
Chen, L., & Zhang, Q. (2026) · Statistics in Medicine · doi:10.1002/sim.70460
Mechanisms controlling microglial colonization of the forebrain
Bridlance, C. (2023) · theses.fr (ABES) · doi:10.70675/5879aa36z8649z48f9zb359zf349ce3cb429
Han, G., Yuan, A., Oware, K. D., Wright, F. A., Carroll, R. J., Smith, M. H., Ory, M. G., Yan, D., Wang, W., Sun, Z., et al. (2026) · medRxiv · doi:10.64898/2026.04.17.26351142
Zhang, B., Zhao, R., Li, X.-Y., Wei, Z.-H., Wang, D.-M., & Lu, M.-H. (2026) · Experimental Neurology · doi:10.1016/j.expneurol.2026.115845
Kim, D., Kim, Y. S., & Jeong, B. (2026) · Alzheimer s & Dementia Translational Research & Clinical Interventions · doi:10.1002/trc2.70288
Wang, H., Wen, R., Parker, E., & Yang, L. (2026) · Cell Communication and Signaling · doi:10.1186/s12964-026-03083-9 · Cited by 3
Yang, G., Xu, X., & Xu, Y. (2026) · Frontiers in Immunology · doi:10.3389/fimmu.2026.1893545
Decoding TREM2: A microglial receptor governing the fate of myelin
Zhang, Z., Zhang, W., Jin, L., Wei, C., Chen, H., 程相树, & Wei, J. (2026) · Cellular Signalling · doi:10.1016/j.cellsig.2026.112815
Wu, Y., Duan, L., Zhang, L., Wang, S., Yan, H., He, M., Wang, T., Li, L., & Gao, Y. (2026) · Frontiers in Immunology · doi:10.3389/fimmu.2026.1912989
Wang, Z., Liu, M., Xu, J., Liu, Y., & Liu, T. (2026) · Neuroreport · doi:10.1097/wnr.0000000000002307
Liu, A., Xing, L., Li, J., Gao, W., Yao, M., Song, J., & Li, H. (2026) · Ageing Research Reviews · doi:10.1016/j.arr.2026.103352
Jeong, H., Kang, Y., Jeong, S., Yoo, J. M., Choi, Y. S., Kwon, S. H., Hwang, H., Nahm, M., & Kim, D. (2026) · Nanomaterials · doi:10.3390/nano16181158
TREM2-directed therapy in Alzheimer’s disease: from therapeutic window to clinical translation
Kuang, Q., Li, S., Huang, W., Kuang, N., Liu, T., Huang, N., Luo, Y., & Huang, J. (2026) · Frontiers in Aging Neuroscience · doi:10.3389/fnagi.2026.1938062
Alzheimer's Disease Beyond Amyloid: Lessons From Atherosclerosis
Ciaccio, M., & Agnello, L. (2026) · Annals of Clinical and Translational Neurology · doi:10.1002/acn3.70533
Endocannabinoid regulation of microglia–astrocyte crosstalk in Alzheimer’s disease
Rao, J. S., Tangarife, M. A., Rodríguez‐Soacha, D. A., & Mukunda, R. (2026) · Academia Drug Development and Pharmacotherapy · doi:10.20935/acaddrug8564
Metadata
- Authors
- Nguyen, A. T., Wang, K., Hu, G., Wang, X., Miao, Z., Azevedo, J. A., Suh, E., Van Deerlin, V. M., Choi, D., Roeder, K., Li, M., & Lee, E. B.
- Affiliations
- University of Pennsylvania (US)
- Nankai University (CN)
- Carnegie Mellon University (US)
- Corresponding author
- Li, Mingyao
- Lee, Edward B.
- ORCID
- Venue
- Acta Neuropathologica
- Published
- 2020-08-25
- Volume
- 140
- Issue
- 4
- Pages
- 477-493
- ISSN
- 0001-6322 (ISSN-L)
- 1432-0533
- PMC
- PMC7520051
- OpenAlex
- W3080402156
- Cited by
- 241
- References
- 79
- Citations by year
- 2026: 33 · 2025: 39 · 2024: 67 · 2023: 43 · 2022: 32 · 2021: 23 · 2020: 2
- FWCI
- 9.51
- Type
- journal article
- Language
- en
- Update notices
- correction (2023-08-17)
- Open access
- green
- europepmc.org
- Licence
- Locations
- Acta Neuropathologica (publishedVersion)
- PubMed (publishedVersion)
- Europe PMC (PubMed Central) (acceptedVersion, cc-by)
- PubMed Central (acceptedVersion, cc-by)
- Funders
- National Institutes of Health (R01NS095793, R56AG063344, P30AG010124, T32AG000255, R01GM108600, R01GM125301, R37MH05788)
- University of Pennsylvania Institute on Aging Pilot Grant (Pilot Grant)
- Topics
- Life Sciences › Neuroscience › Neurology › Neuroinflammation and Neurodegeneration Mechanisms
- Life Sciences › Neuroscience › Cellular and Molecular Neuroscience › Alzheimer's disease research and treatments
- Health Sciences › Medicine › Psychiatry and Mental health › Dementia and Cognitive Impairment Research
- Keywords
- Alzheimer's disease, apolipoprotein E, TREM2, amyloid-beta, microglial subpopulations, CD163, genetic risk variants, single-nucleus RNA sequencing, postmortem brain
- MeSH terms
- Alzheimer Disease, Apolipoproteins E, Humans, Membrane Glycoproteins, Receptors, Immunologic, Amyloid beta-Peptides, Microglia
About these checks
Registry, retraction, Cites and statistics results are computed, not judged, with one exception: a printed reference that no index lists is read once by a model before it counts as a citation error. Claims are extracted by a model and kept only when their quote appears verbatim in the text; each cited source is then checked, with a model’s help, for whether it says what the claim relies on. Those verdicts can be wrong — read the claim’s quote and the cited source before relying on one.
Statistics and arithmetic are recomputed, not judged.
Confidence bands are shown only for fields calibrated on our annotated test set. None is calibrated yet, so no band is shown.
What counts as a claim ›How we measure confidence ›How we check this ›
Are you an author, or do you see a problem with this page? Request a review
