

The DOI matches its Crossref record; 81 of the 81 references it cites were found in a registry or an index.
Diverse human astrocyte and microglial transcriptional responses to Alzheimer’s pathology
Open accessPublished version of a preprint
Abstract
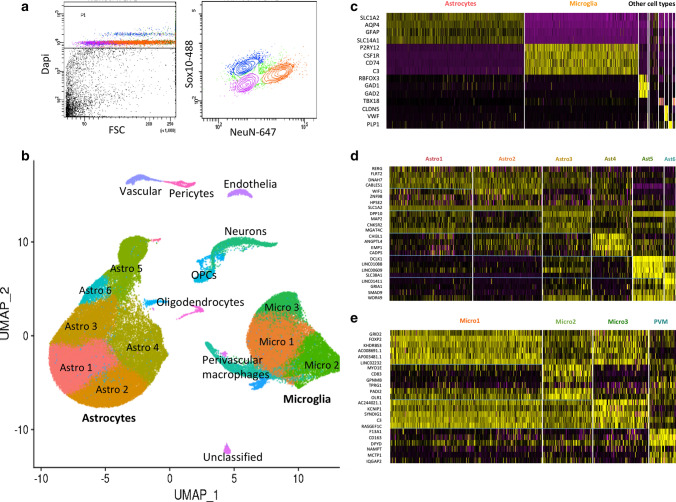
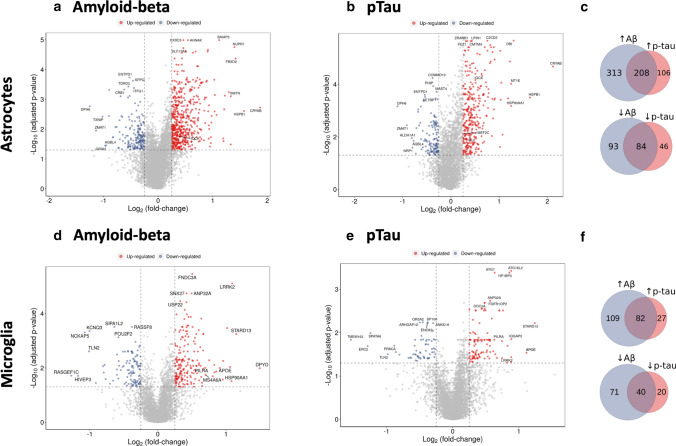
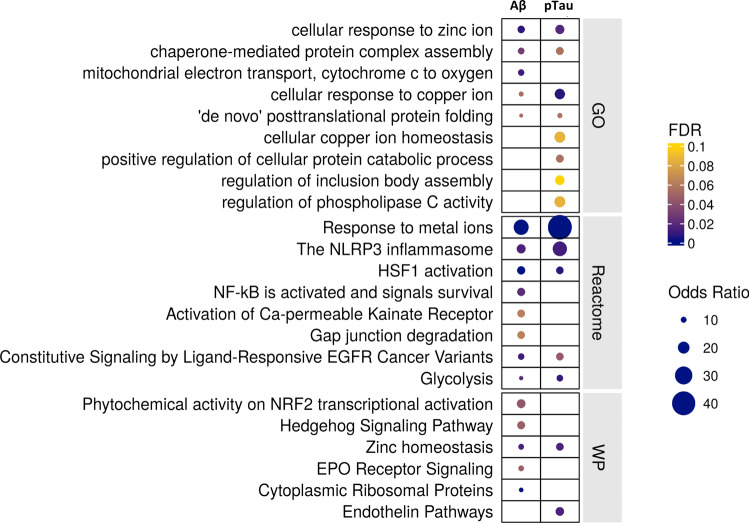
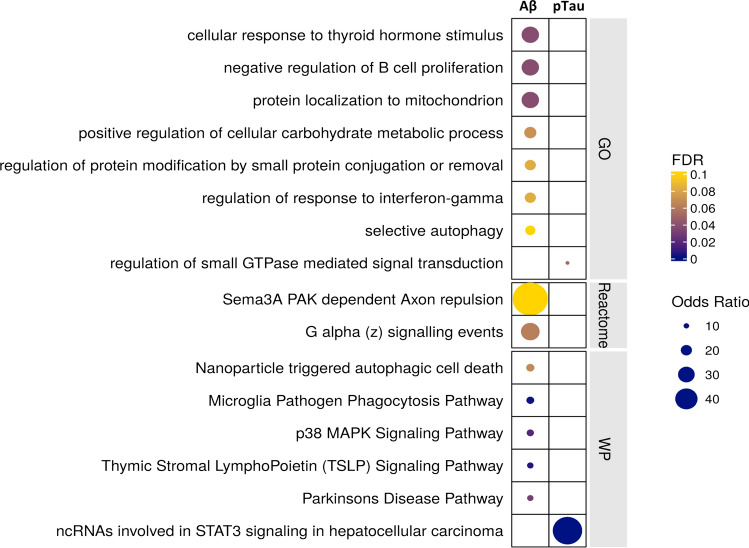
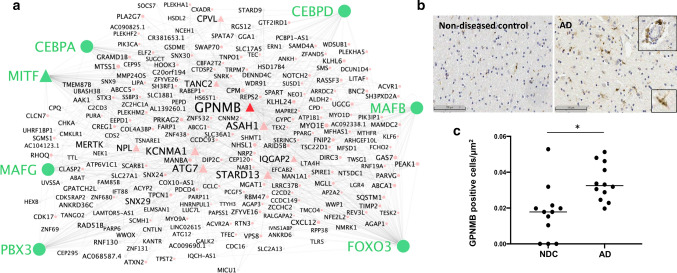
To better define roles that astrocytes and microglia play in Alzheimer’s disease (AD), we used single-nuclei RNA-sequencing to comprehensively characterise transcriptomes in astrocyte and microglia nuclei selectively enriched during isolation post-mortem from neuropathologically defined AD and control brains with a range of amyloid-beta and phospho-tau (pTau) pathology. Significant differences in glial gene expression (including AD risk genes expressed in both the astrocytes [ CLU , MEF2C , IQCK ] and microglia [ APOE , MS4A6A , PILRA ]) were correlated with tissue amyloid or pTau expression. The differentially expressed genes were distinct between with the two cell types and pathologies, although common (but cell-type specific) gene sets were enriched with both pathologies in each cell type. Astrocytes showed enrichment for proteostatic, inflammatory and metal ion homeostasis pathways. Pathways for phagocytosis, inflammation and proteostasis were enriched in microglia and perivascular macrophages with greater tissue amyloid, but IL1-related pathway enrichment was found specifically in association with pTau. We also found distinguishable sub-clusters in the astrocytes and microglia characterised by transcriptional signatures related to either homeostatic functions or disease pathology. Gene co-expression analyses revealed potential functional associations of soluble biomarkers of AD in astrocytes ( CLU ) and microglia ( GPNMB ). Our work highlights responses of both astrocytes and microglia for pathological protein clearance and inflammation, as well as glial transcriptional diversity in AD.
Overview
The claims and statistics of this paper haven’t been checked yet.
Run the check — free, no account needed. It reads the open-access text and checks the sources it cites.
Integrity signals
Registry
Cites
Statistics
Figures
Verification
Claims the paper makes
The claims and statistics of this paper haven’t been checked yet.
Run the check — free, no account needed. It reads the open-access text and checks the sources it cites.
Claims other papers make about this one
Each is checked against this paper’s own text: does it say what the citing paper says it does?
The cited source doesn’t support the claim as written.
In the citing paper
“resulting in over 100,000 astrocyte nuclei in each brain region with ≈6,000 average total number of reads and ≈2,500 average total number of genes detected, which is orders of magnitude higher than previous studies9–15”
From Astrocyte transcriptomic changes along the spatiotemporal progression of Alzheimer’s disease (2024) · cites this paper as [15]
Checked by a reasoning model — may be wrong.
Experimental — accuracy not yet measuredThe source backs part of the claim, not all of it — or backs it for a different population, condition or comparison.
In the citing paper
“may have confounded previous studies that compared only control and severe AD donors or grouped late- and end-stage donors (Braak stage V/VI) together9–15”
From Astrocyte transcriptomic changes along the spatiotemporal progression of Alzheimer’s disease (2024) · cites this paper as [15]
Experimental — accuracy not yet measuredThe cited source says what the claim attributes to it.
In the citing paper
“We found increased numbers of senescence genes upregulated in both microglia (YPEL3, IQGAP2, SQSTM1) and astrocytes (GLB1, SQSTM1, MRAS) with greater levels of tissue β-amyloid densities [66] (Supplementary Fig. 7a, b, Supplementary data S7).”
From Characterisation of premature cell senescence in Alzheimer's disease using single nuclear transcriptomics (2024) · cites this paper as [66]
The cited source says what the claim attributes to it.
In the citing paper
“Finally, we also explored senescence pathway expression in the six astroglial sub-populations that we described previously [66], but did not find that any of these sub-populations showed greater expression of the senescence gene set with AD (Fig. 6c, d, Supplementary Fig. 10c).”
From Characterisation of premature cell senescence in Alzheimer's disease using single nuclear transcriptomics (2024) · cites this paper as [66]
The cited source says what the claim attributes to it.
In the citing paper
“our sample sizes are similar to those reported in previous publications9–17”
From Astrocyte transcriptomic changes along the spatiotemporal progression of Alzheimer’s disease (2024) · cites this paper as [15]
In the citing paper
“The study found that microglial transcripts were most highly positively associated with tissue Aβ and tissue pTau density.”
From Microglia in neurodegenerative diseases: mechanism and potential therapeutic targets (2023) · cites this paper as [145]
Self-check
Percentages, sums and reported differences re-computed from the paper’s own numbers.
The self-check needs the paper’s full text.
Citations
Cites
Controlling the False Discovery Rate: A Practical and Powerful Approach to Multiple Testing
Benjamini, Y., & Hochberg, Y. (1995) · Journal of the Royal Statistical Society Series B: Statistical Methodology · doi:10.1111/j.2517-6161.1995.tb02031.x · Cited by 109,482
Cytoscape: A software Environment for integrated models of biomolecular interaction networks
Shannon, P., Markiel, A., Ozier, O., Baliga, N. S., Wang, J. T., Ramage, D., Amin, N., Schwikowski, B., & Ideker, T. (2003) · Genome Research · doi:10.1101/gr.1239303 · Cited by 51,888
limma powers differential expression analyses for RNA-sequencing and microarray studies
Ritchie, M. E., Phipson, B., Wu, D., Hu, Y., Law, C. W., Shi, W., & Smyth, G. K. (2015) · Nucleic Acids Research · doi:10.1093/nar/gkv007 · Cited by 40,458
Comprehensive Integration of Single-Cell Data
Stuart, T., Butler, A., Hoffman, P., Hafemeister, C., Papalexi, E., Mauck, W. M., Hao, Y., Stoeckius, M., Smibert, P., & Satija, R. (2019) · Cell · doi:10.1016/j.cell.2019.05.031 · Cited by 15,453
Inference and analysis of cell-cell communication using CellChat
Jin, S., Guerrero-Juarez, C. F., Zhang, L., Chang, I., Ramos, R., Kuan, C.-H., Myung, P., Plikus, M. V., & Nie, Q. (2021) · Nature Communications · doi:10.1038/s41467-021-21246-9 · Cited by 8,409
Neurotoxic reactive astrocytes are induced by activated microglia
Liddelow, S. A., Guttenplan, K. A., Clarke, L. E., Bennett, F. C., Bohlen, C. J., Schirmer, L., Bennett, M. L., Münch, A. E., Chung, W.-S., Peterson, T. C., et al. (2017) · Nature · doi:10.1038/nature21029 · Cited by 7,971
Enrichr: interactive and collaborative HTML5 gene list enrichment analysis tool
Chen, E. Y., Tan, C. M., Kou, Y., Duan, Q., Wang, Z., Meirelles, G. V., Clark, N. R., & Ma’ayan, A. (2013) · BMC Bioinformatics · doi:10.1186/1471-2105-14-128 · Cited by 7,814
Scenic: single-cell regulatory network inference and clustering.
Aibar, S., González-Blas, C. B., Moerman, T., Huynh-Thu, V. A., Imrichova, H., Hulselmans, G., Rambow, F., Marine, J.-C., Geurts, P., Aerts, J., et al. (2017) · Nature Methods · doi:10.1038/nmeth.4463 · Cited by 6,520
From Louvain to Leiden: guaranteeing well-connected communities
Traag, V. A., Waltman, L., & van Eck, N. J. (2019) · Scientific Reports · doi:10.1038/s41598-019-41695-z · Cited by 5,635 · cited 1×
“Sample integration was performed using Liger [72] and dimension reduction using PCA and UMAP, and finally, clustering was performed using the Leiden algorithm [65].”
MethodA Unique Microglia Type Associated with Restricting Development of Alzheimer’s Disease
Keren-Shaul, H., Spinrad, A., Weiner, A., Matcovitch-Natan, O., Dvir-Szternfeld, R., Ulland, T. K., David, E., Baruch, K., Lara-Astaiso, D., Toth, B., et al. (2017) · Cell · doi:10.1016/j.cell.2017.05.018 · Cited by 5,493 · cited 11×
“Our data show that this transcriptional functional diversity reflects distinguishable sub-types of human astrocytes and microglia enriched in gene sets related to (but distinct from) those previously described in transgenic amyloid or tau mouse models or with ageing [19, 27, 43, 48].”
BackgroundInfluential
Cited by
Sorted by citations
Microglia in neurodegenerative diseases: mechanism and potential therapeutic targets
Gao, C., Jiang, J., Tan, Y., & Chen, S. (2023) · Signal Transduction and Targeted Therapy · doi:10.1038/s41392-023-01588-0 · Cited by 1,616
“145 These results suggest that microglia respond to the pathology of AD.”
Neuroinflammation in Alzheimer disease
Heneka, M. T., van der Flier, W. M., Jessen, F., Hoozemanns, J., Thal, D. R., Boche, D., Brosseron, F., Teunissen, C., Zetterberg, H., Jacobs, A. H., et al. (2025) · Nature Reviews Immunology · doi:10.1038/s41577-024-01104-7 · Cited by 638
“Nevertheless, isolation of microglial cells from AD brains and subsequent analysis of the transcriptome has provided important insights into microglial cell activation states 220,222 .”
Nutma, E., Fancy, N. N., Weinert, M., Tsartsalis, S., Marzin, M. C., Muirhead, R. C. J., Falk, I. N., Breur, M., de Bruin, J., Hollaus, D., et al. (2023) · Nature Communications · doi:10.1038/s41467-023-40937-z · Cited by 204
“Quality control, sampleintegration, dimension reduction and clustering were performed using default parameters as previously described 41,83 .”
InfluentialSelf-citationDolan, M.-J., Therrien, M., Jereb, S., Kamath, T., Gazestani, V., Atkeson, T., Marsh, S. E., Goeva, A., Lojek, N. M., Murphy, S., et al. (2023) · Nature Immunology · doi:10.1038/s41590-023-01558-2 · Cited by 185
Human Microglia Show Unique Transcriptional Changes in Alzheimer's Disease
Prater, K. E., Green, K. J., Mamde, S., Sun, W., Cochoit, A., Smith, C. L., Chiou, K. L., Heath, L., Rose, S. E., Wiley, J., et al. (2023) · Nature Aging · doi:10.1038/s43587-023-00424-y · Cited by 164
Metadata
- Authors
- Smith, A. M., Davey, K., Tsartsalis, S., Khozoie, C., Fancy, N., Tang, S. S., Liaptsi, E., Weinert, M., McGarry, A., Muirhead, R. C. J., Gentleman, S., Owen, D. R., & Matthews, P. M.
- Affiliations
- Hammersmith Hospital (GB)
- University of Geneva (CH)
- Corresponding author
- Matthews, Paul M.
- ORCID
- Venue
- Acta Neuropathologica
- Published
- 2021-11-12
- Volume
- 143
- Issue
- 1
- Pages
- 75-91
- ISSN
- 0001-6322 (ISSN-L)
- 1432-0533
- PMC
- PMC8732962
- OpenAlex
- W3214651914
- Cited by
- 209
- References
- 81
- Citations by year
- 2026: 43 · 2025: 41 · 2024: 50 · 2023: 49 · 2022: 24 · 2021: 1
- FWCI
- 21.05
- Type
- journal article
- Language
- en
- Open access
- hybrid
- doi.org
- Locations
- Acta Neuropathologica (publishedVersion, cc-by)
- bioRxiv (Cold Spring Harbor Laboratory) (acceptedVersion, cc-by-nc-nd)
- PubMed Central (publishedVersion, cc-by)
- PubMed (publishedVersion)
- Archive ouverte UNIGE (University of Geneva) (publishedVersion, other-oa)
- Archive ouverte UNIGE (University of Geneva) (submittedVersion, cc-by)
- Funders
- National Science Foundation
- Alzheimer's Society
- National Institute for Health and Care Research (NIHR202376, NF-SI-0514-10022)
- Parkinson's UK
- Schweizerischer Nationalfonds zur Förderung der Wissenschaftlichen Forschung (191446)
- UK Dementia Research Institute
- Medical Research Council (MR/K501013/1, MR/N008219/1, MR/M024903/1, MR/T031891/1, MR/N026934/1, MC_PC_17114)
- NIHR Imperial Biomedical Research Centre
- Topics
- Life Sciences › Neuroscience › Cellular and Molecular Neuroscience › Alzheimer's disease research and treatments
- Life Sciences › Neuroscience › Neurology › Neuroinflammation and Neurodegeneration Mechanisms
- Health Sciences › Medicine › Psychiatry and Mental health › Dementia and Cognitive Impairment Research
- Keywords
- Alzheimer's disease, astrocytes, microglia, amyloid-beta, phosphorylated tau, single-nucleus RNA sequencing, postmortem brain, apolipoprotein E, clusterin, MEF2C, MS4A6A, proteostasis, inflammation, phagocytosis, metal homeostasis, perivascular macrophages, GPNMB, gene co-expression, disease biomarkers
- MeSH terms
- Aged, Aged, 80 and over, Alzheimer Disease, Astrocytes, Brain, Female, Humans, Male, Microglia, Transcriptome
About these checks
Registry, retraction, Cites and statistics results are computed, not judged, with one exception: a printed reference that no index lists is read once by a model before it counts as a citation error. Claims are extracted by a model and kept only when their quote appears verbatim in the text; each cited source is then checked, with a model’s help, for whether it says what the claim relies on. Those verdicts can be wrong — read the claim’s quote and the cited source before relying on one.
Statistics and arithmetic are recomputed, not judged.
Confidence bands are shown only for fields calibrated on our annotated test set. None is calibrated yet, so no band is shown.
What counts as a claim ›How we measure confidence ›How we check this ›
Are you an author, or do you see a problem with this page? Request a review
