

The DOI matches its Crossref record; 62 of the 62 references it cites were found in a registry or an index.
The ‘Critical Power’ Concept: Applications to Sports Performance with a Focus on Intermittent High-Intensity Exercise
Open accessAbstract
The curvilinear relationship between power output and the time for which it can be sustained is a fundamental and well-known feature of high-intensity exercise performance. This relationship 'levels off' at a 'critical power' (CP) that separates power outputs that can be sustained with stable values of, for example, muscle phosphocreatine, blood lactate, and pulmonary oxygen uptake ([Formula: see text]), from power outputs where these variables change continuously with time until their respective minimum and maximum values are reached and exercise intolerance occurs. The amount of work that can be done during exercise above CP (the so-called W') is constant but may be utilized at different rates depending on the proximity of the exercise power output to CP. Traditionally, this two-parameter CP model has been employed to provide insights into physiological responses, fatigue mechanisms, and performance capacity during continuous constant power output exercise in discrete exercise intensity domains. However, many team sports (e.g., basketball, football, hockey, rugby) involve frequent changes in exercise intensity and, even in endurance sports (e.g., cycling, running), intensity may vary considerably with environmental/course conditions and pacing strategy. In recent years, the appeal of the CP concept has been broadened through its application to intermittent high-intensity exercise. With the assumptions that W' is utilized during work intervals above CP and reconstituted during recovery intervals below CP, it can be shown that performance during intermittent exercise is related to four factors: the intensity and duration of the work intervals and the intensity and duration of the recovery intervals. However, while the utilization of W' may be assumed to be linear, studies indicate that the reconstitution of W' may be curvilinear with kinetics that are highly variable between individuals. This has led to the development of a new CP model for intermittent exercise in which the balance of W' remaining ([Formula: see text]) may be calculated with greater accuracy. Field trials of athletes performing stochastic exercise indicate that this [Formula: see text] model can accurately predict the time at which W' tends to zero and exhaustion is imminent. The [Formula: see text] model potentially has important applications in the real-time monitoring of athlete fatigue progression in endurance and team sports, which may inform tactics and influence pacing strategy.
Overview
The claims and statistics of this paper haven’t been checked yet.
Run the check — free, no account needed. It reads the open-access text and checks the sources it cites.
Integrity signals
Registry
Cites
Statistics
Figures
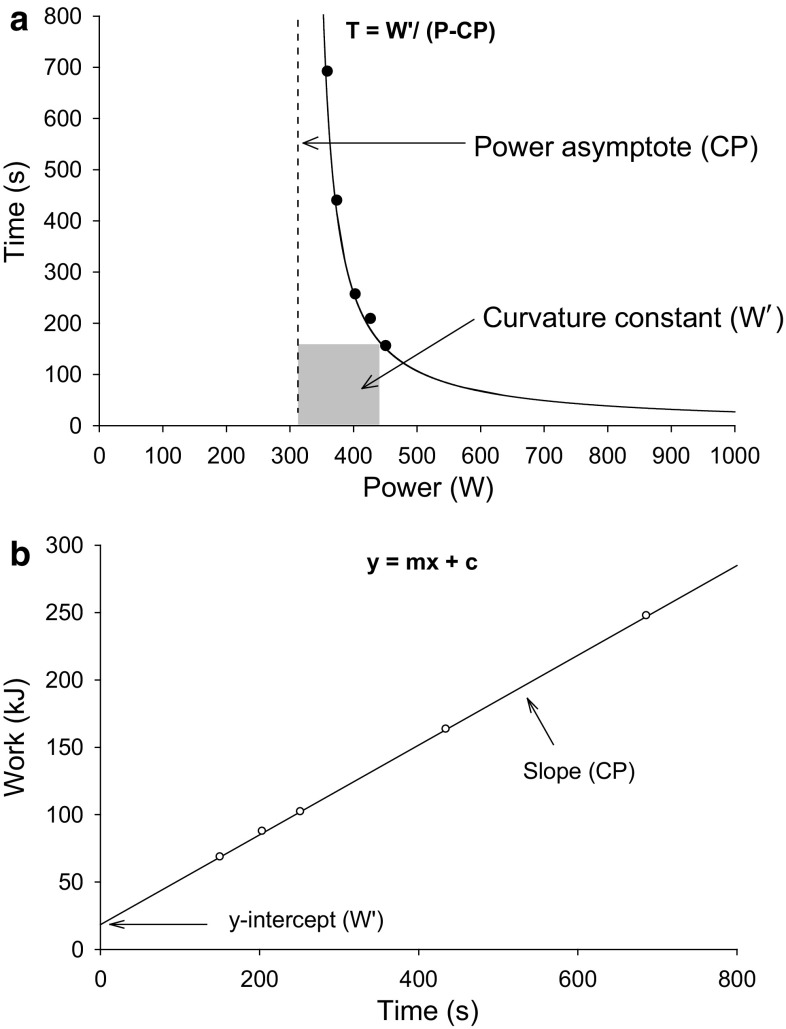
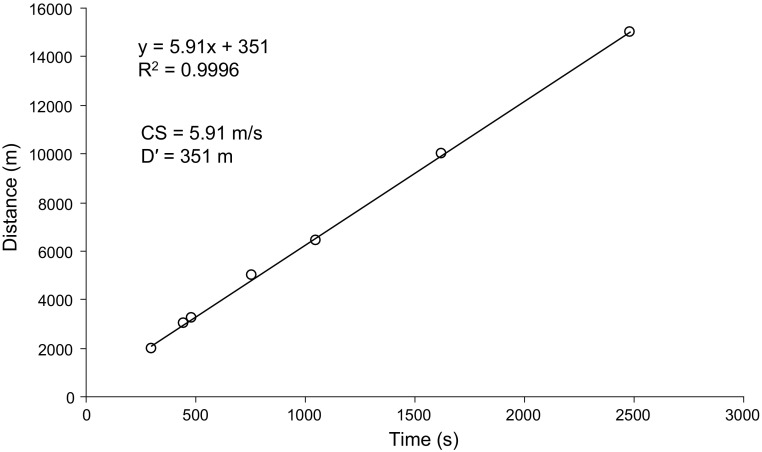
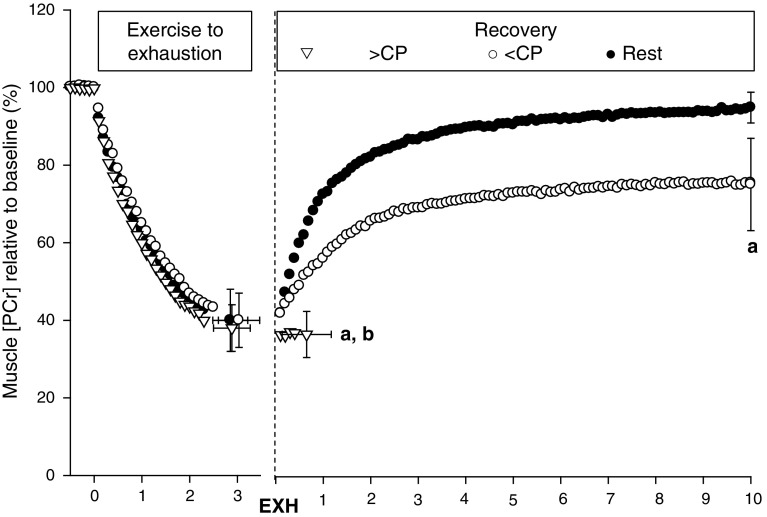
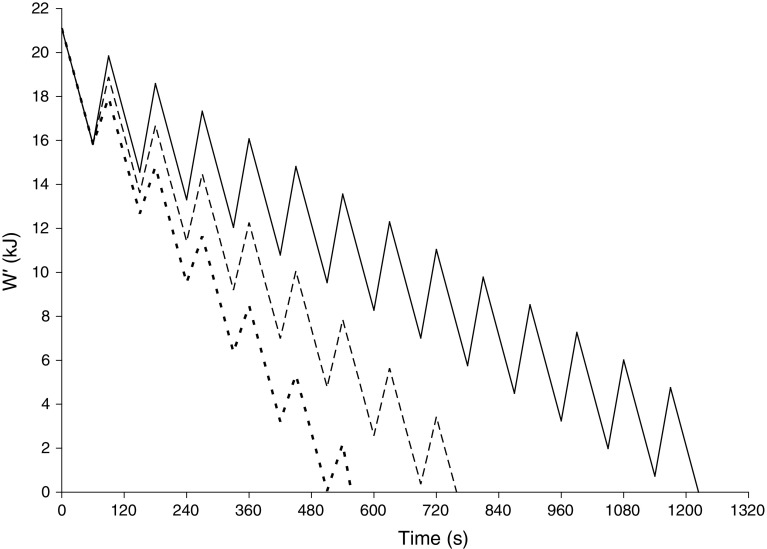
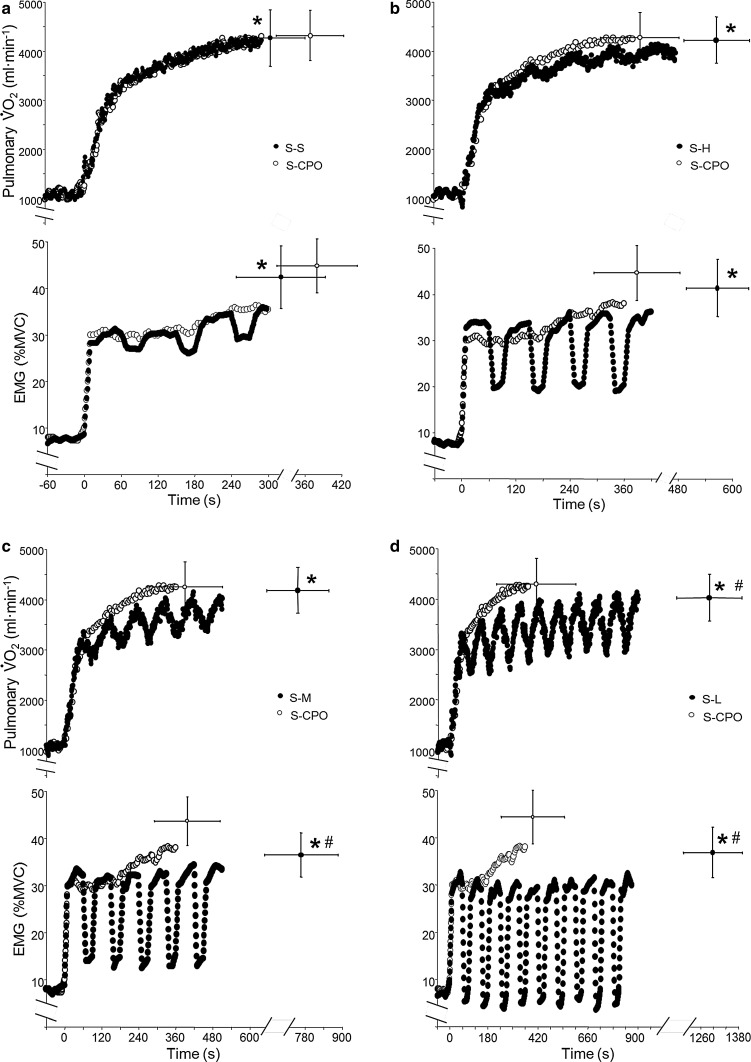
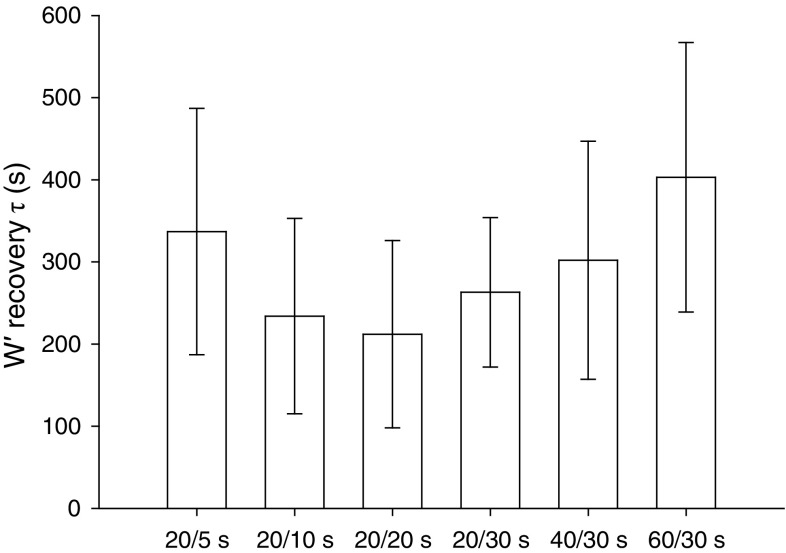
Verification
Claims the paper makes
The claims and statistics of this paper haven’t been checked yet.
Run the check — free, no account needed. It reads the open-access text and checks the sources it cites.
Claims other papers make about this one
Each is checked against this paper’s own text: does it say what the citing paper says it does?
In the citing paper
“Elite athletes sustain ∼96% of CS during the marathon (Jones & Vanhatalo, 2017)”
From Contemporary Nutrition Strategies to Optimize Performance in Distance Runners and Race Walkers (2019) · cites this paper as Jones & Vanhatalo, 2017
Self-check
Percentages, sums and reported differences re-computed from the paper’s own numbers.
The self-check needs the paper’s full text.
Citations
Cites
THE WORK CAPACITY OF A SYNERGIC MUSCULAR GROUP
MONOD, H., & Scherrer, J. (1965) · Ergonomics · doi:10.1080/00140136508930810 · Cited by 903
Metabolic and respiratory profile of the upper limit for prolonged exercise in man
Poole, D. C., Ward, S. A., Gardner, G. W., & Whipp, B. J. (1988) · Ergonomics · doi:10.1080/00140138808966766 · Cited by 780
Critical power as a measure of physical work capacity and anaerobic threshold
MORITANI, T., Nagata, A., DEVRIES, H. A., & Muro, M. (1981) · Ergonomics · doi:10.1080/00140138108924856 · Cited by 578
Critical Power: Implications for Determination of V˙O2max and Exercise Tolerance
JONES, A. M., Vanhatalo, A., Burnley, M., Morton, R. H., & Poole, D. C. (2010) · Medicine & Science in Sports & Exercise · doi:10.1249/mss.0b013e3181d9cf7f · Cited by 551
Self-citationMuscle metabolic responses to exercise above and below the “critical power” assessed using 31 P-MRS
JONES, A. M., Wilkerson, D. P., DiMenna, F. J., Fulford, J., & Poole, D. C. (2007) · American Journal of Physiology-Regulatory, Integrative and Comparative Physiology · doi:10.1152/ajpregu.00731.2007 · Cited by 479
Self-citationOxygen uptake kinetics as a determinant of sports performance
Burnley, M., & JONES, A. M. (2007) · European Journal of Sport Science · doi:10.1080/17461390701456148 · Cited by 468
Self-citationDetermination of Critical Power Using a 3-min All-out Cycling Test
Vanhatalo, A., Doust, J. H., & Burnley, M. (2007) · Medicine & Science in Sports & Exercise · doi:10.1249/mss.0b013e31802dd3e6 · Cited by 357
Slow Component of V˙O2 Kinetics: Mechanistic Bases and Practical Applications
JONES, A. M., GRASSI, B., CHRISTENSEN, P. M., KRUSTRUP, P., BANGSBO, J., & POOLE, D. C. (2011) · Medicine & Science in Sports & Exercise · doi:10.1249/mss.0b013e31821fcfc1 · Cited by 353
Self-citationBlack, M. I., JONES, A. M., Blackwell, J. R., Bailey, S. J., Wylie, L. J., McDonagh, S. T. J., Thompson, C., KELLY, J. A., Sumners, P., Mileva, K. N., et al. (2016) · Journal of Applied Physiology · doi:10.1152/japplphysiol.00942.2016 · Cited by 301
Self-citationA 3-min All-Out Test to Determine Peak Oxygen Uptake and the Maximal Steady State
Burnley, M., Doust, J. H., & Vanhatalo, A. (2006) · Medicine & Science in Sports & Exercise · doi:10.1249/01.mss.0000232024.06114.a6 · Cited by 258
Cited by
Sorted by citations
Items 201–259 of 259
Sutcliffe, D. P., & Kramer, M. (2024) · Sport Sciences for Health · doi:10.1007/s11332-024-01293-7 · Cited by 1
The Relative Contribution of Cognitive and Physical Components in Volleyball Injuries Prediction
Hesami, P., Balouchy, R., & Ghasemian, M. (2020) · Journal of Clinical Research in Paramedical Sciences · doi:10.5812/jcrps.96303 · Cited by 1
Bayesian approaches for critical velocity modelling of data from intermittent efforts
Peng, K. K., Clarke, D. C., & Swartz, T. B. (2022) · International Journal of Sports Science & Coaching · doi:10.1177/17479541221100311 · Cited by 1
Everesting: cycling the elevation of the tallest mountain on Earth
Swinnen, W., Laughlin, E., & Hoogkamer, W. (2022) · European Journal of Applied Physiology · doi:10.1007/s00421-022-05032-z · Cited by 1
Methoden zur Beurteilung der anaeroben Leistungsfähigkeit und Kapazität
Heck, H. (2022) · Springer eBooks · doi:10.1007/978-3-662-59835-1_17 · Cited by 1
Chorley, A., & Lamb, K. (2023) · Sport Sciences for Health · doi:10.1007/s11332-023-01050-2 · Cited by 1
Kramer, M., & Piatrikova, E. (2021) · Preprints.org · doi:10.20944/preprints202102.0081.v1 · Cited by 1
Wilson, H. V., Bernert, L., Spillane, P., Squires, E., Crawford, L., Piasecki, J., Julian, R., Wilhelm, E. N., Hicks, K. M., & Ansdell, P. (2024) · bioRxiv (Cold Spring Harbor Laboratory) · doi:10.1101/2024.11.08.622119 · Cited by 1
Shen, S., Xu, Y., Fu, W., Li, Y., Huang, J., Chen, L.-X., LI, W.-Z., Pan, Y., Li, R.-G., & JU, P.-L. (2020) · Journal of Mechanics in Medicine and Biology · doi:10.1142/s0219519420500578
Darrall‐Jones, J., Roe, G. A. B., Cremen, E., & Jones, B. L. (2021) · The Journal of Strength and Conditioning Research · doi:10.1519/jsc.0000000000003960
Characterization and Reliability of the Work-Time Relationship During Arm-Cranking
Starling‐Smith, T. M. (2021) · Journal of International Crisis and Risk Communication Research
Shorter constant work rate cycling tests as proxies for longer tests in highly trained cyclists
du Plessis, C., Andrews, M., Mitchell, L. J. G., Wilkie, J. C., King, T., & Blazevich, A. J. (2022) · PLoS ONE · doi:10.1371/journal.pone.0259034
Critical power (CP) testing: An accurate rapid method of fitness assessment during space missions
Jordan, S. L., Kern, J., Chilek, D. R., & Moore, A. (2022) · Acta Astronautica · doi:10.1016/j.actaastro.2022.05.049
Strategies to Reduce Heat Strain During Tennis Match-Play in Hot, Humid Conditions
Debney, M. (2021) · Sheffield Hallam University · doi:10.7190/shu-thesis-00462
Break Personal Bests: A Comprehensive Study on Strategies of Cycling
Boyang Liu, Z. W. (2023) · Academic Journal of Computing & Information Science · doi:10.25236/ajcis.2023.060308
Muchaxo, R. (2024) · doi:10.5463/thesis.616
Barbieri, R. A., Kalva‐Filho, C. A., Faria, M. H., Silveira-Ciola, A. P., Torriani‐Pasin, C., Simieli, L., & Barbieri, F. A. (2024) · Journal of Human Kinetics · doi:10.5114/jhk/186562
Ali, A. M., Мохаммед, М. Т., & Прокопьев, Н. Я. (2024) · Modern Humanities Success · doi:10.58224/2618-7175-2024-4-255-260
Treinos em Zona 1 e seu impacto nas variáveis fisiologicas e desempenho na corrida
Andrés, L. R. (2024) · Cuadernos de Educación y Desarrollo · doi:10.55905/cuadv16n6-163
Fractional utilization of the 10-minute treadmill test velocity in running performance
Antonio, D. S., Krause, M. P., de Borba, E. F., Ulbrich, A. Z., Buzzachera, C. F., & Silva, S. G. (2024) · International Journal of Sports Medicine · doi:10.1055/a-2408-7467
Machine Learning in Tennis Match Analysis: Predicting Score Point Victor and Momentum Shift
Hu, J., Yang, X., Huang, Z., & Xie, J. (2024) · International Conference on Machine Learning and Computer Application (ICMLCA) · doi:10.1109/icmlca63499.2024.10753948
The cardiovascular response to international Olympic class windsurfing competition
Anastasiou, A., Jones, T. W. A., Mullan, P., ROSS, E. Z., & Howatson, G. (2025) · International Journal of Sports Science & Coaching · doi:10.1177/17479541251314256
Do heart rates of elite marathon runners exhibit room for drift? Implications for durability
Takayama, F., & Aoyagi, A. (2025) · Frontiers in Sports and Active Living · doi:10.3389/fspor.2025.1571498
FORMATION OF SPECIALIZED TARGETED LOADS OF "CRITICAL" POWER IN QUALIFIED ATHLETES IN ROWING
Дяченко, А., & Wei, Y. (2025) · Sport Science and Human Health · doi:10.28925/2664-2069.2025.15
Sutcliffe, D. P., & Kramer, M. (2025) · PLoS ONE · doi:10.1371/journal.pone.0323655
Steele, J. R., VanKeersbilck, L., Bruening, D. A., Gifford, J. R., Seeley, M. K., & Hunter, I. (2025) · Journal of Applied Biomechanics · doi:10.1123/jab.2024-0316
The physiological demands of a military dismounted assault task
McGuire, S. J., Blacker, S. D., Wilkinson, D. M., & Myers, S. (2025) · Applied Ergonomics · doi:10.1016/j.apergo.2025.104637
Overview of cardiorespiratory system involvement in fatigue
Wooten, L. C. (2025) · Elsevier eBooks · doi:10.1016/b978-0-443-24080-5.00002-3
Welburn, A. J., Bailey, S. J., & Ferguson, R. A. (2025) · European Journal of Applied Physiology · doi:10.1007/s00421-025-06046-z
Hanakam, F., Göbe, L. M., & Ferrauti, A. (2025) · Springer eBooks · doi:10.1007/978-3-662-69524-1_7
Çabuk, R., & Egemen, A. L. P. (2025) · Spor ve Performans Araştırmaları Dergisi · doi:10.17155/omuspd.1770805
YÜCEL, B. (2025) · International Journal of Sport Exercise & Training Sciences · doi:10.18826/useeabd.1828830
McConnochie, G. E., Fox, A., Bellenger, C. R., & Thewlis, D. (2026) · Royal Society Open Science · doi:10.1098/rsos.250668
Critical power as an indicator of endurance in sports: methods, models, applications
Telianov, A., & Mykytchyk, O. (2026) · Scientific Journal of National Pedagogical Dragomanov University Series 15 Scientific and pedagogical problems of physical culture (physical culture and sports) · doi:10.31392/udu-nc.series15.2026.01(200).40
The influence of oral health on sports performance: an interdisciplinary perspective
Hollander, K., Eshkol‐Yogev, I., Zech, A., Buti, J., & Needleman, I. G. (2026) · BDJ · doi:10.1038/s41415-025-9348-1 · Cited by 3
Ruiz‐Alias, S. A., & García‐Pinillos, F. (2026) · German Journal of Exercise and Sport Research · doi:10.1007/s12662-026-01106-8
Marinari, G., Murias, J. M., & Iannetta, D. (2025) · Medicine & Science in Sports & Exercise · doi:10.1249/mss.0000000000003906
Chesbro, G. A., Larson, D. J., Wenger, M. J., Black, C. D., & Larson, R. D. (2026) · The Journal of Strength and Conditioning Research · doi:10.1519/jsc.0000000000005383
Performance factors of prolonged running : a particular focus on running economy and fatigue
Pastor, F. S. (2021) · theses.fr (ABES) · doi:10.70675/5bde97d0zd2b5z4653z8a3ezfe2346031100
Kuo, Y.-H., Yang, Y.-J., Wu, H.-J., & Kuo, Y.-C. (2026) · Journal of Human Kinetics · doi:10.5114/jhk/219785
Suzuki, Y., Takei, N., Tanji, F., Yamanaka, R., & Saeki, T. (2026) · Scandinavian Journal of Medicine and Science in Sports · doi:10.1111/sms.70286
Does a low-carbohydrate diet impede endurance sports performance? Yes
Burke, L. M., & Noakes, T. D. (2026) · American Journal of Clinical Nutrition · doi:10.1016/j.ajcnut.2026.101268 · Cited by 1
Clay, C. S., Perez, N. J., Miller, P. E., & Farrell, J. W. (2026) · Physiologia · doi:10.3390/physiologia6020043
Antenucci, L., Schmidt, C., & Malatesta, D. (2026) · The Journal of Strength and Conditioning Research · doi:10.1519/jsc.0000000000005546
Muñoz-López, M., Quesada-Fernández, G., Sancho-Haro, E. S., Viúdez, X. R. D. L. P., Baz-Valle, E., López‐Gil, J. F., & Tornero-Aguilera, J. F. (2026) · Metabolites · doi:10.3390/metabo16070483
Quittmann, O. J., & Piehl, M. A. (2026) · European Journal of Applied Physiology · doi:10.1007/s00421-026-06356-w
Held, S., Rappelt, L., Micke, F., Wiedenmann, T., & Donath, L. (2026) · BMC Sports Science Medicine and Rehabilitation · doi:10.1186/s13102-026-01891-7
Soyal, M., Aksoy, Ö., Çelik, N., Özağır, M., Gökmen, Ü. C., & Uğur, C. A. B. A. (2026) · Frontiers in Research Metrics and Analytics · doi:10.3389/frma.2026.1905302
Nevin, J., Blacker, S. D., & Orr, R. M. (2026) · Strength and conditioning journal · doi:10.1519/ssc.0000000000000997
Antonio, B. B., Shannon, E. S., Candow, D. G., Gough, L. A., Grgić, J., Gurton, W. H., McNaughton, L. R., Roberts, J., Saunders, B., Schwarz, A. V., et al. (2026) · Journal of the International Society of Sports Nutrition · doi:10.1080/15502783.2026.2724103
Petrov, Á., Barthalos, I., Arany, D., Nagyváradi, K., Petrov, I., Alföldi, Z., & Ihász, F. (2026) · Journal of Functional Morphology and Kinesiology · doi:10.3390/jfmk11030369
Анатольевич, Т. Е. (2026) · Russian Journal of Information Technology in Sports · doi:10.62105/2949-6349-2026-3-4-e202616
Breaking Barriers: What is the Probability of Achieving Mile World Records in the Near Future?
Alda-Blanco, A., JONES, A. M., & González‐Mohíno, F. (2026) · Sports Medicine · doi:10.1007/s40279-026-02545-x
Self-citationRelationship Between Critical Speed and Long-Distance Swimming Performance: An Exploratory Study
Zwetsloot, T. H. M., Micheli, L., van Diepen, W., Elferink-Gemser, M. T., & Marini, C. F. (2026) · International Journal of Sports Medicine · doi:10.1055/a-2974-6165
Can Resistance Training-Induced Skeletal Muscle Growth Improve Local Muscular Endurance?
Chatlaong, M. A., Hammert, W. B., Wohlgemuth, K. J., Loenneke, J. P., & Jessee, M. B. (2026) · Sports Medicine · doi:10.1007/s40279-026-02539-9
Metadata
- Authors
- Jones, A. M., & Vanhatalo, A.
- Affiliations
- University of Exeter (GB)
- Corresponding author
- Jones, Andrew M.
- Venue
- Sports Medicine
- Published
- 2017-03
- Volume
- 47
- Issue
- S1
- Pages
- 65-78
- ISSN
- 0112-1642 (ISSN-L)
- 1179-2035
- PMC
- PMC5371646
- OpenAlex
- W2598090454
- Cited by
- 259
- References
- 62
- Citations by year
- 2026: 24 · 2025: 36 · 2024: 32 · 2023: 26 · 2022: 36 · 2021: 37 · 2020: 36 · 2019: 15 · 2018: 15 · 2017: 2
- FWCI
- 3.35
- Type
- journal article
- Language
- en
- Open access
- hybrid
- doi.org
- Locations
- Sports Medicine (publishedVersion, cc-by)
- PubMed Central (publishedVersion, cc-by)
- PubMed (publishedVersion)
- Funders
- PepsiCo
- Gran Sasso Science Institute
- Topics
- Health Sciences › Medicine › Orthopedics and Sports Medicine › Sports Performance and Training
- Health Sciences › Medicine › Physiology (medical) › Cardiovascular and exercise physiology
- Social Sciences › Psychology › Developmental and Educational Psychology › Sport Psychology and Performance
- Keywords
- critical power, high-intensity intermittent exercise, work capacity, team sports, endurance sports, pacing strategy, fatigue monitoring, exercise intolerance, phosphocreatine, blood lactate, pulmonary oxygen uptake
- MeSH terms
- Exercise Test, Humans, Oxygen Consumption, Physical Endurance, Exercise, Athletic Performance
About these checks
Registry, retraction, Cites and statistics results are computed, not judged, with one exception: a printed reference that no index lists is read once by a model before it counts as a citation error. Claims are extracted by a model and kept only when their quote appears verbatim in the text; each cited source is then checked, with a model’s help, for whether it says what the claim relies on. Those verdicts can be wrong — read the claim’s quote and the cited source before relying on one.
Statistics and arithmetic are recomputed, not judged.
Confidence bands are shown only for fields calibrated on our annotated test set. None is calibrated yet, so no band is shown.
What counts as a claim ›How we measure confidence ›How we check this ›
Are you an author, or do you see a problem with this page? Request a review
