

The DOI matches its Crossref record; 1 of the 1 references it cites were found in a registry or an index.
Corruption risk in contracting markets: a network science perspective
Open accessAbstract
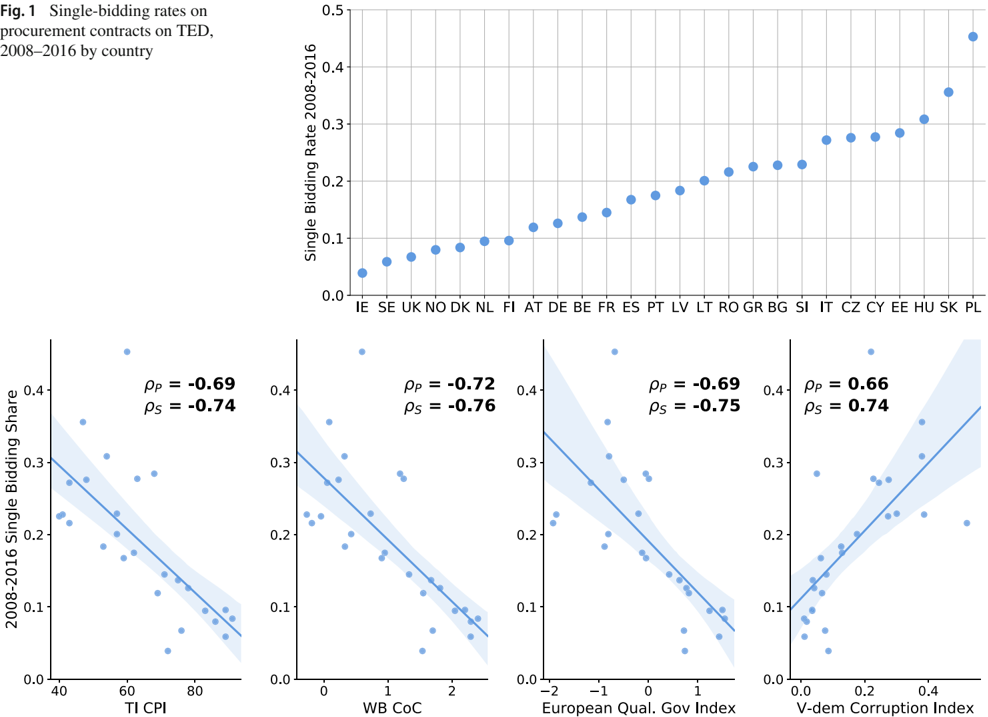
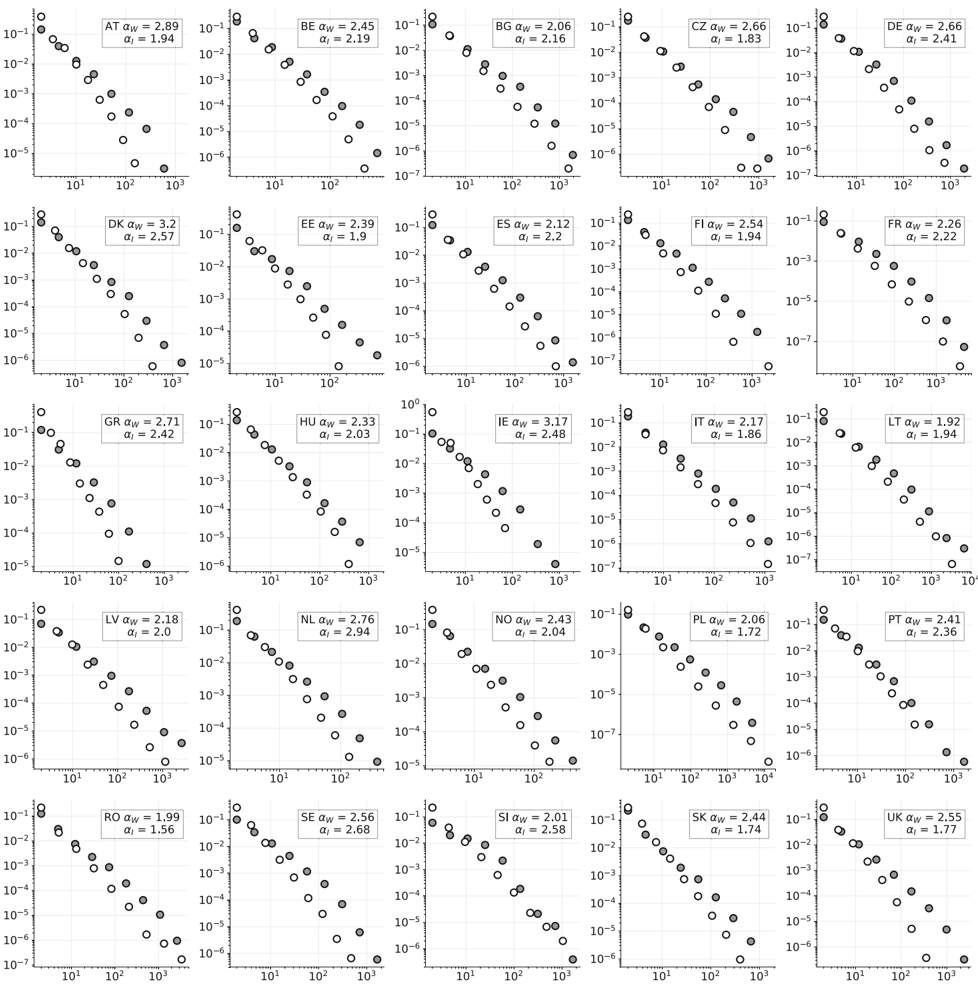
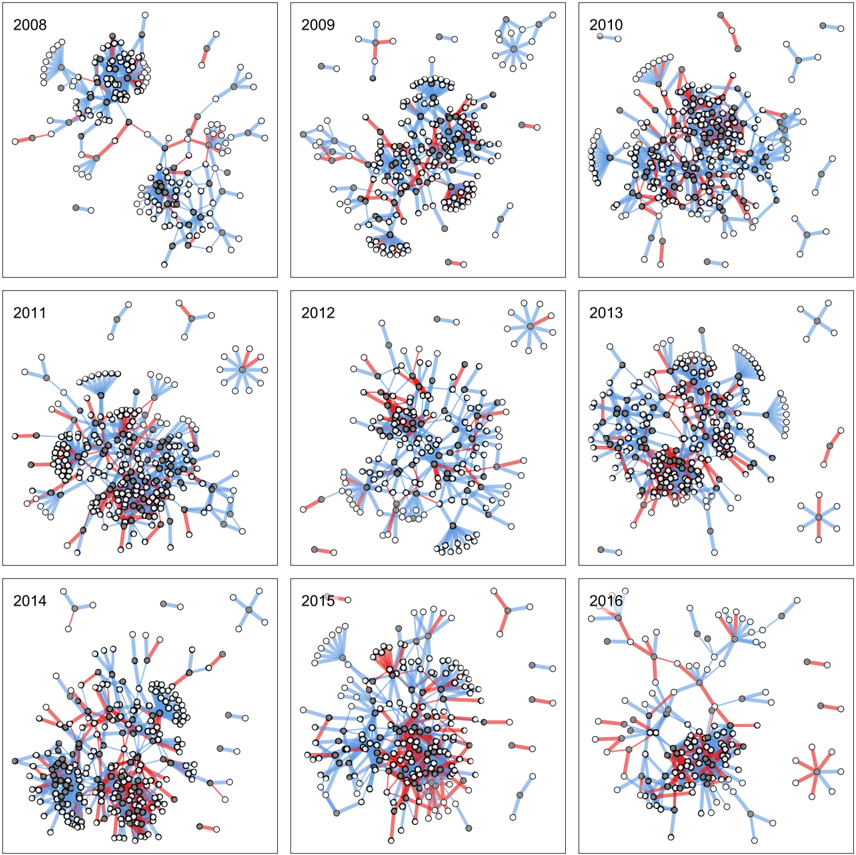
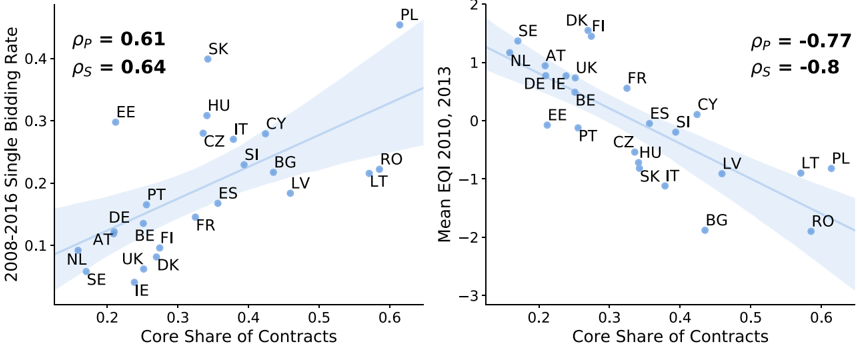
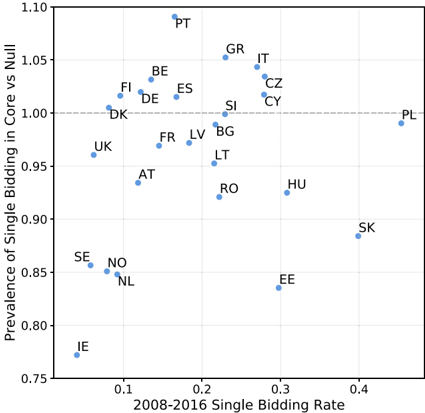
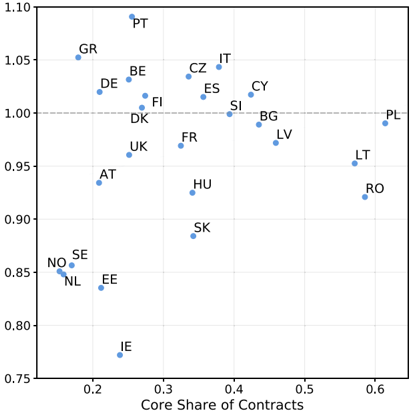
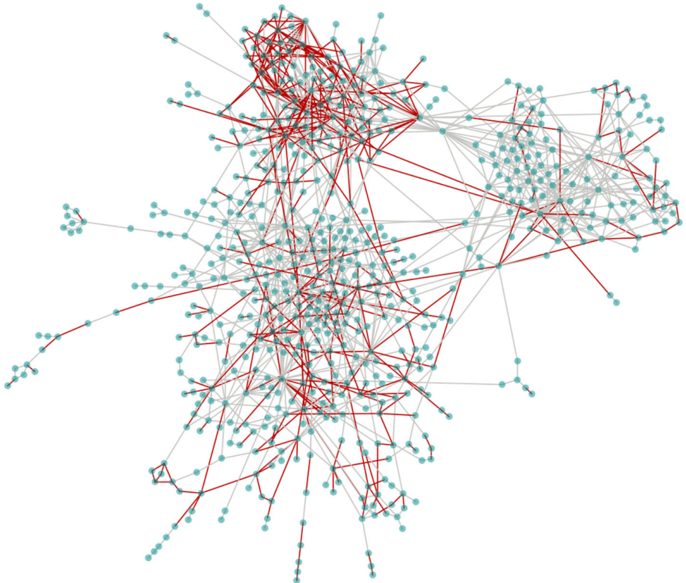
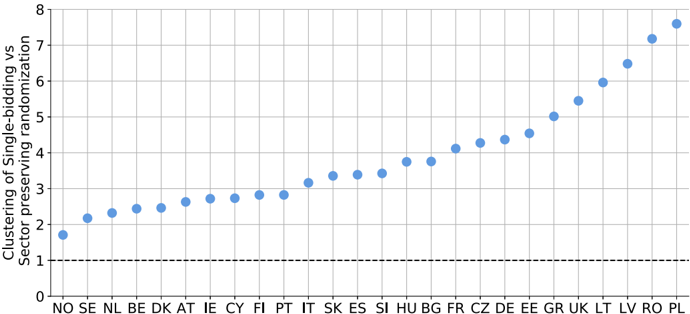
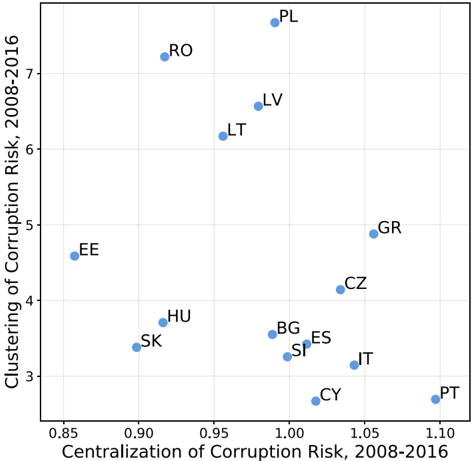
We use methods from network science to analyze corruption risk in a large administrative dataset of over 4 million public procurement contracts from European Union member states covering the years 2008–2016. By mapping procurement markets as bipartite networks of issuers and winners of contracts, we can visualize and describe the distribution of corruption risk. We study the structure of these networks in each member state, identify their cores, and find that highly centralized markets tend to have higher corruption risk. In all EU countries we analyze, corruption risk is significantly clustered. However, these risks are sometimes more prevalent in the core and sometimes in the periphery of the market, depending on the country. This suggests that the same level of corruption risk may have entirely different distributions. Our framework is both diagnostic and prescriptive: It roots out where corruption is likely to be prevalent in different markets and suggests that different anti-corruption policies are needed in different countries.
Overview
The claims and statistics of this paper haven’t been checked yet.
Run the check — free, no account needed. It reads the open-access text and checks the sources it cites.
Integrity signals
Registry
Cites
Statistics
Figures
Verification
Claims the paper makes
The claims and statistics of this paper haven’t been checked yet.
Run the check — free, no account needed. It reads the open-access text and checks the sources it cites.
Claims other papers make about this one
Each is checked against this paper’s own text: does it say what the citing paper says it does?
In the citing paper
“However, few studies have explored adequate methodologies that account for non-linearities in spending dynamics or examined the inference potential in public procurement data [8–10].”
From Scaling Behavior of Public Procurement Activity (2021) · cites this paper as [9]
Self-check
Percentages, sums and reported differences re-computed from the paper’s own numbers.
The self-check needs the paper’s full text.
Citations
Cites
Klitgaard, R. (2019) · doi:10.1525/9780520911185 · Cited by 1,423
Research works printed but not linked: 76
- Scott, J.C.: Seeing Like a State: How Certain Schemes to Improve the Human Condition Have Failed. Yale University Press, New Haven (1998)
- Pappalardo, L., Vanhoof, M., Gabrielli, L., Smoreda, Z., Pedreschi, D., Giannotti, F.: An analytical framework to nowcast well-being using mobile phone data. Int. J. Data Sci. Anal. 2(1–2), 75 (2016) · DOI
- Kim, G.H., Trimi, S., Chung, J.H.: Big-data applications in the government sector. Commun. ACM 57(3), 78 (2014) · DOI
- Mungiu-Pippidi, A.: The Quest for Good Governance: How Societies Develop Control of Corruption. Cambridge University Press, Cambridge (2015) · DOI
- Mauro, P.: Corruption and growth. Q. J. Econ. 110(3), 681 (1995) · DOI · Paper page
- Rodríguez-Pose, A., Di Cataldo, M.: Quality of government and innovative performance in the regions of europe. J. Econ. Geogr. 15(4), 673 (2014) · DOI
- Stockemer, D., LaMontagne, B., Scruggs, L.: Bribes and ballots: the impact of corruption on voter turnout in democracies. Int. Polit. Sci. Rev. 34(1), 74 (2013) · DOI · Paper page
- Gupta, S., Davoodi, H., Alonso-Terme, R.: Does corruption affect income inequality and poverty? Econ. Gov. 3(1), 23 (2002) · DOI
- Mungiu, A.: Corruption: diagnosis and treatment. J. Democr. 17(3), 86 (2006) · DOI
- Olken, B.A.: Corruption perceptions vs. corruption reality. J. Public Econ. 93(7–8), 950 (2009) · DOI
- Radermacher, W.J.: Official statistics in the era of big data opportunities and threats. Int. J. Data Sci. Anal. 6(3), 225 (2018) · DOI
- Fazekas, M., Tóth, I.J.: From corruption to state capture: a new analytical framework with empirical applications from Hungary. Polit. Res. Q. 69(2), 320 (2016) · DOI
- Klašnja, M.: Corruption and the incumbency disadvantage: theory and evidence. J. Polit. 77(4), 928 (2015) · DOI
- Charron, N., Dahlström, C., Fazekas, M., Lapuente, V.: Careers, connections, and corruption risks: investigating the impact of bureaucratic meritocracy on public procurement processes. J. Polit. 79(1), 89 (2017) · DOI
- Newman, M.E.: The structure and function of complex networks. SIAM Rev. 45(2), 167 (2003) · DOI · Paper page
- Watts, J.: Operation car wash: is this the biggest corruption scandal in history. The Guardian 1(06), 2017 (2017)
- Ribeiro, H.V., Alves, L.G., Martins, A.F., Lenzi, E.K., Perc, M.: The dynamical structure of political corruption networks. J. Complex Netw. 6, 989–1003 (2018) · DOI
- Calderoni, F.: In: Third Annual Illicit Networks Workshop. (Équipe de recherche sur la délinquance en réseau, 2011), pp. 1–21
- Krebs, V.E.: Mapping networks of terrorist cells. Connections 24(3), 43 (2002)
- Saracco, F., Di Clemente, R., Gabrielli, A., Squartini, T.: Detecting early signs of the 2007–2008 crisis in the world trade. Sci. Rep. 6, 30286 (2016) · DOI
- Hidalgo, C.A., Klinger, B., Barabási, A.L., Hausmann, R.: The product space conditions the development of nations. Science 317(5837), 482 (2007) · DOI
- Mamei, M., Pancotto, F., De Nadai, M., Lepri, B., Vescovi, M., Zambonelli, F., Pentland, A.: Is social capital associated with synchronization in human communication? An analysis of italian call records and measures of civic engagement. EPJ Data Sci. 7(1), 25 (2018) · DOI
- Stadtfeld, C.: The Micro–Macro Link in Social Networks. Emerging Trends in the Social and Behavioral Sciences: An Interdisciplinary, Searchable, and Linkable Resource, pp. 1–15 (2015) · DOI
- Murdoch, T.B., Detsky, A.S.: The inevitable application of big data to health care. JAMA 309(13), 1351 (2013) · DOI
- Sinatra, R., Wang, D., Deville, P., Song, C., Barabási, A.L.: Quantifying the evolution of individual scientific impact. Science 354(aaf6312), 5239 (2016) · DOI
- Pappalardo, L., Pedreschi, D., Smoreda, Z., Giannotti, F.: In: 2015 IEEE International Conference on Big Data (Big Data). IEEE, pp. 871–878 (2015)
- Szell, M.: Crowdsourced quantification and visualization of urban mobility space inequality. Urb. Plan. 3(1), 1 (2018) · DOI
- Hilbert, M.: Big data for development: a review of promises and challenges. Dev. Policy Rev. 34(1), 135 (2016) · DOI · Paper page
- Connelly, R., Playford, C.J., Gayle, V., Dibben, C.: The role of administrative data in the big data revolution in social science research. Soc. Sci. Res. 59, 1 (2016) · DOI · Paper page
- Heywood, P.M., Rose, J.: “close but no cigar”: the measurement of corruption. J. Public Policy 34(3), 507 (2014) · DOI
- Charron, N., Dijkstra, L., Lapuente, V.: Regional governance matters: quality of government within European Union member states. Reg. Stud. 48(1), 68 (2014) · DOI · Paper page
- Cameron, L., et al.: Propensities to engage in and punish corrupt behavior: experimental evidence from Australia, India, Indonesia and Singapore. J. Public Econ. 93(7–8), 843 (2009). https://doi.org/10.1016/j.jpubeco.2009.03.004 · DOI
- Weisel, O., Shalvi, S.: The collaborative roots of corruption. Proc. Natl. Acad. Sci. 112(34), 10651 (2015). https://doi.org/10.1073/pnas.1423035112 · DOI
- Olken, B.A.: Monitoring corruption: evidence from a field experiment in indonesia. J. Polit. Econ. 115(2), 200 (2007) · DOI
- Glaeser, E.L., Saks, R.E.: Corruption in America. J. Public Econ. 90(6–7), 1053 (2006) · DOI
- Goel, R.K., Nelson, M.A.: Measures of corruption and determinants of us corruption. Econ. Gov. 12(2), 155 (2011) · DOI
- Kornberger, M., Meyer, R.E., Brandtner, C., Höllerer, M.A.: When bureaucracy meets the crowd: studying “open government” in the Vienna City Administration. Organ. Stud. 38(2), 179 (2017) · DOI
- Bertot, J.C., Jaeger, P.T., Grimes, J.M.: Using icts to create a culture of transparency: E-government and social media as openness and anti-corruption tools for societies. Gov. Inf. Q. 27(3), 264 (2010) · DOI · Paper page
- Borisov, A., Goldman, E., Gupta, N.: The corporate value of (corrupt) lobbying. Rev. Financ. Stud. 29(4), 1039 (2015) · DOI
- Bonica, A.: Mapping the ideological marketplace. Am. J. Polit. Sci. 58(2), 367 (2014) · DOI · Paper page
- Traag, V.A.: Complex contagion of campaign donations. PLoS ONE 11(4), e0153539 (2016) · DOI
- Garcia-Bernardo, J., Fichtner, J., Takes, F.W., Heemskerk, E.M.: Uncovering offshore financial centers: conduits and sinks in the global corporate ownership network. Sci. Rep. 7(1), 6246 (2017) · DOI
- Prosperi, M., Buchan, I., Fanti, I., Meloni, S., Palladino, P., Torvik, V.I.: Kin of coauthorship in five decades of health science literature. Proc. Natl. Acad. Sci. 113(32), 8957 (2016) · DOI
- Fazekas, M., Tóth, I.J., King, L.P.: An objective corruption risk index using public procurement data. Eur. J. Crim. Policy Res. 22(3), 369 (2016) · DOI
- Bergh, A., Erlingsson, G., Gustafsson, A., Wittberg, E.: Municipally owned enterprises as danger zones for corruption? How politicians having feet in two camps may undermine conditions for accountability. Public Integr. 21(3), 320 (2019) · DOI
- Wachs, J., Yasseri, T., Lengyel, B., Kertész, J.: Social capital predicts corruption risk in towns. R. Soc. Open Sci. 6(4), 182103 (2019) · DOI
- Popa, M.: Uncovering the structure of public procurement transactions. Bus. Polit. 21(3), 1–34 (2019) · DOI
- Johnston, M.: Syndromes of Corruption: Wealth, Power, and Democracy. Cambridge University Press, Cambridge (2005) · DOI
- Christen, P.: Data Matching: Concepts and Techniques for Record Linkage, Entity Resolution, and Duplicate Detection. Springer, Berlin (2012) · DOI
- Wachs, J.: Network approaches to the study of corruption. Ph.D. thesis, Central European University (2019). http://www.etd.ceu.edu/2019/wachs_johannes.pdf
- Attström, K., Kröber, R., Junclaus, M.: Review of the Function of the CPV Codes/System. Technical report, European Commission (2012)
- Mungiu-Pippidi, A., Dadašov, R.: Measuring control of corruption by a new index of public integrity. Eur. J. Crim. Policy Res. 22(3), 415 (2016) · DOI
- Jordano, P., Bascompte, J., Olesen, J.M.: Invariant properties in coevolutionary networks of plant–animal interactions. Ecol. Lett. 6(1), 69 (2003) · DOI
- Bustos, S., Gomez, C., Hausmann, R., Hidalgo, C.A.: The dynamics of nestedness predicts the evolution of industrial ecosystems. PLoS ONE 7(11), e49393 (2012) · DOI
- Hernández, L., Vignes, A., Saba, S.: Trust or robustness? An ecological approach to the study of auction and bilateral markets. PLoS ONE 13(5), e0196206 (2018) · DOI
- Robins, G., Alexander, M.: Small worlds among interlocking directors: network structure and distance in bipartite graphs. Comput. Math. Org. Theory 10(1), 69 (2004) · DOI
- Axtell, R.: Firm sizes: facts, formulae, fables and fantasies. SSRN Electron. J. (2006). https://doi.org/10.2139/ssrn.1024813 · DOI
- Alstott, J., Bullmore, E., Plenz, D.: powerlaw: a python package for analysis of heavy-tailed distributions. PLoS ONE 9(1), e85777 (2014) · DOI
- Csermely, P., London, A., Wu, L.Y., Uzzi, B.: Structure and dynamics of core/periphery networks. J. Complex Netw. 1(2), 93 (2013) · DOI
- Batagelj, V., Zaversnik, M.: An o (m) algorithm for cores decomposition of networks. arXiv preprint cs/0310049 (2003) · arXiv
- Dorogovtsev, S.N., Goltsev, A.V., Mendes, J.F.F.: K-core organization of complex networks. Phys. Rev. Lett. 96(4), 040601 (2006) · DOI
- Garas, A., Schweitzer, F., Havlin, S.: A k-shell decomposition method for weighted networks. New J. Phys. 14(8), 083030 (2012) · DOI
- Persson, T., Tabellini, G.E.: Political Economics: Explaining Economic Policy. MIT Press, Cambridge (2002)
- Fortunato, S.: Community detection in graphs. Phys. Rep. 486(3–5), 75 (2010) · DOI · Paper page
- Evans, T.S., Lambiotte, R.: Line graphs of weighted networks for overlapping communities. Eur. Phys. J. B 77(2), 265 (2010) · DOI
- Ahn, Y.Y., Bagrow, J.P., Lehmann, S.: Link communities reveal multiscale complexity in networks. Nature 466(7307), 761 (2010) · DOI
- Blondel, V.D., Guillaume, J.L., Lambiotte, R., Lefebvre, E.: Fast unfolding of communities in large networks. J. Stat. Mech. Theory Exp. 2008(10), P10008 (2008) · DOI · Paper page
- Monteiro, J., Martins, B., Pires, J.M.: A hybrid approach for the spatial disaggregation of socio-economic indicators. Int. J. Data Sci. Anal. 5(2–3), 189 (2018) · DOI
- Fazekas, M., Skuhrovec, J., Wachs, J.: Corruption, government turnover, and public contracting market structure. GTI working paper series (2) (2017) · DOI
- Sikdar, S., Ganguly, N., Mukherjee, A.: Time series analysis of temporal networks. Eur. Phys. J. B 89(1), 11 (2016) · DOI
- Tsalouchidou, I., Baeza-Yates, R., Bonchi, F., Liao, K., Sellis, T.: Temporal betweenness centrality in dynamic graphs. Int. J. Data Sci. Anal. (2019). https://doi.org/10.1007/s41060-019-00189-x · DOI
- Grossi, V., Rapisarda, B., Giannotti, F., Pedreschi, D.: Data science at sobigdata: the European research infrastructure for social mining and big data analytics. Int. J. Data Sci. Anal. 6(3), 205 (2018) · DOI
- Podobnik, B., Horvatić, D., Kenett, D.Y., Stanley, H.E.: The competitiveness versus the wealth of a country. Sci. Rep. 2, 678 (2012) · DOI
- Correa, J.C., Jaffe, K.: Corruption and wealth: unveiling a national prosperity syndrome in Europe. arXiv preprint arXiv:1604.00283 (2015) · arXiv
- Paulus, M., Kristoufek, L.: Worldwide clustering of the corruption perception. Physica A 428, 351 (2015) · DOI
- Albeaik, S., Kaltenberg, M., Alsaleh, M., Hidalgo, C.A.: Improving the economic complexity index. arXiv preprint arXiv:1707.05826 (2017) · arXiv
Cited by
Sorted by citations
Scaling Behavior of Public Procurement Activity
Curado, A., Damásio, B., Encarnação, S., Candia, C., & Pinheiro, F. L. (2021) · PLOS ONE · doi:10.1371/journal.pone.0260806 · Cited by 12
Metadata
- Authors
- Wachs, J., Fazekas, M., & Kertész, J.
- Affiliations
- RWTH Aachen University (DE)
- Central European University - Budapest Campus (HU)
- Corresponding author
- Wachs, Johannes
- Venue
- International Journal of Data Science and Analytics
- Published
- 2020-01-18
- Volume
- 12
- Issue
- 1
- Pages
- 45-60
- ISSN
- 2364-415X (ISSN-L)
- 2364-4168
- OpenAlex
- W2973493443
- Cited by
- 73
- References
- 1
- Citations by year
- 2026: 12 · 2025: 10 · 2024: 8 · 2023: 14 · 2022: 14 · 2021: 12 · 2020: 3
- FWCI
- 14.38
- Type
- journal article
- Language
- en
- Open access
- hybrid
- doi.org
- Locations
- International Journal of Data Science and Analytics (publishedVersion, cc-by)
- RePEc: Research Papers in Economics (submittedVersion)
- arXiv (Cornell University) (submittedVersion)
- Open Research (Auckland University of Technology) (submittedVersion, cc-by)
- RWTH Publications (RWTH Aachen) (submittedVersion, other-oa)
- WU Research (submittedVersion)
- arXiv (Cornell University)
- RWTH Publications (RWTH Aachen)
- Funders
- Hungarian Scientific Research Fund (K129124)
- Topics
- Social Sciences › Sociology and Political Science › Corruption and Economic Development
- Social Sciences › Business, Management and Accounting › Strategy and Management › Public Procurement and Policy
- Physical Sciences › Physics and Astronomy › Statistical and Nonlinear Physics › Complex Network Analysis Techniques
- Keywords
- corruption risk, public procurement, bipartite graphs, network centrality, network clustering, market structure, anti-corruption policy, EU member states
About these checks
Registry, retraction, Cites and statistics results are computed, not judged, with one exception: a printed reference that no index lists is read once by a model before it counts as a citation error. Claims are extracted by a model and kept only when their quote appears verbatim in the text; each cited source is then checked, with a model’s help, for whether it says what the claim relies on. Those verdicts can be wrong — read the claim’s quote and the cited source before relying on one.
Statistics and arithmetic are recomputed, not judged.
Confidence bands are shown only for fields calibrated on our annotated test set. None is calibrated yet, so no band is shown.
What counts as a claim ›How we measure confidence ›How we check this ›
Are you an author, or do you see a problem with this page? Request a review
