

The DOI matches its Crossref record; 1,145 of the 1,256 references it cites were found in a registry or an index; 96 of the 510 sources its claims cite were checked for support.
Testing general relativity in cosmology
Open accessAbstract
We review recent developments and results in testing general relativity (GR) at cosmological scales. The subject has witnessed rapid growth during the last two decades with the aim of addressing the question of cosmic acceleration and the dark energy associated with it. However, with the advent of precision cosmology, it has also become a well-motivated endeavor by itself to test gravitational physics at cosmic scales. We overview cosmological probes of gravity, formalisms and parameterizations for testing deviations from GR at cosmological scales, selected modified gravity (MG) theories, gravitational screening mechanisms, and computer codes developed for these tests. We then provide summaries of recent cosmological constraints on MG parameters and selected MG models. We supplement these cosmological constraints with a summary of implications from the recent binary neutron star merger event. Next, we summarize some results on MG parameter forecasts with and without astrophysical systematics that will dominate the uncertainties. The review aims at providing an overall picture of the subject and an entry point to students and researchers interested in joining the field. It can also serve as a quick reference to recent results and constraints on testing gravity at cosmological scales.
Overview
CoChat Summary
TL;DR
This review surveys how general relativity is tested at cosmological scales, emphasizing the split between background expansion/geometry probes and growth-of-structure probes, and how their combination constrains modified gravity. It also summarizes the status of major model classes, current data constraints, the impact of GW170817/GRB170817A, and the role of systematic effects and forecasting for future surveys.
Key findings
- The review argues that cosmology offers two complementary probe classes: expansion/geometry and structure growth; for testing deviations from GR, the growth sector is described as “rather the most useful” because many MG models can mimic the same expansion history as CDM while differing in growth.
- Current data generally remain consistent with GR, but often only at the level of relatively large uncertainties; the paper notes that constraints are tightening and that for upcoming surveys the dominant uncertainty will be systematic rather than statistical.
- Specific examples summarized in the text include:
- TeVeS was ruled out by Planck-based analyses, with one study reporting a best-fit Hubble constant that was “hard to reconcile” with other measurements and a goodness-of-fit worse than CDM.
- The self-accelerating DGP branch is described as disfavored/inconsistent with observations, while the normal branch remains useful as a benchmark.
- Galileon models are strongly constrained: cubic Galileons are ruled out by ISW data, and quartic/quintic Galileons are ruled out by GW170817/GRB170817A.
- f(R) models are driven very close to CDM by cosmological and astrophysical constraints, and the paper states that combining stringent cosmological constraints, astrophysical bounds, and no-go theorems “practically rules out” f(R) as an explanation for cosmic acceleration.
- The GW170817/GRB170817A event is presented as a major discriminator: it forces the GW speed to be practically equal to light speed and removes large parts of Horndeski/beyond-Horndeski and related model space, while leaving some viable subclasses (for example, generalized Brans–Dicke-like or certain no-slip scenarios) and several non-scalar-tensor classes.
Methods
- Narrative review of the literature on testing GR in cosmology, organized around: GR basics, standard cosmology, probes of gravity, formalisms for modified gravity, model classes, screening mechanisms, current constraints, GW170817 implications, software tools, systematics, and forecasts.
- Summarizes results from many published analyses and data sets, including Planck CMB, BAO, SN Ia, RSD, weak lensing, ISW, galaxy clustering, CMB lensing, and the GW170817/GRB170817A multimessenger event.
- Reviews analysis frameworks such as phenomenological modified-growth parameters, EFT, PPF, growth-index approaches, and model-specific Boltzmann/Einstein codes like CAMB, CLASS, ISiTGR, MGCAMB, hi_class, and EFTCAMB.
Limitations
- The paper explicitly states that it is not a comprehensive review of modified gravity models; it gives an overview of the current status of testing GR at cosmological scales and only outlines selected models as illustrative examples.
- It also notes that many current MG constraints are still limited by the constraining power of available data, and that scale-dependent MG parameters are often not meaningfully constrained by current data.
- Evident from the text: many quoted results are drawn from different papers using different parameterizations, data combinations, and modeling assumptions, so the review is synthesizing heterogeneous literature rather than presenting a single uniform analysis.
Model-written summary. Check it against the paper before relying on it.
Integrity signals
Registry
Cites
Statistics
Figures


Verification
Claims the paper makes
83 Valid · 9 Not valid · 289 Not checked · 144 Own results and interpretations
At least one cited source doesn’t support this claim or points to a different paper, and none confirmed it — see the verdicts below.
In the paper
“Incidentally, the bound in (327) is consistent with the bound derived in Moore and Nelson (2001) and Kimura and Yamamoto (2012) from gravitational Cherenkov radiation which constrains GW speed to not exceed the speed of light, assuming a galactic origin for the high energy cosmic rays.”
§ Testing general relativity in cosmology > Constraints on deviations from GR and MG models from neutron star merger event GW170817/GRB170817A
What the sources say
- Disputedcites Moore and Nelson (2001) sourceExperimental — accuracy not yet measured
The Introduction says gravitational Cherenkov radiation places a strong lower bound on gravitational-wave speed, not a bound requiring it to stay below light speed. The discussion following equation (4.2) explicitly says Cherenkov radiation is impossible when gravity travels faster than light. The paper therefore does not derive the upper bound attributed to it; it does not address the later GW170817/GRB170817A result. (LLM, conf=0.91)
Checked by a reasoning model — may be wrong.
- Disputedcites Kimura and Yamamoto (2012) sourceExperimental — accuracy not yet measured
Kimura & Yamamoto (2012) state the opposite sense of the bound: in the Introduction (p. 1) eq. (1.1) is explicitly called 'the lower bound on the propagation speed of gravity from gravitational Cherenkov radiation', c − c_T < 2×10⁻¹⁵ c (assuming a galactic origin for the ultra-high-energy cosmic rays), i.e. it forbids the GW speed from falling BELOW c. Sec. 2 (eq. 2.6) and Sec. 6 repeat that Cherenkov radiation constrains models 'when the propagation speed of gravitational waves is less than the speed of light', and Sec. 4 applies it as c_T > 1 − ε with ε = 2×10⁻¹⁵. So while the galactic-origin assumption and the existence of a ~10⁻¹⁵ bound are in our copy, the attribution that gravitational Cherenkov radiation 'constrains GW speed to not exceed the speed of light' (an upper bound) is contrary to what this paper says; it places no constraint on superluminal propagation. (LLM, conf=0.85)
Checked by a reasoning model — may be wrong.
plainstates an association- Asserted: passes — The authors put it forward as true.
- Checkable: passes — It can be checked against evidence.
- Load-bearing: unclear — It is unclear whether the paper’s conclusions depend on it.
- Based: passes — The paper gives a reason why it holds.
- Rests on an assumption not shown here.
- Disputed
At least one cited source doesn’t support this claim or points to a different paper, and none confirmed it — see the verdicts below.
In the paper
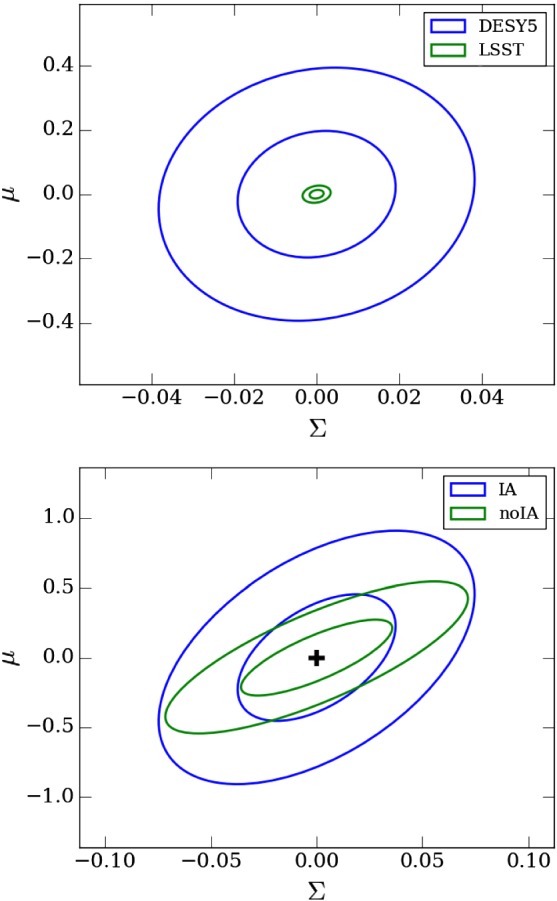
“They found that ignoring the effect of calibration bias or photometric redshift bias does affect significantly the constraints on MG parameters.”
§ Testing general relativity in cosmology > Systematic effects in cosmological probes and degeneracies with modifications to GR
What the sources say
- Disputedcites Ferté et al. (2017) sourceExperimental — accuracy not yet measured
The ‘Impact of systematics’ section (p. 4) says the opposite: ignoring shear calibration bias or photometric redshift bias does not significantly affect constraints on the modified-gravity parameters Σ₀ and µ₀. It identifies intrinsic alignment, rather than either bias, as shifting the constraints. (LLM, conf=0.95)
Checked by a reasoning model — may be wrong.
plainstates a cause- Asserted: passes — The authors put it forward as true.
- Checkable: passes — It can be checked against evidence.
- Load-bearing: passes — The paper’s conclusions depend on it.
- Based: passes — The paper gives a reason why it holds.
- Disputed
The cited sources that could be checked couldn’t confirm or dispute this claim.
In the paper
“These seed fluctuations would have originated from microscopic quantum fluctuations that have been blown up to macroscopic scales by cosmic inflation (Guth 1981; Bardeen et al. 1983; Albrecht and Steinhardt 1982).”
§ Testing general relativity in cosmology > The standard model of cosmology > The inhomogeneous lumpy universe and the growth of large-scale structure
What the sources say
- Could not verifycites Guth 1981 sourceExperimental — accuracy not yet measured
The passages on exponential expansion and inhomogeneities (indexed as Abstract; page unavailable) discuss inflation and random bubble formation, but do not identify microscopic quantum fluctuations as the origin of seed fluctuations. Searches for quantum fluctuations, density perturbations, and seed fluctuations found no passage making that connection. (LLM, conf=0.75)
- Not checked — no full text of the sourcecites Bardeen et al. 1983 source
- Not checked — no full text of the sourcecites Albrecht and Steinhardt 1982 source
hedgedstates a cause- Asserted: passes — The authors put it forward as true.
- Checkable: passes — It can be checked against evidence.
- Load-bearing: unclear — It is unclear whether the paper’s conclusions depend on it.
- Based: passes — The paper gives a reason why it holds.
- Could not verify
Every source the paper cites for this claim was checked and supports it.
In the paper
“it has established very stringent constraints at the level of the solar system that any gravity theory must pass.”
§ Testing general relativity in cosmology > Introduction
What the sources say
- Supportedcites Will 2014 source
In “Tests of the strong equivalence principle” (page unavailable), the review describes solar-system experiments that test effects expected in many metric theories of gravity. It also calls the solar-system Cassini bound on a scalar-tensor parameter “very tight” and notes that alternative theories seek to preserve GR’s solar-system phenomenology. Together, these support the claim that gravity theories face stringent solar-system constraints. (LLM, conf=0.90)
boostedstates a cause- Asserted: passes — The authors put it forward as true.
- Checkable: passes — It can be checked against evidence.
- Load-bearing: passes — The paper’s conclusions depend on it.
- Based: passes — The paper gives a reason why it holds.
- Supported
The cited sources that could be checked couldn’t confirm or dispute this claim.
In the paper
“The standard picture of structure formation in the universe is that structures have grown by gravitational infall and clustering from primordial small fluctuations in the matter density field.”
§ Testing general relativity in cosmology > The standard model of cosmology > The inhomogeneous lumpy universe and the growth of large-scale structure
What the sources say
- Could not verifycites Guth 1981 sourceExperimental — accuracy not yet measured
The Introduction and Conclusion passages discuss the early universe’s homogeneity, horizon and flatness problems, and possible inhomogeneity from inflationary bubble formation. Searches for gravitational clustering, primordial density fluctuations, and galaxy formation found no passage in our copy describing the claimed mechanism of structure formation. (LLM, conf=0.73)
- Not checked — no full text of the sourcecites Bardeen et al. 1983 source
- Not checked — no full text of the sourcecites Albrecht and Steinhardt 1982 source
plainstates a cause- Asserted: passes — The authors put it forward as true.
- Checkable: passes — It can be checked against evidence.
- Load-bearing: unclear — It is unclear whether the paper’s conclusions depend on it.
- Based: passes — The paper gives a reason why it holds.
- Could not verify
219 more claims · 33 with their cited sources checked
Create a free account to see all 525 claims and to verify the 291 references still open.
- It may state two separate claims as one. 223
- Probably not a substantial claim. 125
- The quote only partly states this claim. 15
Citations
Cites
A new look at the statistical model identification
Akaike, H. (1974) · IEEE Transactions on Automatic Control · doi:10.1109/tac.1974.1100705 · Cited by 51,879
Equation of State Calculations by Fast Computing Machines
Metropolis, N., Rosenbluth, A. W., Rosenbluth, M. N., Teller, A. H., & Teller, E. (1953) · The Journal of Chemical Physics · doi:10.1063/1.1699114 · Cited by 37,192
Observational Evidence from Supernovae for an Accelerating Universe and a Cosmological Constant
Riess, A. G., Filippenko, A. V., Challis, P., Clocchiatti, A., Diercks, A., Garnavich, P. M., Gilliland, R. L., Hogan, C. J., Jha, S., Kirshner, R. P., et al. (1998) · The Astronomical Journal · doi:10.1086/300499 · Cited by 19,704
Measurements of Ω and Λ from 42 High‐Redshift Supernovae
Perlmutter, S., Aldering, G., Goldhaber, G., Knop, R. A., Nugent, P., Castro, P. G., Deustua, S., Fabbro, S., Goobar, A., Groom, D. E., et al. (1999) · The Astrophysical Journal · doi:10.1086/307221 · Cited by 18,062
Observation of Gravitational Waves from a Binary Black Hole Merger
Abbott, B. P., Abbott, R., Abbott, T. D., Abernathy, M. R., Acernese, F., Ackley, K., Adams, C., Adams, T., Addesso, P., Adhikari, R. X., et al. (2016) · Physical Review Letters · doi:10.1103/physrevlett.116.061102 · Cited by 14,151
Spergel, D. N., Verde, L., Peiris, H. V., Komatsu, E., Nolta, M. R., Bennett, C. L., Halpern, M., Hinshaw, G., Jarosik, N., Kogut, A., et al. (2003) · The Astrophysical Journal Supplement Series · doi:10.1086/377226 · Cited by 10,976
Planck 2015 results. XIII. Cosmological parameters
Planck Collaboration, Ade, P. A. R., Aghanim, N., Arnaud, M., Ashdown, M., Aumont, J., Baccigalupi, C., Banday, A. J., Barreiro, R. B., Bartlett, J. G., et al. (2015) · arXiv · doi:10.48550/arxiv.1502.01589 · Cited by 10,720
Planck 2015 results: XIII. Cosmological parameters
Planck Collaboration, Ade, P. A. R., Aghanim, N., Arnaud, M., Ashdown, M., Aumont, J., Baccigalupi, C., Banday, A. J., Barreiro, R. B., Bartlett, J. G., et al. (2016) · Astronomy & Astrophysics · doi:10.1051/0004-6361/201525830 · Cited by 10,583
Inflationary universe: A possible solution to the horizon and flatness problems
Guth, A. H. (1981) · Physical Review D · doi:10.1103/physrevd.23.347 · Cited by 9,983
GW170817: Observation of Gravitational Waves from a Binary Neutron Star Inspiral
Abbott, B. P., Abbott, R., Abbott, T. D., Acernese, F., Ackley, K., Adams, C., Adams, T., Addesso, P., Adhikari, R. X., Adya, V. B., et al. (2017) · Physical Review Letters · doi:10.1103/physrevlett.119.161101 · Cited by 9,473
Research works printed but not linked: 10
- Cartan E (1922a) Sur les équations de la gravitation d’Einstein. J Math Pures Appl 1922(1):141–202
- Debever R (1964) Le rayonnement gravitationnel. le tenseur de Riemann en relativité générale. Cah Phys 168:303
- Eddington A (1924) The mathematical theory of general relativity. CUP, Cambridge
- Klein O (1926a) Quantentheorie und Fünfdimensionale Relativitätstheorie. Z Phys A 37:895?906
- Könnig F, Akrami Y, Amendola L, Motta M, Solomon A (2014) Stable and unstable cosmological models in bimetric massive gravity. Phys Rev D 90:124014. https://doi.org/10.1103/PhysRevD.90.124014 . arXiv:1407.4331 · DOI · Paper page
- Lifshitz EM (1941) On the theory of second-order phase transitions I. Zh Eksp Teor Fiz 11:255
- Misner CW, Thorne KS, Wheeler JA (1973) Gravitation. Princeton University Press, Princeton
- Peacock JA (1999) Cosmological physics. Cambridge University Press, Cambridge
- Schwarzschild K (1916) Über das Gravitationsfeld eines Massenpunktes nach der Einsteinschen Theorie. Sitzungsber Koenigl Preuss Akad Wiss 7:189–196
- Segre C (1884) Sulla teoria e sulla classificazione delle omografie in uno spazio lineare ad uno numero qualunque di dimensioni. Mem R Accad Lincei, Ser 3 XIX:127–148
Cited by
Modified gravity and cosmology
Clifton, T., Ferreira, P. G., Padilla, A., & Skordis, C. (2012) · Physics Reports · doi:10.1016/j.physrep.2012.01.001 · Cited by 4,146
Theory and Experiment in Gravitational Physics
Will, C. M. (2018) · doi:10.1017/9781316338612 · Cited by 3,637
DESI 2024 VI: cosmological constraints from the measurements of baryon acoustic oscillations
Adame, A. G., Aguilar, J., Ahlen, S., Alam, S., Alexander, D. M., Alvarez, M., Alves, O., Anand, A., Andrade, U., Armengaud, E., et al. (2025) · Journal of Cosmology and Astroparticle Physics · doi:10.1088/1475-7516/2025/02/021 · Cited by 1,136
Self-citationChallenges for Λ CDM: An update
Perivolaropoulos, L., & Skara, F. (2022) · New Astronomy Reviews · doi:10.1016/j.newar.2022.101659 · Cited by 902
DESI DR2 results. II. Measurements of baryon acoustic oscillations and cosmological constraints
Abdul Karim, M., Aguilar, J., Ahlen, S., Alam, S., Allen, L., Prieto, C. A., Alves, O., Anand, A., Andrade, U., Armengaud, E., et al. (2025) · Physical Review D · doi:10.1103/tr6y-kpc6 · Cited by 856
Self-citation
Metadata
- Authors
- Ishak, M.
- Affiliations
- The University of Texas at Dallas (US)
- Corresponding author
- Ishak, Mustapha
- ORCID
- Ishak, Mustapha
- Venue
- Living Reviews in Relativity
- Published
- 2018-12-18
- Volume
- 22
- Issue
- 1
- Pages
- 1-1
- ISSN
- 1433-8351 (ISSN-L)
- 2367-3613
- PMC
- PMC6299071
- OpenAlex
- W2809838409
- Cited by
- 449
- References
- 1,256
- Citations by year
- 2026: 28 · 2025: 69 · 2024: 60 · 2023: 46 · 2022: 52 · 2021: 49 · 2020: 70 · 2019: 57 · 2018: 15
- FWCI
- 4.35
- Type
- journal article
- Language
- en
- Open access
- diamond
- doi.org
- Licence
- cc-by
- creativecommons.org/licenses/by/4.0 (tdm)
- creativecommons.org/licenses/by/4.0 (vor)
- Locations
- Living Reviews in Relativity (publishedVersion, cc-by)
- arXiv (Cornell University) (publishedVersion)
- Europe PMC (PubMed Central) (publishedVersion, other-oa)
- PubMed Central (publishedVersion, cc-by)
- PubMed (publishedVersion)
- DOAJ (DOAJ: Directory of Open Access Journals) (submittedVersion, cc-by-sa)
- OSTI OAI (U.S. Department of Energy Office of Scientific and Technical Information) (submittedVersion)
- arXiv (Cornell University)
- Funders
- National Science Foundation (AST-1517768)
- Office of Science (DE-SC0019206)
- Topics
- Physical Sciences › Physics and Astronomy › Astronomy and Astrophysics › Cosmology and Gravitation Theories
- Physical Sciences › Physics and Astronomy › Nuclear and High Energy Physics › Noncommutative and Quantum Gravity Theories
- Physical Sciences › Physics and Astronomy › Astronomy and Astrophysics › Pulsars and Gravitational Waves Research
- Keywords
- tests of general relativity, modified gravity, cosmic acceleration, dark energy, gravitational screening, binary neutron star mergers, precision cosmology
About these checks
Registry, retraction, Cites and statistics results are computed, not judged, with one exception: a printed reference that no index lists is read once by a model before it counts as a citation error. Claims are extracted by a model and kept only when their quote appears verbatim in the text; each cited source is then checked, with a model’s help, for whether it says what the claim relies on. Those verdicts can be wrong — read the claim’s quote and the cited source before relying on one.
The claim verdicts this report counts are experimental: their accuracy is not yet measured.
A language model drew the claims from the paper on 2026-10-10, under version 3 of the claim definition (model deepseek-v4.1-flash, prompt extract-v3).
A second model labelled each claim on 2026-10-10 (model jev-1.13-20260917, definition revision gold-guideline-v0.2).
Cited sources are checked with a language model’s help (gpt-6-sol and qwen3.8-omni-flash).
Statistics and arithmetic are recomputed, not judged.
Confidence bands are shown only for fields calibrated on our annotated test set. None is calibrated yet, so no band is shown.
What counts as a claim ›How we measure confidence ›How we check this ›
Are you an author, or do you see a problem with this page? Request a review
How to cite
Cite CoChat for the checks on this page, and the paper for its own findings.
- This page
- CoChat. (2026). Citation check: Testing general relativity in cosmology. https://app.cochat.ai/papers/10.1007/s41114-018-0017-4
- The paper
- Ishak, M. (2019). Testing general relativity in cosmology. Living Reviews in Relativity. https://doi.org/10.1007/s41114-018-0017-4
Data sources
Bibliographic data: Semantic Scholar, OpenAlex, Crossref.
Contains information from the Semantic Scholar Academic Graph Datasets, made available under the ODC Attribution License (ODC-BY 1.0).
Semantic Scholar’s data is described in: Kinney, R., et al. (2023). The Semantic Scholar Open Data Platform. arXiv:2301.10140.
