

The DOI matches its Crossref record; 62 of the 62 references it cites were found in a registry or an index.
Introgression of Neandertal- and Denisovan-like Haplotypes Contributes to Adaptive Variation in Human Toll-like Receptors
Open accessPublished version of a preprint
Abstract
Pathogens and the diseases they cause have been among the most important selective forces experienced by humans during their evolutionary history. Although adaptive alleles generally arise by mutation, introgression can also be a valuable source of beneficial alleles. Archaic humans, who lived in Europe and Western Asia for more than 200,000 years, were probably well adapted to this environment and its local pathogens. It is therefore conceivable that modern humans entering Europe and Western Asia who admixed with them obtained a substantial immune advantage from the introgression of archaic alleles. Here we document a cluster of three Toll-like receptors (TLR6-TLR1-TLR10) in modern humans that carries three distinct archaic haplotypes, indicating repeated introgression from archaic humans. Two of these haplotypes are most similar to the Neandertal genome, and the third haplotype is most similar to the Denisovan genome. The Toll-like receptors are key components of innate immunity and provide an important first line of immune defense against bacteria, fungi, and parasites. The unusually high allele frequencies and unexpected levels of population differentiation indicate that there has been local positive selection on multiple haplotypes at this locus. We show that the introgressed alleles have clear functional effects in modern humans; archaic-like alleles underlie differences in the expression of the TLR genes and are associated with increased [corrected] microbial resistance and increased allergic disease in large cohorts. This provides strong evidence for recurrent adaptive introgression at the TLR6-TLR1-TLR10 locus, resulting in differences in disease phenotypes in modern humans.
Overview
The claims and statistics of this paper haven’t been checked yet.
Run the check — free, no account needed. It reads the open-access text and checks the sources it cites.
Integrity signals
Registry
Cites
Statistics
Figures
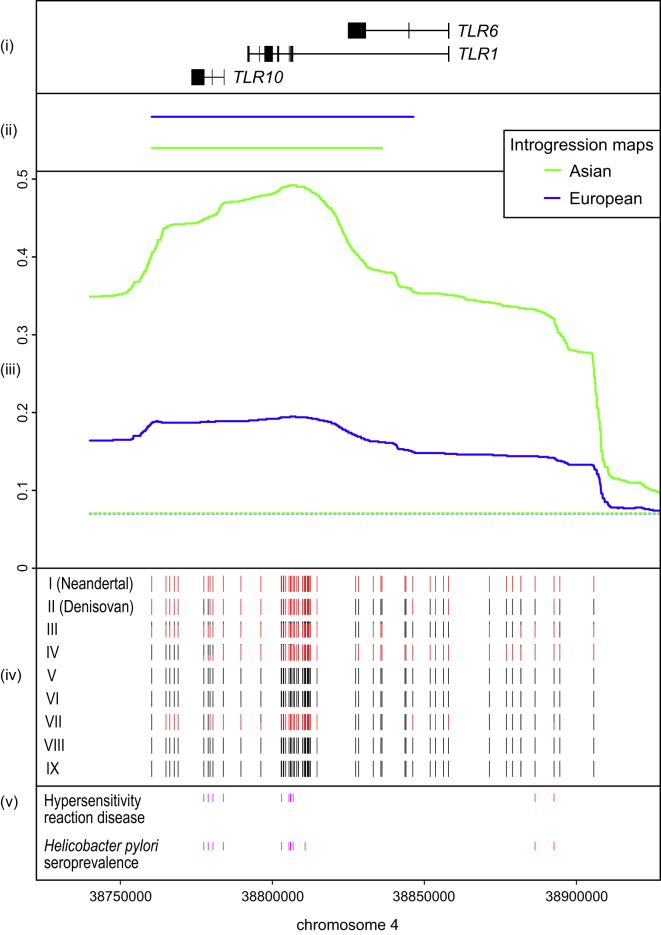
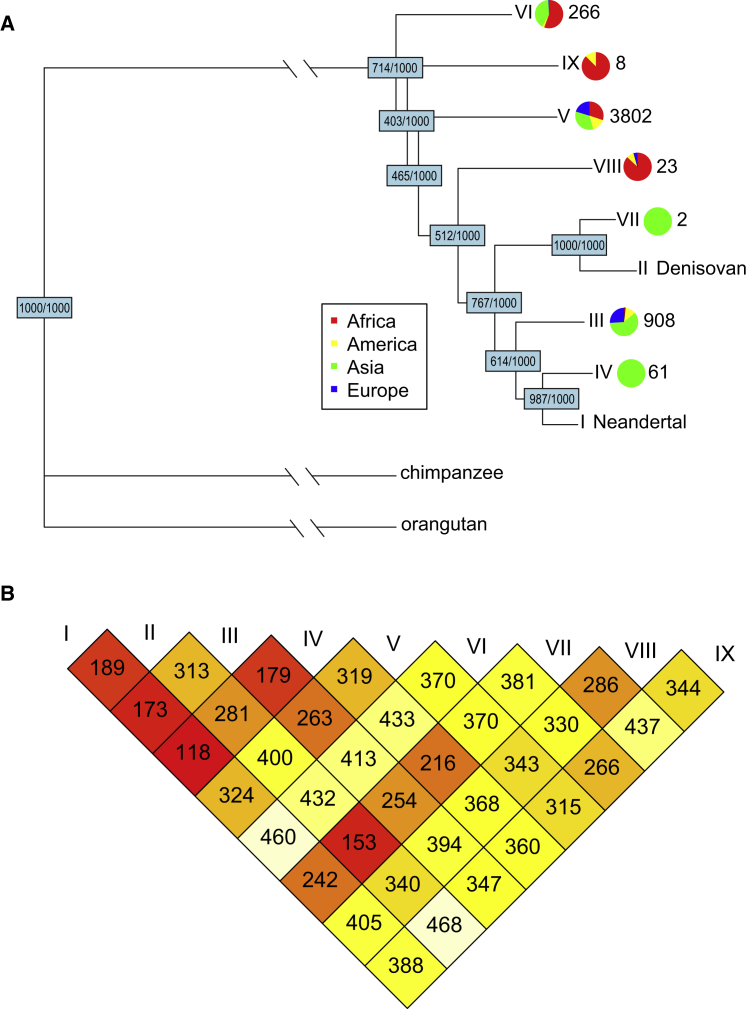
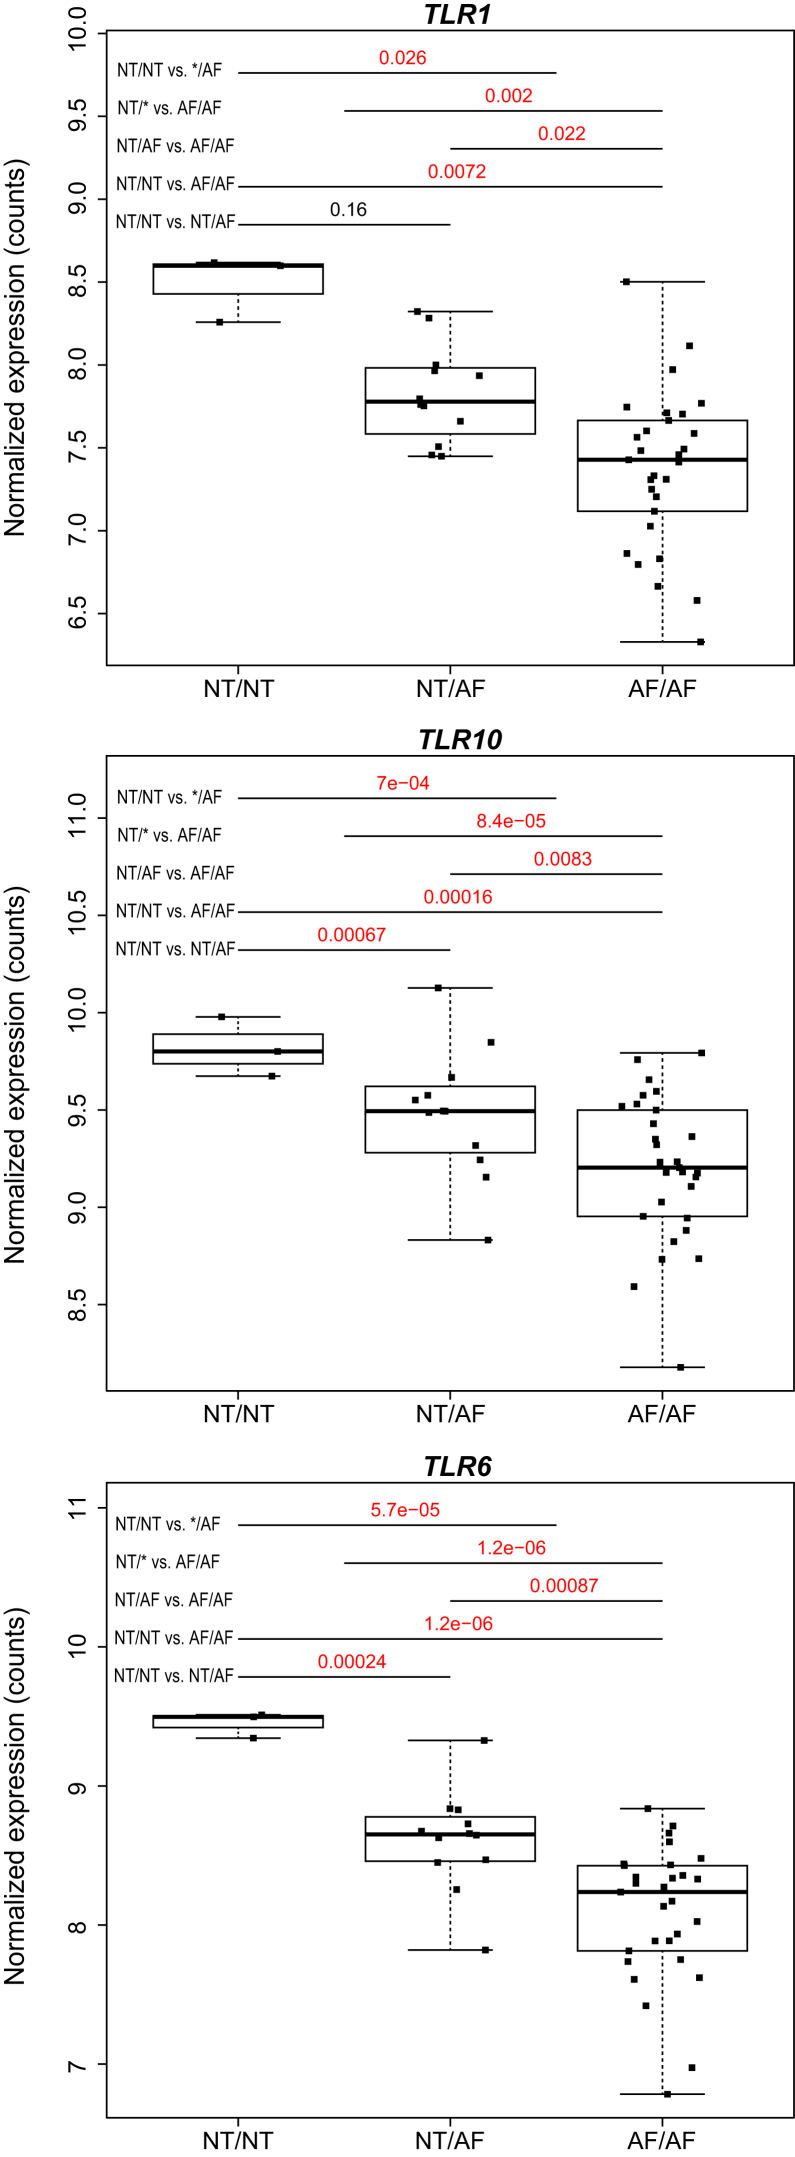
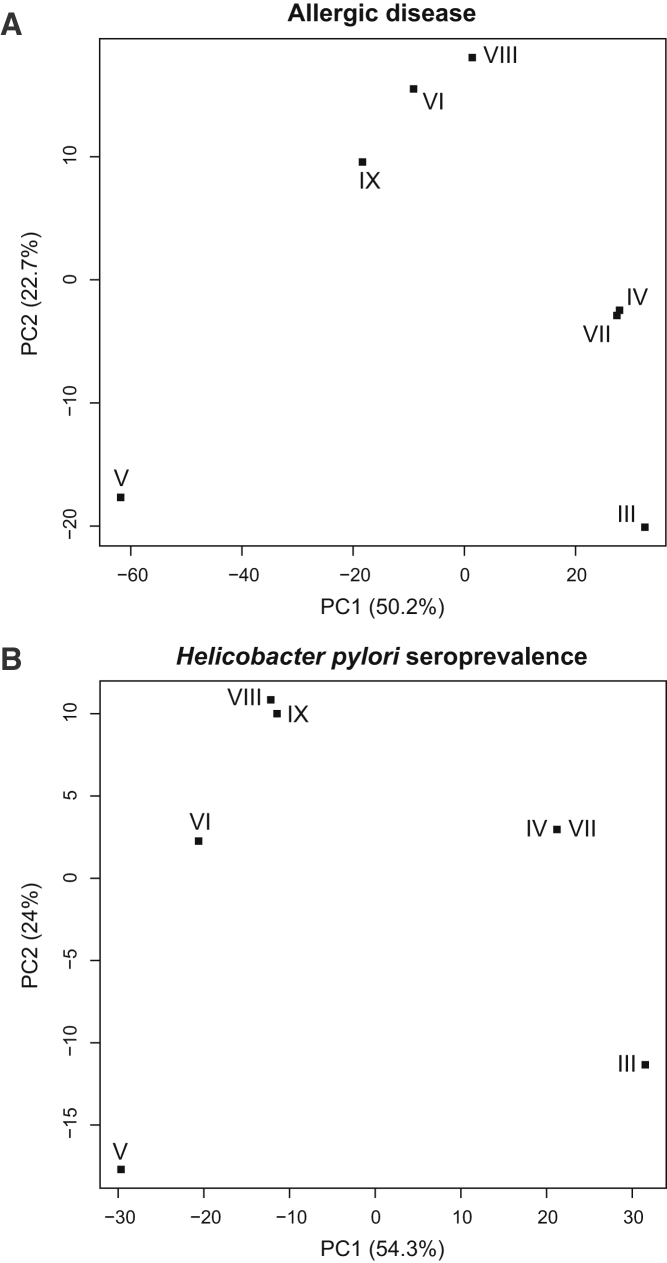
Verification
Claims the paper makes
The claims and statistics of this paper haven’t been checked yet.
Run the check — free, no account needed. It reads the open-access text and checks the sources it cites.
Claims other papers make about this one
Each is checked against this paper’s own text: does it say what the citing paper says it does?
In the citing paper
“Some archaic alleles have been shown to confer an adaptive advantage for modern humans”
From Functional implications of Neandertal introgression in modern humans (2017) · cites this paper as [1]
In the citing paper
“a number of instances of adaptive introgression have been described, generally affecting systems that influence immune and metabolic phenotypes [1, 5, 10, 22, 40, 41].”
From Functional implications of Neandertal introgression in modern humans (2017) · cites this paper as [1]
Self-check
Percentages, sums and reported differences re-computed from the paper’s own numbers.
The self-check needs the paper’s full text.
Citations
Cites
Moderated estimation of fold change and dispersion for RNA-seq data with DESeq2
Love, M. I., Huber, W., & Anders, S. (2014) · Genome Biology · doi:10.1186/s13059-014-0550-8 · Cited by 95,106
Gene Ontology: tool for the unification of biology
Ashburner, M., Ball, C. A., Blake, J. A., Botstein, D., Butler, H., Cherry, J. M., Davis, A. P., Dolinski, K., Dwight, S. S., Eppig, J. T., et al. (2000) · Nature Genetics · doi:10.1038/75556 · Cited by 43,206
ESTIMATING F -STATISTICS FOR THE ANALYSIS OF POPULATION STRUCTURE
Weir, B. S., & Cockerham, C. C. (1984) · Evolution · doi:10.1111/j.1558-5646.1984.tb05657.x · Cited by 18,909
A global reference for human genetic variation
The 1000 Genomes Project Consortium, authors, C., Auton, A., Abecasis, G. R., Steering committee, Altshuler, D. M., Durbin, R. M., Abecasis, G. R., Bentley, D. R., Chakravarti, A., et al. (2015) · Nature · doi:10.1038/nature15393 · Cited by 18,247
An integrated encyclopedia of DNA elements in the human genome
The ENCODE Project Consortium (2012) · Nature · doi:10.1038/nature11247 · Cited by 18,072
The variant call format and VCFtools
Danecek, P., Auton, A., Abecasis, G. R., Albers, C. A., Banks, E., DePristo, M. A., Handsaker, R. E., Lunter, G. A., Marth, G., Sherry, S. T., et al. (2011) · Bioinformatics · doi:10.1093/bioinformatics/btr330 · Cited by 16,450
Differential expression analysis for sequence count data
Anders, S., & Huber, W. (2010) · Genome Biology · doi:10.1186/gb-2010-11-10-r106 · Cited by 15,581
Statistical method for testing the neutral mutation hypothesis by DNA polymorphism.
Tajima, F. (1989) · Genetics · doi:10.1093/genetics/123.3.585 · Cited by 14,056
Pathogen Recognition and Innate Immunity
Akira, S., Uematsu, S., & Takeuchi, O. (2006) · Cell · doi:10.1016/j.cell.2006.02.015 · Cited by 12,401
APE: analyses of phylogenetics and evolution in R language
Paradis, E., Claude, J., & Strimmer, K. (2004) · Bioinformatics · doi:10.1093/bioinformatics/btg412 · Cited by 11,335
Cited by
Sorted by citations
A high-coverage Neandertal genome from Vindija Cave in Croatia
Prüfer, K., de Filippo, C., Grote, S., Mafessoni, F., Korlević, P., Hajdinjak, M., Vernot, B., Skov, L., Hsieh, P., Peyrégne, S., et al. (2017) · Science · doi:10.1126/science.aao1887 · Cited by 719
Self-citationThe major genetic risk factor for severe COVID-19 is inherited from Neanderthals
Zeberg, H., & Pääbo, S. (2020) · Nature · doi:10.1038/s41586-020-2818-3 · Cited by 636
Insights from genomes into the evolutionary importance and prevalence of hybridization in nature
Taylor, S. A., & Larson, E. L. (2019) · Nature Ecology & Evolution · doi:10.1038/s41559-018-0777-y · Cited by 606
Genetic Ancestry and Natural Selection Drive Population Differences in Immune Responses to Pathogens
Nédélec, Y., Sanz, J., Baharian, G., Szpiech, Z. A., Pacis, A., Dumaine, A., Grenier, J.-C., Freiman, A., Sams, A. J., Hebert, S., et al. (2016) · Cell · doi:10.1016/j.cell.2016.09.025 · Cited by 512
Natural selection interacts with recombination to shape the evolution of hybrid genomes
Schumer, M., Xu, C., Powell, D. L., Durvasula, A., Skov, L., Holland, C., Blazier, J. C., Sankararaman, S., Andolfatto, P., Rosenthal, G. G., et al. (2018) · Science · doi:10.1126/science.aar3684 · Cited by 412
Metadata
- Authors
- Dannemann, M., Andrés, A. M., & Kelso, J.
- Affiliations
- Max Planck Institute for Evolutionary Anthropology (DE)
- Corresponding author
- Kelso, Janet
- Venue
- The American Journal of Human Genetics
- Publisher
- Elsevier BV
- Published
- 2016-01
- Volume
- 98
- Issue
- 1
- Pages
- 22-33
- ISSN
- 0002-9297 (ISSN-L)
- PMC
- PMC4716682
- OpenAlex
- W2226561648
- Cited by
- 249
- References
- 61
- Citations by year
- 2026: 16 · 2025: 10 · 2024: 19 · 2023: 17 · 2022: 22 · 2021: 30 · 2020: 27 · 2019: 30 · 2018: 24 · 2017: 23 · 2016: 29
- FWCI
- 137.50
- Type
- journal article
- Language
- en
- Update notices
- erratum (2016-02-04)
- Open access
- hybrid
- doi.org
- Licence
- Locations
- The American Journal of Human Genetics (publishedVersion, cc-by-nc-nd)
- bioRxiv (Cold Spring Harbor Laboratory) (acceptedVersion, cc-by-nd)
- Europe PMC (PubMed Central) (publishedVersion, cc-by-nc-nd)
- PubMed Central (publishedVersion, cc-by-nc-nd)
- PubMed (publishedVersion)
- MPG.PuRe (Max Planck Society) (submittedVersion, cc-by-nc-nd)
- Funders
- Deutsche Forschungsgemeinschaft (SFB 1052, project A02)
- Max-Planck-Gesellschaft
- Topics
- Social Sciences › Anthropology › Pleistocene-Era Hominins and Archaeology
- Life Sciences › Biochemistry, Genetics and Molecular Biology › Genetics › Forensic and Genetic Research
- Life Sciences › Biochemistry, Genetics and Molecular Biology › Genetics › Genetic Associations and Epidemiology
- Keywords
- adaptive introgression, Neanderthals, Denisovans, Toll-like receptors, archaic human admixture, positive selection, innate immunity, microbial resistance, allergic diseases, gene expression, allele frequency, genetic differentiation
- MeSH terms
- Adaptation, Physiological, Animals, Cell Line, Haplotypes, Humans, Polymorphism, Single Nucleotide, Toll-Like Receptors, Neanderthals
About these checks
Registry, retraction, Cites and statistics results are computed, not judged, with one exception: a printed reference that no index lists is read once by a model before it counts as a citation error. Claims are extracted by a model and kept only when their quote appears verbatim in the text; each cited source is then checked, with a model’s help, for whether it says what the claim relies on. Those verdicts can be wrong — read the claim’s quote and the cited source before relying on one.
Statistics and arithmetic are recomputed, not judged.
Confidence bands are shown only for fields calibrated on our annotated test set. None is calibrated yet, so no band is shown.
What counts as a claim ›How we measure confidence ›How we check this ›
Are you an author, or do you see a problem with this page? Request a review
