

The DOI matches its Crossref record; 83 of the 84 references it cites were found in a registry or an index.
YY1 Haploinsufficiency Causes an Intellectual Disability Syndrome Featuring Transcriptional and Chromatin Dysfunction
Open accessAbstract
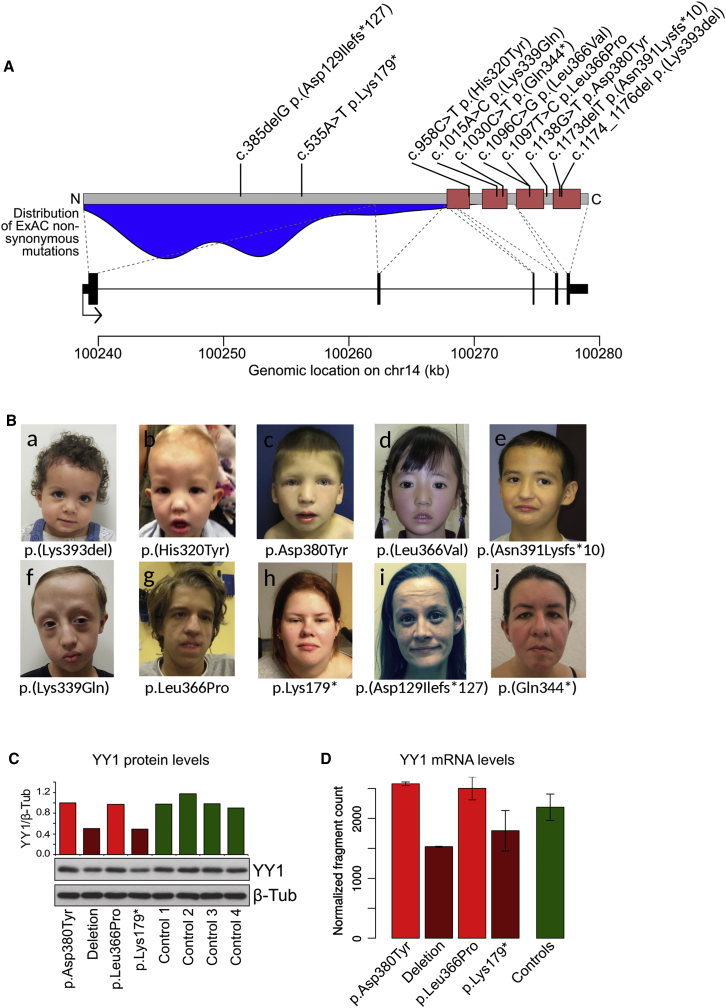
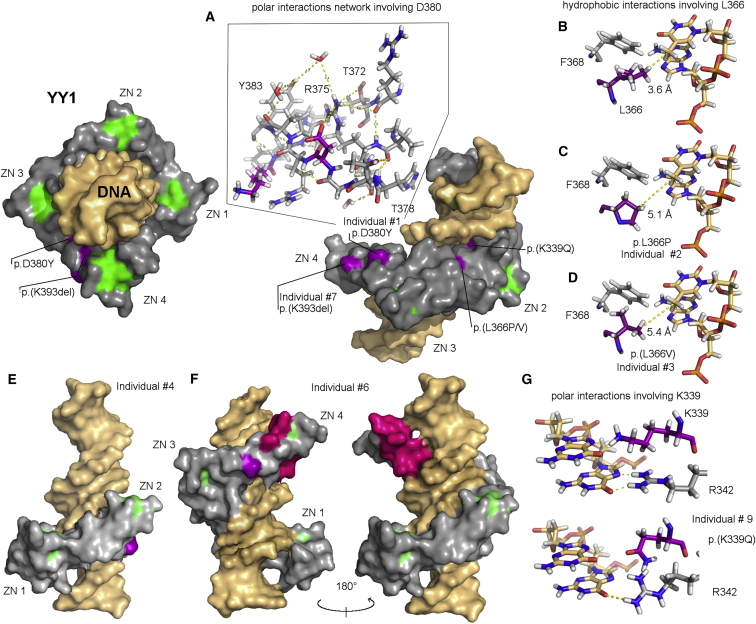
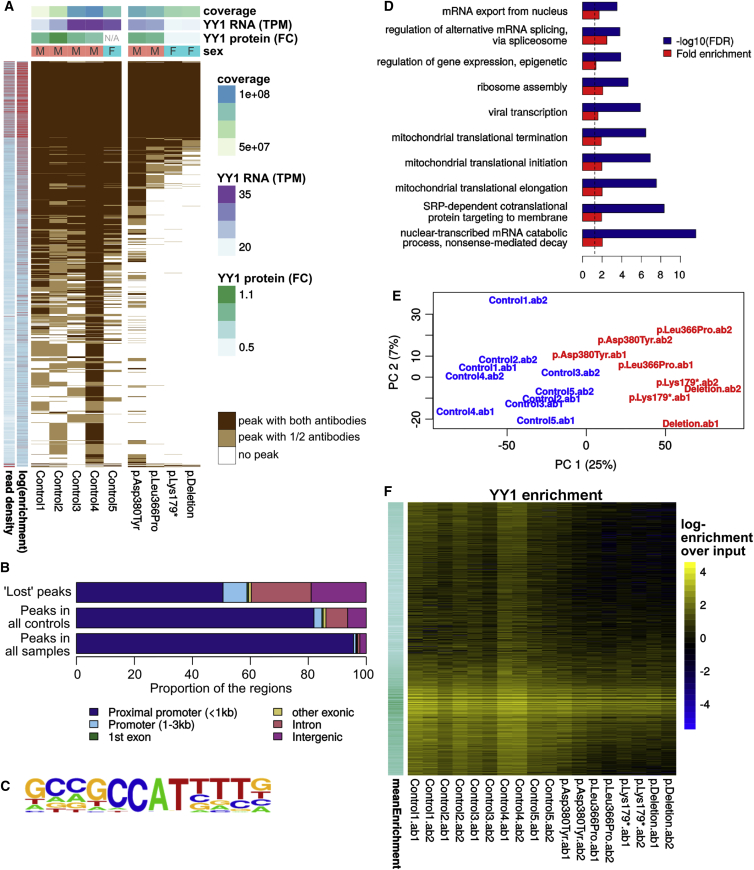
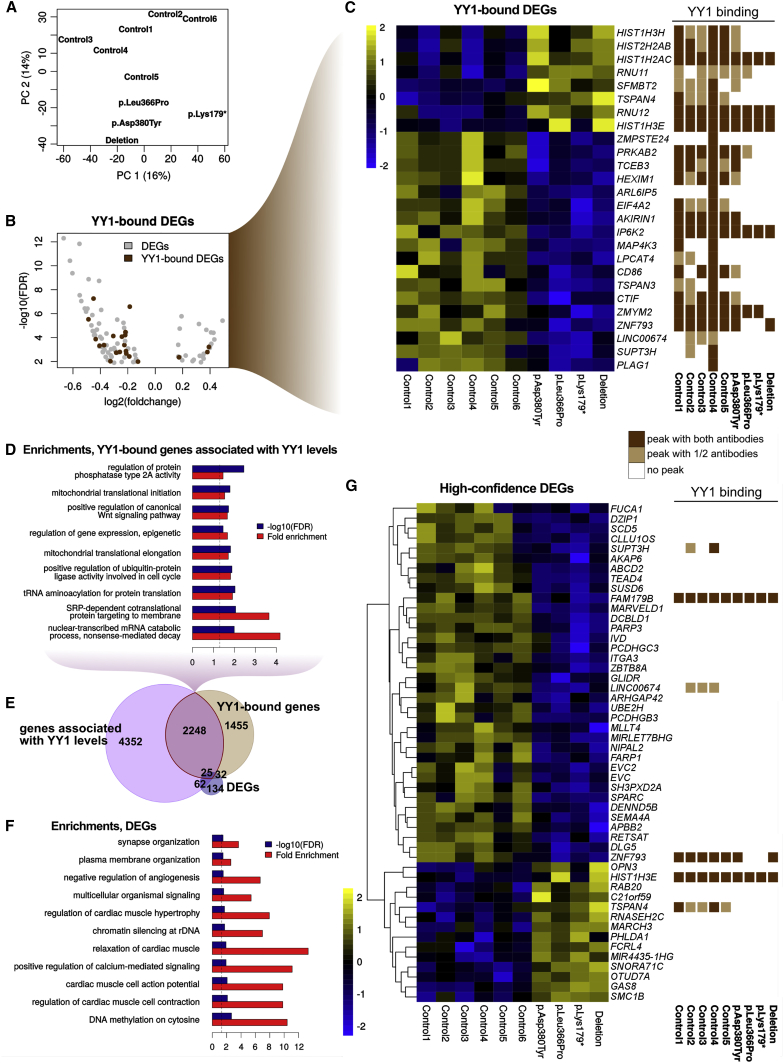
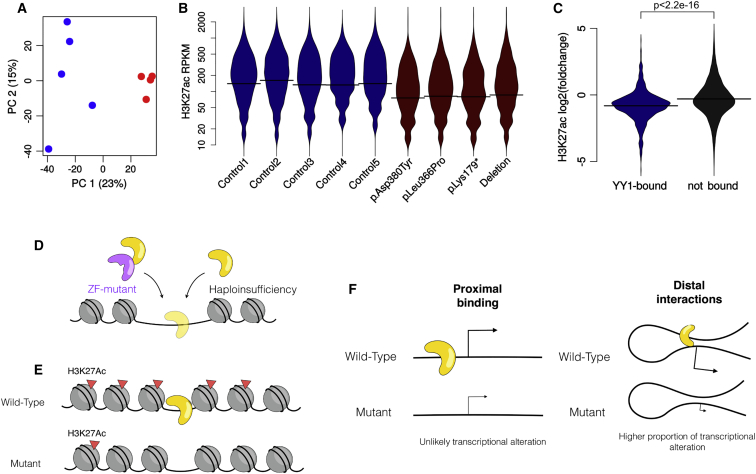
Yin and yang 1 (YY1) is a well-known zinc-finger transcription factor with crucial roles in normal development and malignancy. YY1 acts both as a repressor and as an activator of gene expression. We have identified 23 individuals with de novo mutations or deletions of YY1 and phenotypic features that define a syndrome of cognitive impairment, behavioral alterations, intrauterine growth restriction, feeding problems, and various congenital malformations. Our combined clinical and molecular data define "YY1 syndrome" as a haploinsufficiency syndrome. Through immunoprecipitation of YY1-bound chromatin from affected individuals' cells with antibodies recognizing both ends of the protein, we show that YY1 deletions and missense mutations lead to a global loss of YY1 binding with a preferential retention at high-occupancy sites. Finally, we uncover a widespread loss of H3K27 acetylation in particular on the YY1-bound enhancers, underscoring a crucial role for YY1 in enhancer regulation. Collectively, these results define a clinical syndrome caused by haploinsufficiency of YY1 through dysregulation of key transcriptional regulators.
Overview
The claims and statistics of this paper haven’t been checked yet.
Run the check — free, no account needed. It reads the open-access text and checks the sources it cites.
Integrity signals
Registry
Cites
Statistics
Figures
Verification
Claims the paper makes
The claims and statistics of this paper haven’t been checked yet.
Run the check — free, no account needed. It reads the open-access text and checks the sources it cites.
Claims other papers make about this one
Each is checked against this paper’s own text: does it say what the citing paper says it does?
In the citing paper
“several of which are themselves causative genes of intellectual disability syndromes with neurocristopathic involvement, as in the case of our recently identified Gabriele–de Vries syndrome caused by YY1 haploinsufficiency (31, 32).”
From Dosage analysis of the 7q11.23 Williams region identifies BAZ1B as a major human gene patterning the modern human face and underlying self-domestication (2019) · cites this paper as [31]
Self-check
Percentages, sums and reported differences re-computed from the paper’s own numbers.
The self-check needs the paper’s full text.
Citations
Cites
Moderated estimation of fold change and dispersion for RNA-seq data with DESeq2
Love, M. I., Huber, W., & Anders, S. (2014) · Genome Biology · doi:10.1186/s13059-014-0550-8 · Cited by 95,106
Fast and accurate short read alignment with Burrows-Wheeler transform
Li, H., & Durbin, R. (2009) · Bioinformatics · doi:10.1093/bioinformatics/btp324 · Cited by 58,607
Trott, O., & Olson, A. J. (2010) · Journal of Computational Chemistry · doi:10.1002/jcc.21334 · Cited by 38,412
Comparison of simple potential functions for simulating liquid water
Jorgensen, W. L., Chandrasekhar, J., Madura, J., Impey, R., & Klein, M. (1983) · The Journal of Chemical Physics · doi:10.1063/1.445869 · Cited by 38,397
The Genome Analysis Toolkit: A MapReduce framework for analyzing next-generation DNA sequencing data
McKenna, A., Hanna, M., Banks, E., Sivachenko, A., Cibulskis, K., Kernytsky, A., Garimella, K., Altshuler, D., Gabriel, S., Daly, M., et al. (2010) · Genome Research · doi:10.1101/gr.107524.110 · Cited by 27,895
Abraham, M. J., Murtola, T., Schulz, R., Páll, S., Smith, J. C., Hess, B., & Lindahl, E. (2015) · SoftwareX · doi:10.1016/j.softx.2015.06.001 · Cited by 27,190
Heinz, S., Benner, C., Spann, N., Bertolino, E., Lin, Y. C., Laslo, P., Cheng, J. X., Murre, C., Singh, H., & Glass, C. K. (2010) · Molecular Cell · doi:10.1016/j.molcel.2010.05.004 · Cited by 13,382
A method and server for predicting damaging missense mutations.
Adzhubei, I. A., Schmidt, S., Peshkin, L., Ramensky, V. E., Gerasimova, A., Bork, P., Kondrashov, A. S., & Sunyaev, S. R. (2010) · Nature Methods · doi:10.1038/nmeth0410-248 · Cited by 13,194
Salmon provides fast and bias-aware quantification of transcript expression
Patro, R., Duggal, G., Love, M. I., Irizarry, R. A., & Kingsford, C. (2017) · Nature Methods · doi:10.1038/nmeth.4197 · Cited by 12,700
A 3D Map of the Human Genome at Kilobase Resolution Reveals Principles of Chromatin Looping
Rao, S. S. P., Huntley, M. H., Durand, N. C., Stamenova, E. K., Bochkov, I. D., Robinson, J. T., Sanborn, A. L., Machol, I., Omer, A. D., Lander, E. S., et al. (2014) · Cell · doi:10.1016/j.cell.2014.11.021 · Cited by 9,212
Shrestha, S., & Offer, S. M. (2016) · Medical Epigenetics · doi:10.1159/000444713 · Cited by 8,951
Gene ontology analysis for RNA-seq: accounting for selection bias
Young, M. D., Wakefield, M. J., Smyth, G. K., & Oshlack, A. (2010) · Genome Biology · doi:10.1186/gb-2010-11-2-r14 · Cited by 7,107
The International HapMap Project
†The International HapMap Consortium, Genotyping centres: Baylor College of Medicine and ParAllele BioScience, Gibbs, R. A., Belmont, J. W., Hardenbol, P., Willis, T. D., Yu, F., Chinese HapMap Consortium, Yang, H., Ch'ang, L.-Y., et al. (2003) · Nature · doi:10.1038/nature02168 · Cited by 6,057
Improved side-chain torsion potentials for the Amber ff99SB protein force field
Lindorff-Larsen, K., Piana, S., Palmo, K., Maragakis, P., Klepeis, J., Dror, R., & Shaw, D. (2010) · Proteins: Structure, Function, and Bioinformatics · doi:10.1002/prot.22711 · Cited by 6,056
Comparative Protein Structure Modeling Using Modeller
Eswar, N., Webb, B., Martı́-Renom, M. A., Madhusudhan, M. S., Eramian, D., Shen, M., Pieper, U., & Šali, A. (2006) · Current Protocols in Bioinformatics · doi:10.1002/0471250953.bi0506s15 · Cited by 4,618
Comparative Protein Structure Modeling Using MODELLER
Webb, B., & Šali, A. (2016) · Current Protocols in Bioinformatics · doi:10.1002/cpbi.3 · Cited by 4,404
MutationTaster2: mutation prediction for the deep-sequencing age
Schwarz, J. M., Cooper, D. N., Schuelke, M., & Seelow, D. (2014) · Nature Methods · doi:10.1038/nmeth.2890 · Cited by 3,362
Comparative Protein Structure Modeling Using MODELLER
Eswar, N., Webb, B., Martı́-Renom, M. A., Madhusudhan, M. S., Eramian, D., Shen, M., Pieper, U., & Šali, A. (2007) · Current Protocols in Protein Science · doi:10.1002/0471140864.ps0209s50 · Cited by 2,874
Synaptic, transcriptional and chromatin genes disrupted in autism
Study, T. D., De Rubeis, S., Autism, H. M. C. F., UK10K Consortium, The Autism Sequencing Consortium, He, X., Goldberg, A. P., Poultney, C. S., Samocha, K., Ercument Cicek, A., et al. (2014) · Nature · doi:10.1038/nature13772 · Cited by 2,746
Mahoney, M. W., & Jorgensen, W. L. (2000) · The Journal of Chemical Physics · doi:10.1063/1.481505 · Cited by 2,082
Clinical Whole-Exome Sequencing for the Diagnosis of Mendelian Disorders
Yang, Y., Muzny, D. M., Reid, J. G., Bainbridge, M. N., Willis, A. S., Ward, P. A., Braxton, A. A., Beuten, J., Xia, F., Niu, Z., et al. (2013) · New England Journal of Medicine · doi:10.1056/nejmoa1306555 · Cited by 1,991
DECIPHER: Database of Chromosomal Imbalance and Phenotype in Humans Using Ensembl Resources
Firth, H. V., Richards, S. M., Bevan, A. P., Clayton, S., Corpas, M., Rajan, D., Vooren, S. V., Moreau, Y., Pettett, R. M., & Carter, N. P. (2009) · The American Journal of Human Genetics · doi:10.1016/j.ajhg.2009.03.010 · Cited by 1,990
GeneMatcher: a matching tool for connecting investigators with an interest in the same gene.
Sobreira, N., Schiettecatte, F., Valle, D., & Hamosh, A. (2015) · Human Mutation · doi:10.1002/humu.22844 · Cited by 1,529
Architecture of the human regulatory network derived from ENCODE data
Gerstein, M., Kundaje, A. B., Hariharan, M., Landt, S. G., Yan, K., Cheng, C., Mu, X. J., Khurana, E., Rozowsky, J. S., Alexander, R. P., et al. (2012) · Nature · doi:10.1038/nature11245 · Cited by 1,451
Sanders, S. J., Ercan-Sencicek, A. G., Hus, V., Luo, R., Murtha, M. T., Moreno-De-Luca, D., Chu, S. H., Moreau, M. P., Gupta, A. R., Thomson, S. A., et al. (2011) · Neuron · doi:10.1016/j.neuron.2011.05.002 · Cited by 1,263
Comparative Protein Structure Modeling Using MODELLER
Webb, B., & Šali, A. (2014) · Current Protocols in Bioinformatics · doi:10.1002/0471250953.bi0506s47 · Cited by 1,156
Shi, Y., Seto, E., Chang, L., & Shenk, T. E. (1991) · Cell · doi:10.1016/0092-8674(91)90189-6 · Cited by 1,035
A de novo paradigm for mental retardation.
Vissers, L. E. L. M., de Ligt, J., Gilissen, C., Janssen, I., Steehouwer, M., de Vries, P., van Lier, B., Arts, P., Wieskamp, N., del Rosario, M., et al. (2010) · Nature Genetics · doi:10.1038/ng.712 · Cited by 852
Pober, B. R. (2010) · New England Journal of Medicine · doi:10.1056/nejmra0903074 · Cited by 848
Transcriptome genetics using second generation sequencing in a Caucasian population
Montgomery, S. B., Sammeth, M., Gutierrez-Arcelus, M., Lach, R. P., Ingle, C., Nisbett, J., Guigo, R., & Dermitzakis, E. T. (2010) · Nature · doi:10.1038/nature08903 · Cited by 797
Transcription factor YY1: structure, function, and therapeutic implications in cancer biology
Gordon, S., Akopyan, G. G., Garbán, H., & Bonavida, B. (2005) · Oncogene · doi:10.1038/sj.onc.1209080 · Cited by 760
HiCUP: pipeline for mapping and processing Hi-C data
Wingett, S., Ewels, P., Furlan-Magaril, M., Nagano, T., Schoenfelder, S., Fraser, P., & Andrews, S. (2015) · F1000Research · doi:10.12688/f1000research.7334.1 · Cited by 734
Haploinsufficiency of NSD1 causes Sotos syndrome
Kurotaki, N., Imaizumi, K., Harada, N., Masuno, M., Kondoh, T., Nagai, T., Ohashi, H., Naritomi, K., Tsukahara, M., Makita, Y., et al. (2002) · Nature Genetics · doi:10.1038/ng863 · Cited by 647
G, C., Padova, M. D., GE, L., Lyons, G. E., & Sartorelli, V. (2004) · Genes & Development · doi:10.1101/gad.1241904 · Cited by 611
Luiselli, J., Happe, F. G. E., Hurst, H., et al. (2012) · Springer eBooks · doi:10.1007/978-1-4419-1698-3_101563 · Cited by 539
Binding of c-Myc to chromatin mediates mitogen-induced acetylation of histone H4 and gene activationPreprint
Frank, S. R., Schroeder, M., Fernandez, P. C., Taubert, S., & Amati, B. B. (2001) · Genes & Development · doi:10.1101/gad.906601 · Cited by 511
Hagman, K. D. F., Shahmirzadi, L., El‐Khechen, D., Powis, Z., Chao, E., Davis, B. T., Baxter, R. M., Zeng, W., Mroske, C., Parra, M. C., et al. (2014) · Genetics in Medicine · doi:10.1038/gim.2014.154 · Cited by 469
Pereira, J. D., Sansom, S. N., Smith, J. C., Dobenecker, M., Tarakhovsky, A., & Livesey, F. J. (2010) · Proceedings of the National Academy of Sciences · doi:10.1073/pnas.1002530107 · Cited by 465
Meta-analysis of 2,104 trios provides support for 10 new genes for intellectual disability
Lelieveld, S. H., Reijnders, M. R. F., Pfundt, R., Yntema, H. G., Kamsteeg, E.-J., de Vries, P., de Vries, B. B. A., Willemsen, M. H., Kleefstra, T., Löhner, K., et al. (2016) · Nature Neuroscience · doi:10.1038/nn.4352 · Cited by 442
Everything you have ever wanted to know about Yin Yang 1......
Shi, Y., Lee, J.-S., & Galvin, K. M. (1997) · Biochimica et Biophysica Acta (BBA) - Reviews on Cancer · doi:10.1016/s0304-419x(96)00044-3 · Cited by 432
MAnorm: a robust model for quantitative comparison of ChIP-Seq data sets
Shao, Z., Zhang, Y., Yuan, G., Orkin, S. H., & Waxman, D. J. (2012) · Genome biology · doi:10.1186/gb-2012-13-3-r16 · Cited by 410
Palacios, D., Mozzetta, C., Consalvi, S., Caretti, G., Saccone, V., Proserpio, V., Marquez, V. E., Valente, S., Mai, A., Forcales, S. V., et al. (2010) · Cell Stem Cell · doi:10.1016/j.stem.2010.08.013 · Cited by 392
Targeted Disruption of Mouse Yin Yang 1 Transcription Factor Results in Peri-Implantation Lethality
Donohoe, M. E., Zhang, X., McGinnis, L. K., Biggers, J. D., Li, E., & Shi, Y. (1999) · Molecular and Cellular Biology · doi:10.1128/mcb.19.10.7237 · Cited by 375
Park, K., & Atchison, M. L. (1991) · Proceedings of the National Academy of Sciences · doi:10.1073/pnas.88.21.9804 · Cited by 363
A Region of the Human HOXD Cluster that Confers Polycomb-Group Responsiveness
Woo, C. J., Kharchenko, P. V., Daheron, L. M., Park, P. J., & Kingston, R. E. (2010) · Cell · doi:10.1016/j.cell.2009.12.022 · Cited by 333
Enhancer biology and enhanceropathies
Smith, E. R., & Shilatifard, A. (2014) · Nature Structural & Molecular Biology · doi:10.1038/nsmb.2784 · Cited by 326
Severe Expressive-Language Delay Related to Duplication of the Williams–Beuren Locus
Somerville, M. J., Mervis, C. Β., Young, E. J., Seo, E., Campo, M. D., Bamforth, S., Peregrine, E., Loo, W., Lilley, M., Jurado, L. A. P., et al. (2005) · New England Journal of Medicine · doi:10.1056/nejmoa051962 · Cited by 313
Lee, J. S., Galvin, K. M., See, R. H., Eckner, R., Livingston, D. M., Moran, E. M., & Shi, Y. (1995) · Genes & Development · doi:10.1101/gad.9.10.1188 · Cited by 311
Hariharan, N., Kelley, D. E., & Perry, R. P. (1991) · Proceedings of the National Academy of Sciences · doi:10.1073/pnas.88.21.9799 · Cited by 306
Truncating mutations in NRXN2 and NRXN1 in autism spectrum disorders and schizophrenia
Gauthier, J., Siddiqui, T. J., Huashan, P., Yokomaku, D., Hamdan, F. F., Champagne, N., Lapointe, M., Spiegelman, D., Noreau, A., Lafrenière, R. G., et al. (2011) · Human Genetics · doi:10.1007/s00439-011-0975-z · Cited by 286
Blecher‐Gonen, R., Barnett‐Itzhaki, Z., Jaitin, D. A., Amann‐Zalcenstein, D., Lara‐Astiaso, D., & Amit, I. (2013) · Nature Protocols · doi:10.1038/nprot.2013.023 · Cited by 281
Mutations in the chromatin modifier gene KANSL1 cause the 17q21.31 microdeletion syndrome
Koolen, D. A., Kramer, J. M., Neveling, K., Nillesen, W. M., Moore-Barton, H. L., Elmslie, F. V., Toutain, A., Amiel, J., Malan, V., Tsai, A. C.-H., et al. (2012) · Nature Genetics · doi:10.1038/ng.2262 · Cited by 232
The Histone H3 Lysine 27-Specific Demethylase Jmjd3 Is Required for Neural Commitment
Burgold, T., Spreafico, F., Santa, F. D., Totaro, M. G., Prosperini, E., Natoli, G., & Testa, G. (2008) · PLoS ONE · doi:10.1371/journal.pone.0003034 · Cited by 216
A YY1–INO80 complex regulates genomic stability through homologous recombination–based repair
Wu, S., Shi, Y. G., Mulligan, P., Gay, F., Landry, J. W., Liu, H., Lu, J., Qi, H. H., Wang, W., Nickoloff, J. A., et al. (2007) · Nature Structural & Molecular Biology · doi:10.1038/nsmb1332 · Cited by 208
Bainbridge, M. N., Wang, M., Wu, Y., Newsham, I., Muzny, D. M., Jefferies, J. L., Albert, T. J., Burgess, D. L., & Gibbs, R. A. (2011) · Genome biology · doi:10.1186/gb-2011-12-7-r68 · Cited by 208
A recurrent mutation in MED12 leading to R961W causes Opitz-Kaveggia syndrome
Risheg, H., Graham, J. M., Clark, R. D., Rogers, R. C., Opitz, J. M., Moeschler, J. B., Peiffer, A., May, M. M., Joseph, S., Jones, J. R., et al. (2007) · Nature Genetics · doi:10.1038/ng1992 · Cited by 199
Cocrystal structure of YY1 bound to the adeno-associated virus P5 initiator
Houbaviy, H. B., Usheva, A., Shenk, T. E., & Burley, S. K. (1996) · Proceedings of the National Academy of Sciences · doi:10.1073/pnas.93.24.13577 · Cited by 193
YY1 functions with INO80 to activate transcription
Cai, Y., Jin, J., Yao, T., Gottschalk, A. J., Swanson, S. K., Wu, S., Shi, Y., Washburn, M. P., Florens, L. A., Conaway, R. C., et al. (2007) · Nature Structural & Molecular Biology · doi:10.1038/nsmb1276 · Cited by 189
Affar, E. B., Gay, F., Shi, Y. G., Liu, H., Huarte, M., Wu, S., Li, E., Li, E., & Shi, Y. (2006) · Molecular and Cellular Biology · doi:10.1128/mcb.26.9.3565-3581.2006 · Cited by 188
Mutations in the DLG3 Gene Cause Nonsyndromic X-Linked Mental Retardation
Tarpey, P., Parnau, J., Blow, M., Woffendin, H., Bignell, G., Cox, C., Cox, J., Davies, H., Edkins, S., Holden, S., et al. (2004) · The American Journal of Human Genetics · doi:10.1086/422703 · Cited by 176
Satijn, D. P. E., Hamer, K. M., den Blaauwen, J. L., & Otte, A. P. (2001) · Molecular and Cellular Biology · doi:10.1128/mcb.21.4.1360-1369.2001 · Cited by 174
Mutations in KANSL1 cause the 17q21.31 microdeletion syndrome phenotype
Zollino, M., Orteschi, D., Murdolo, M., Lattante, S., Battaglia, D., Stefanini, C., Mercuri, E. M., Chiurazzi, P., Neri, G., & Marangi, G. (2012) · Nature Genetics · doi:10.1038/ng.2257 · Cited by 158
Park, D. H., Hong, S. J., Salinas, R. D., Liu, S. J., Sun, S. W., Sgualdino, J., Testa, G., Matzuk, M. M., Iwamori, N., & Lim, D. A. (2014) · Cell Reports · doi:10.1016/j.celrep.2014.07.060 · Cited by 139
The neurobeachin gene is disrupted by a translocation in a patient with idiopathic autism
Castermans, D., Wilquet, V., Parthoens, E., Huysmans, C., Steyaert, J. G., Swinnen, L., Fryns, J.-P., de Ven, W. V., & Devriendt, K. (2003) · Journal of Medical Genetics · doi:10.1136/jmg.40.5.352 · Cited by 139
Medvedovic, J., Ebert, A., Tagoh, H., Tamir, I., Schwickert, T. A., Novatchkova, M., Sun, Q., Veld, P. J. H. I. ’., Guo, C., Yoon, H. S., et al. (2013) · Immunity · doi:10.1016/j.immuni.2013.08.011 · Cited by 136
The Yin and Yang of YY1 in the nervous system
He, Y., & Casaccia‐Bonnefil, P. (2008) · Journal of Neurochemistry · doi:10.1111/j.1471-4159.2008.05486.x · Cited by 132
Adamo, A., Atashpaz, S., Germain, P.-L., Zanella, M., D'Agostino, G., Albertin, V., Chenoweth, J., Micale, L., Fusco, C., Unger, C., et al. (2015) · Nature Genetics · doi:10.1038/ng.3169 · Cited by 129
Yy1 as a molecular link between neuregulin and transcriptional modulation of peripheral myelination
He, Y., Kim, J. Y., Dupree, J. L., Tewari, A., Melendez‐Vasquez, C. V., Svaren, J. P., & Casaccia, P. (2010) · Nature Neuroscience · doi:10.1038/nn.2686 · Cited by 125
A Noncoding, Regulatory Mutation Implicates HCFC1 in Nonsyndromic Intellectual Disability
Huang, L., Jolly, L. A., Willis‐Owen, S. A. G., Gardner, A. E., Kumar, R., Douglas, E., Shoubridge, C., Wieczorek, D., Tzschach, A., Cohen, M. Y., et al. (2012) · The American Journal of Human Genetics · doi:10.1016/j.ajhg.2012.08.011 · Cited by 105
Kagami, M., Kurosawa, K., Miyazaki, O., Ishino, F., Matsuoka, K., & Ogata, T. (2015) · European Journal of Human Genetics · doi:10.1038/ejhg.2015.13 · Cited by 104
Yin Yang 1 extends the Myc-related transcription factors network in embryonic stem cells
Vella, P., Barozzi, I., Cuomo, A., Bonaldi, T., & Pasini, D. (2011) · Nucleic Acids Research · doi:10.1093/nar/gkr1290 · Cited by 103
Burgold, T., Voituron, N., Cagánová, M., Tripathi, P. P., Menuet, C., Tusi, B. K., Spreafico, F., Bévengut, M., Gestreau, C., Buontempo, S., et al. (2012) · Cell Reports · doi:10.1016/j.celrep.2012.09.013 · Cited by 100
Mutations in MED12 Cause X-Linked Ohdo Syndrome
Silfhout, A. T. V., Vries, B. B. A. D., van Bon, B. W. M., Hoischen, A., Ruiterkamp‐Versteeg, M., Gilissen, C., Gao, F., van Zwam, M., Harteveld, C. L., van Essen, A. J., et al. (2013) · The American Journal of Human Genetics · doi:10.1016/j.ajhg.2013.01.007 · Cited by 99
Mutations in ZBTB20 cause Primrose syndrome
Cordeddu, V., Redeker, B., Stellacci, E., Jongejan, A., Fragale, A., Bradley, T., Anselmi, M., Ciolfi, A., Cecchetti, S., Muto, V., et al. (2014) · Nature Genetics · doi:10.1038/ng.3035 · Cited by 97
Deletion of α-neurexin II results in autism-related behaviors in mice
Dachtler, J., Glasper, J., Cohen, R. N., Ivorra, J. L., Swiffen, D. J., Jackson, A. J., Harte, M. K., Rodgers, R. J., & Clapcote, S. J. (2014) · Translational Psychiatry · doi:10.1038/tp.2014.123 · Cited by 84
Born, G., Grayton, H. M., Langhorst, H., Dudanova, I., Rohlmann, A., Woodward, B. W., Collier, D. A., Fernandes, C., & Missler, M. (2015) · Frontiers in Synaptic Neuroscience · doi:10.3389/fnsyn.2015.00003 · Cited by 79
Guo, D., Duan, X.-Y., Regalado, E. S., Mellor-Crummey, L., Kwartler, C. S., Kim, D., Lieberman, K. V., Vries, B. B. A. D., Pfundt, R., Schinzel, A., et al. (2016) · The American Journal of Human Genetics · doi:10.1016/j.ajhg.2016.11.008 · Cited by 79
Jolly, L. A., Nguyen, L. S., Domingo, D., Sun, Y., Barry, S. C., Hančárová, M., Plevová, P., Vlčková, M., Havlovičová, M., Kalscheuer, V. M., et al. (2015) · Human Molecular Genetics · doi:10.1093/hmg/ddv083 · Cited by 65
Germain, P., Vitriolo, A., Adamo, A., Laise, P., Das, V., & Testa, G. (2016) · Nucleic Acids Research · doi:10.1093/nar/gkw448 · Cited by 43
A structural hierarchy mediated by multiple nuclear factors establishes IgH locus conformationPreprint
Gerasimova, T. I., Guo, C., Ghosh, A., Qiu, X., Montefiori, L. E., Verma‐Gaur, J., Choi, N. M., Feeney, A. J., & Sen, R. (2015) · Genes & Development · doi:10.1101/gad.263871.115 · Cited by 34
The time of timing: How Polycomb proteins regulate neurogenesis
Testa, G. (2011) · BioEssays · doi:10.1002/bies.201100021 · Cited by 28
Jabbi, M., Chen, Q., Turner, N., Kohn, P. D., White, M. G., Kippenhan, J. S., Dickinson, D., Kolachana, B. S., Mattay, V. S., Weinberger, D. R., et al. (2015) · Translational Psychiatry · doi:10.1038/tp.2015.98 · Cited by 28
Severi, G., Bernardini, L., Briuglia, S., Bigoni, S., Buldrini, B., Magini, P., Dentici, M. L., Cordelli, D. M., Arrigo, T., Franzonı, E., et al. (2015) · American Journal of Medical Genetics Part A · doi:10.1002/ajmg.a.37346 · Cited by 22
Cited by
Sorted by citations
YY1 Is a Structural Regulator of Enhancer-Promoter Loops
Weintraub, A. S., Li, C. H., Zamudio, A. V., Sigova, A. A., Hannett, N. M., Day, D. S., Abraham, B. J., Cohen, M. A., Nabet, B., Buckley, D. L., et al. (2017) · Cell · doi:10.1016/j.cell.2017.11.008 · Cited by 992
Cheroni, C., Caporale, N., & Testa, G. (2020) · Molecular Autism · doi:10.1186/s13229-020-00370-1 · Cited by 290
The Why of YY1: Mechanisms of Transcriptional Regulation by Yin Yang 1
Verheul, T. C. J., van Hijfte, L., Perenthaler, E., & Barakat, T. S. (2020) · Frontiers in Cell and Developmental Biology · doi:10.3389/fcell.2020.592164 · Cited by 204
The Two Sides of YY1 in Cancer: A Friend and a Foe
Sarvagalla, S., Kolapalli, S. P., & Vallabhapurapu, S. (2019) · Frontiers in Oncology · doi:10.3389/fonc.2019.01230 · Cited by 174
YY1 regulates cancer cell immune resistance by modulating PD-L1 expression
Hays, E., & Bonavida, B. (2019) · Drug Resistance Updates · doi:10.1016/j.drup.2019.04.001 · Cited by 145
Metadata
- Authors
- Gabriele, M., Vulto-van Silfhout, A. T., Germain, P.-L., Vitriolo, A., Kumar, R., Douglas, E., Haan, E., Kosaki, K., Takenouchi, T., Rauch, A., Steindl, K., Frengen, E., Misceo, D., Pedurupillay, C. R. J., Stromme, P., Rosenfeld, J. A., Shao, Y., Craigen, W. J., Schaaf, C. P., Rodriguez-Buritica, D., Farach, L., Friedman, J., Thulin, P., McLean, S. D., Nugent, K. M., Morton, J., Nicholl, J., Andrieux, J., Stray-Pedersen, A., Chambon, P., Patrier, S., Lynch, S. A., Kjaergaard, S., Tørring, P. M., Brasch-Andersen, C., Ronan, A., van Haeringen, A., Anderson, P. J., Powis, Z., Brunner, H. G., Pfundt, R., Schuurs-Hoeijmakers, J. H. M., van Bon, B. W. M., Lelieveld, S., Gilissen, C., Nillesen, W. M., Vissers, L. E. L. M., Gecz, J., Koolen, D. A., Testa, G., & de Vries, B. B. A.
- Affiliations
- European Institute of Oncology (IT)
- The University of Adelaide (AU)
- South Australia Pathology (AU)
- Keio University (JP)
- University of Zurich (CH)
- Oslo University Hospital (NO)
- Baylor College of Medicine (US)
- The University of Texas Health Science Center at Houston (US)
- University of California San Diego (US)
- University of Utah (US)
- Children's Hospital of San Antonio (US)
- Birmingham Women's Hospital (GB)
- Hôpital Jeanne de Flandre (FR)
- Centre Hospitalier Universitaire de Rouen (FR)
- Children's Health Ireland at Crumlin (IE)
- Odense University Hospital (DK)
- Hunter Genetics (AU)
- Women's and Children's Hospital (AU)
- Ambry Genetics (United States) (US)
- Radboud University Medical Center (NL)
- University of Milan (IT)
- Corresponding author
- Testa, Giuseppe
- ORCID
- Gabriele, Michele
- Germain, Pierre-Luc
- Vitriolo, Alessandro
- Kumar, Raman
- Haan, Eric
- Kosaki, Kenjiro
- Takenouchi, Toshiki
- Rauch, Anita
- Steindl, Katharina
- Frengen, Eirik
- Misceo, Doriana
- Rosenfeld, Jill A.
- Schaaf, Christian P.
- Farach, Laura
- Friedman, Jennifer
- McLean, Scott D.
- Nugent, Kimberly M.
- Chambon, Pascal
- Lynch, Sally A.
- Tørring, Pernille M.
- Ronan, Anne
- Anderson, Peter J.
- Powis, Zöe
- Brunner, Han G.
- Pfundt, Rolph
- Schuurs-Hoeijmakers, Janneke H.M.
- Lelieveld, Stefan
- Gilissen, Christian
- Vissers, Lisenka E.L.M.
- Koolen, David A.
- Testa, Giuseppe
- Venue
- The American Journal of Human Genetics
- Publisher
- Elsevier BV
- Published
- 2017-06
- Volume
- 100
- Issue
- 6
- Pages
- 907-925
- ISSN
- 0002-9297 (ISSN-L)
- PMC
- PMC5473733
- OpenAlex
- W2620797288
- Cited by
- 163
- References
- 84
- Citations by year
- 2026: 14 · 2025: 16 · 2024: 18 · 2023: 15 · 2022: 17 · 2021: 28 · 2020: 17 · 2019: 21 · 2018: 11 · 2017: 4
- FWCI
- 9.60
- Type
- journal article
- Language
- en
- Open access
- hybrid
- doi.org
- Licence
- Locations
- The American Journal of Human Genetics (publishedVersion, cc-by-nc-nd)
- Europe PMC (PubMed Central) (publishedVersion, cc-by-nc-nd)
- PubMed Central (publishedVersion, cc-by-nc-nd)
- PubMed (publishedVersion)
- Research Publications (Maastricht University) (publishedVersion, cc-by-nc-nd)
- Zurich Open Repository and Archive (University of Zurich) (acceptedVersion, cc-by-nc-nd)
- Leiden Repository (Leiden University) (submittedVersion)
- University of Southern Denmark Research Portal (University of Southern Denmark) (submittedVersion, cc-by-nc-nd)
- Data Archiving and Networked Services (DANS) (submittedVersion, other-oa)
- Archivio Istituzionale della Ricerca (Universita Degli Studi Di Milano) (submittedVersion, other-oa)
- Adelaide Research & Scholarship (AR&S) (University of Adelaide) (submittedVersion, cc-by-nc-nd)
- Minerva Access (University of Melbourne) (submittedVersion, cc-by-nc-nd)
- Radboud Repository (Radboud University) (submittedVersion)
- NORA - Norwegian Open Research Archives (submittedVersion, cc-by-nc-nd)
- Zurich Open Repository and Archive (University of Zurich) (submittedVersion, cc-by-nc-nd)
- Radboud Repository (Radboud University) (submittedVersion, other-oa)
- Research Publications (Maastricht University) (submittedVersion, other-oa)
- Zurich Open Repository and Archive (University of Zurich)
- Funders
- European Commission (241995)
- European Research Council (DISEASEAVATARS 616441)
- Telethon Foundation (GGP13231B, GGP14265)
- Associazione Italiana per la Ricerca sul Cancro
- Regione Lombardia (Ricerca Indipendente 2012)
- Umberto Veronesi Foundation
- Italian Ministry of Health (ERANET-Neuron grant, Ricerca Corrente grant)
- Japan Agency for Medical Research and Development
- Australian National Health and Medical Research Council (1091593)
- Dutch Organization for Health Research and Development (917-86-319, 912-12-109)
- Topics
- Life Sciences › Biochemistry, Genetics and Molecular Biology › Genetics › Genetics and Neurodevelopmental Disorders
- Life Sciences › Biochemistry, Genetics and Molecular Biology › Genetics › Genomics and Rare Diseases
- Life Sciences › Biochemistry, Genetics and Molecular Biology › Molecular Biology › Genomics and Chromatin Dynamics
- Keywords
- YY1, haploinsufficiency, intellectual disability, de novo mutations, zinc finger transcription factor, chromatin binding, enhancer regulation, H3K27 acetylation, transcriptional dysregulation, fetal growth restriction, congenital malformations, behavioral alterations
- MeSH terms
- Protein Domains, Acetylation, Adolescent, Base Sequence, Child, Preschool, Chromatin, Enhancer Elements, Genetic, Female, Haplotypes, Histones, Humans, Lymphocytes, Male, Intellectual Disability, Methylation, Models, Molecular, Protein Binding, Transcription, Genetic, Cohort Studies, Mutation, Missense, Chromatin Immunoprecipitation, YY1 Transcription Factor, Haploinsufficiency, Hemizygote, Gene Ontology
About these checks
Registry, retraction, Cites and statistics results are computed, not judged, with one exception: a printed reference that no index lists is read once by a model before it counts as a citation error. Claims are extracted by a model and kept only when their quote appears verbatim in the text; each cited source is then checked, with a model’s help, for whether it says what the claim relies on. Those verdicts can be wrong — read the claim’s quote and the cited source before relying on one.
Statistics and arithmetic are recomputed, not judged.
Confidence bands are shown only for fields calibrated on our annotated test set. None is calibrated yet, so no band is shown.
What counts as a claim ›How we measure confidence ›How we check this ›
Are you an author, or do you see a problem with this page? Request a review
