

The DOI matches its Crossref record; 31 of the 31 references it cites were found in a registry or an index.
Metabolic responses of eukaryotic microalgae to environmental stress limit the ability of FT-IR spectroscopy for species identification
Open accessAbstract
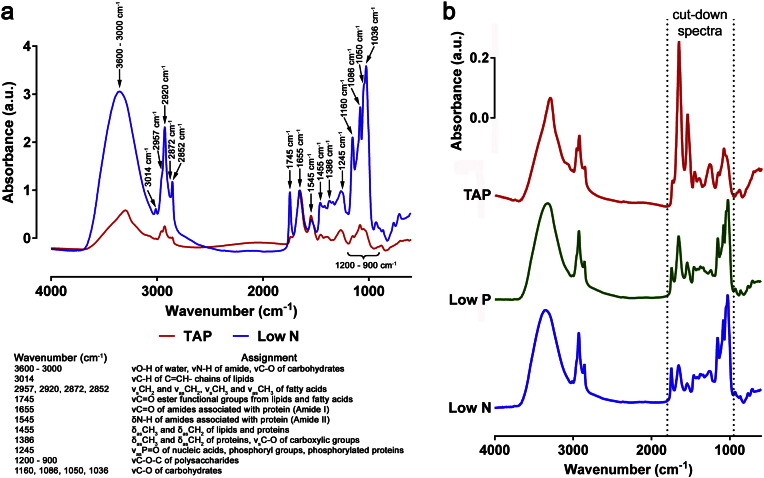
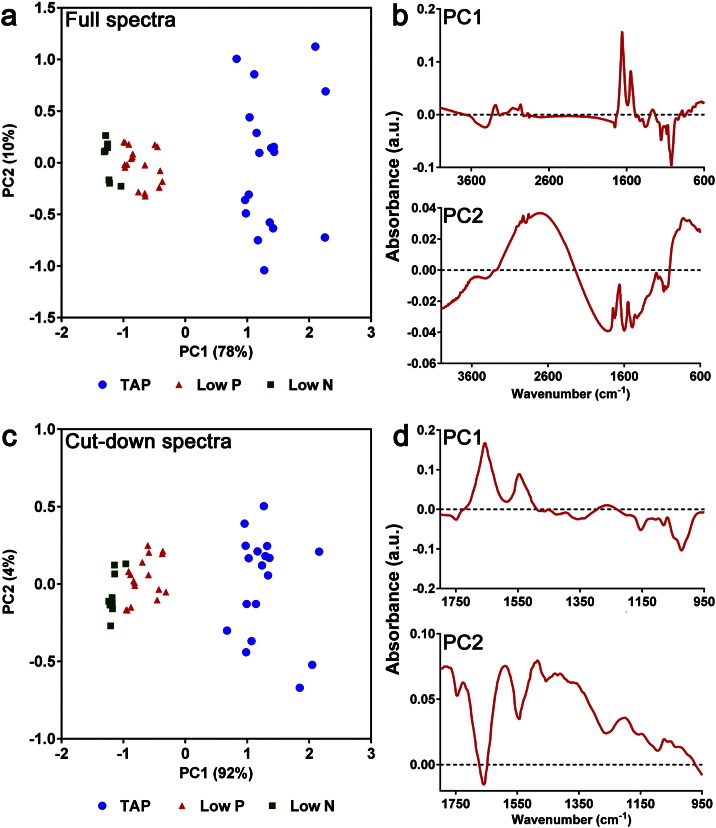
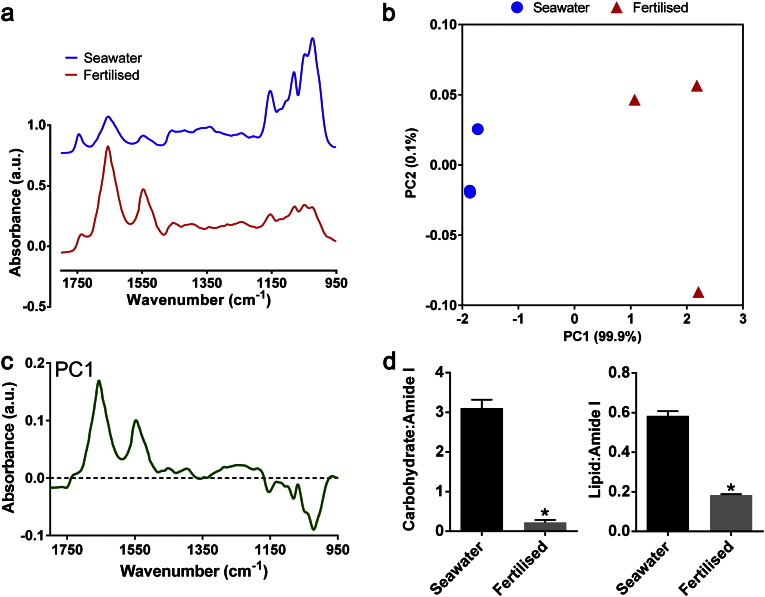
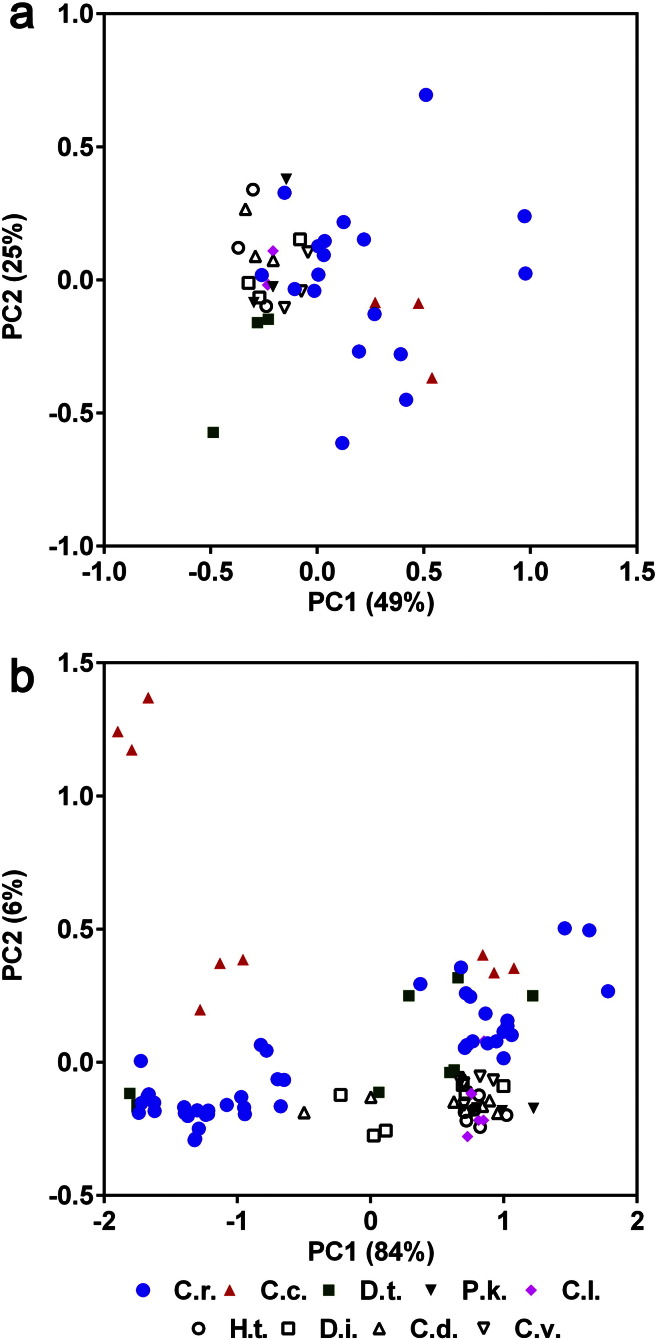
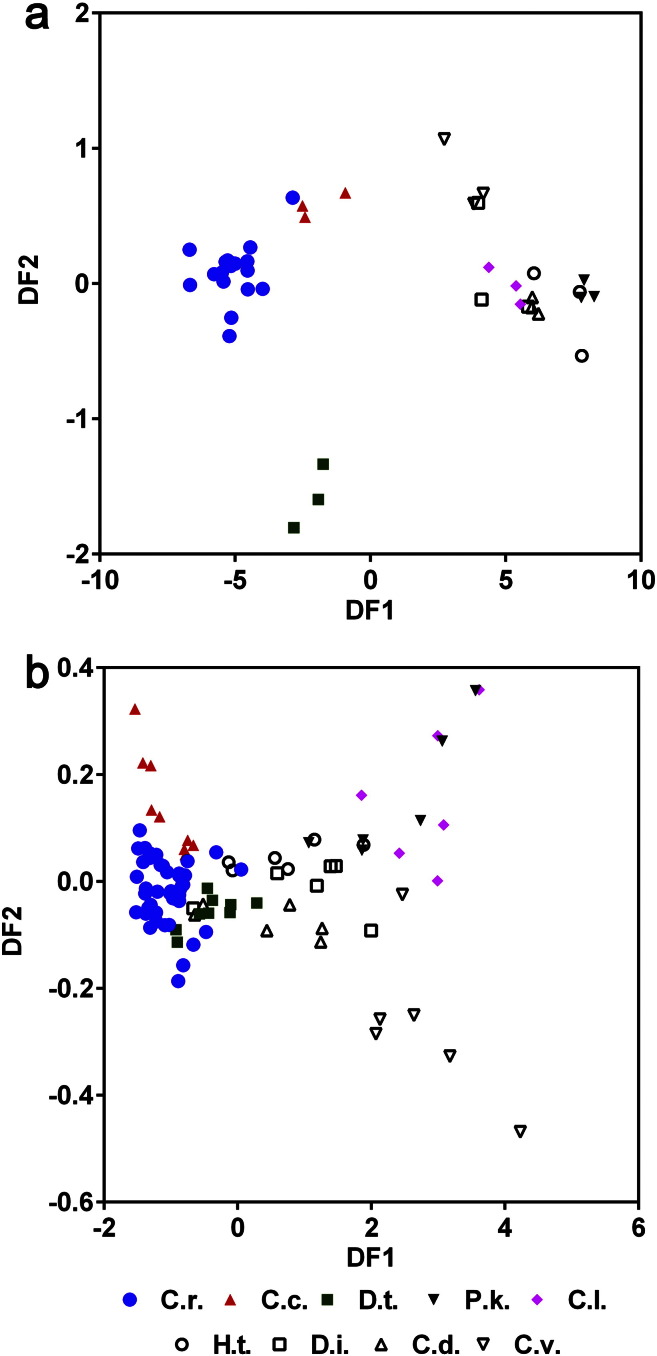
Fourier Transform Infrared (FT-IR) spectroscopy is a robust method for macromolecular analysis and differentiation of microorganisms. However, most studies are performed in controlled conditions and it is unclear whether this tool is appropriate for the identification of eukaryotic microalgae species from variable environments. In order to address this, nine closely-related species of marine and freshwater microalgae were grown under controlled (non-stressed) and variable (non-stressed and stressed) conditions, including nutrient-stressed and wastewater-stressed conditions. Following optimization of data processing methods, FT-IR spectra from all species and conditions were compared. The substantial metabolic changes that were caused by nutrient starvation restricted the ability of FT-IR spectroscopy to differentiate the microalgal species grown under variable conditions efficiently. Comparison of unsupervised and supervised multivariate data analysis methods found that principal component-discriminant function analysis was able best to differentiate between some species under controlled conditions but still gave poor differentiation under variable environmental conditions.
Overview
The claims and statistics of this paper haven’t been checked yet.
Run the check — free, no account needed. It reads the open-access text and checks the sources it cites.
Integrity signals
Registry
Cites
Statistics
Figures
Verification
Claims the paper makes
The claims and statistics of this paper haven’t been checked yet.
Run the check — free, no account needed. It reads the open-access text and checks the sources it cites.
Claims other papers make about this one
Each is checked against this paper’s own text: does it say what the citing paper says it does?
In the citing paper
“Although nutritional scarcity has caused metabolic changes in microalgae, such as the accumulation of carbohydrates and lipids, not all species have responded to nutrient scarcity by accumulating carbohydrates or lipids [6,13,14].”
From Response to nutrient variation on lipid productivity in green microalgae captured using second derivative FTIR and Raman spectroscopy (2022) · cites this paper as [14]
In the citing paper
“This indicates that as nutrients are depleted, the amount of proteins in microalgae cells reduces, which alters the cell metabolism to accumulate more carbohydrates (1200-1000 cm -1 ) and lipids in the form of TAGs (~1740 cm -1 )[11,14,31].”
From Response to nutrient variation on lipid productivity in green microalgae captured using second derivative FTIR and Raman spectroscopy (2022) · cites this paper as [14]
Self-check
Percentages, sums and reported differences re-computed from the paper’s own numbers.
The self-check needs the paper’s full text.
Citations
Cites
Chisti, Y. (2007) · Biotechnology Advances · doi:10.1016/j.biotechadv.2007.02.001 · Cited by 9,524
Microalgal triacylglycerols as feedstocks for biofuel production: perspectives and advances
Hu, Q., Sommerfeld, M., Jarvis, E., Ghirardi, M., Posewitz, M., Seibert, M., & Darzins, A. (2008) · The Plant Journal · doi:10.1111/j.1365-313x.2008.03492.x · Cited by 3,745
(1989) · Elsevier eBooks · doi:10.1016/c2009-0-02778-0 · Cited by 1,172
The development of artificial media for marine algae
Provasoli, L., McLaughlin, J. J. A., & Droop, M. R. (1957) · Archives of Microbiology · doi:10.1007/bf00446694 · Cited by 969
Siaut, M., Cuiné, S., Cagnon, C., Fessler, B., Nguyen, H. M., Carrier, P., Beyly, A., Beisson, F., Triantaphylidès, C., Li‐Beisson, Y., et al. (2011) · BMC Biotechnology · doi:10.1186/1472-6750-11-7 · Cited by 754
Dean, A. P., Sigee, D. C., Estrada, B., & Pittman, J. K. (2010) · Bioresource Technology · doi:10.1016/j.biortech.2010.01.065 · Cited by 523
Self-citationMartens, H., & Stark, E. (1991) · Journal of Pharmaceutical and Biomedical Analysis · doi:10.1016/0731-7085(91)80188-f · Cited by 515
Mariey, L., Signolle, J. P., Amiel, C., & Travert, J. (2001) · Vibrational Spectroscopy · doi:10.1016/s0924-2031(01)00113-8 · Cited by 348
Stehfest, K., Toepel, J., & Wilhelm, C. (2005) · Plant Physiology and Biochemistry · doi:10.1016/j.plaphy.2005.07.001 · Cited by 316
Kansiz, M., Heraud, P., Wood, B., Burden, F., Beardall, J., & McNaughton, D. (1999) · Phytochemistry · doi:10.1016/s0031-9422(99)00212-5 · Cited by 238
Fischer, G., Braun, S., Thißen, R., & Dott, W. (2005) · Journal of Microbiological Methods · doi:10.1016/j.mimet.2005.04.005 · Cited by 194
Timmins, É. M., Howell, S. A., Alsberg, B. K., Noble, W. C., & Goodacre, R. (1998) · Journal of Clinical Microbiology · doi:10.1128/jcm.36.2.367-374.1998 · Cited by 191
Self-citationIdentification of microorganisms by FTIR spectroscopy: perspectives and limitations of the method
Wenning, M., & Scherer, S. (2013) · Applied Microbiology and Biotechnology · doi:10.1007/s00253-013-5087-3 · Cited by 183
Goodacre, R., Timmins, É. M., Rooney, P. J., Rowland, J. J., & Kell, D. B. (1996) · FEMS Microbiology Letters · doi:10.1111/j.1574-6968.1996.tb08342.x · Cited by 177
Self-citationGoodacre, R., & Kell, D. B. (2017) · FEMS Microbiology Letters · doi:10.1093/femsle/fnx018 · Cited by 163
Self-citationOsundeko, O., Dean, A. P., Davies, H. S., & Pittman, J. K. (2014) · Plant and Cell Physiology · doi:10.1093/pcp/pcu113 · Cited by 133
Self-citationOberreuter, H., Seiler, H., & Scherer, S. (2002) · INTERNATIONAL JOURNAL OF SYSTEMATIC AND EVOLUTIONARY MICROBIOLOGY · doi:10.1099/00207713-52-1-91 · Cited by 132
Rebuffo-Scheer, C. A., Schmitt, J., Wenning, M., von Stetten, F., & Scherer, S. (2006) · Applied and Environmental Microbiology · doi:10.1128/aem.72.2.994-1000.2006 · Cited by 119
Dean, A. P., Nicholson, J. M., & Sigee, D. C. (2008) · European Journal of Phycology · doi:10.1080/09670260801979287 · Cited by 81
Self-citationDomenighini, A., & Giordano, M. (2009) · Journal of Phycology · doi:10.1111/j.1529-8817.2009.00662.x · Cited by 78
Liu, J., Mukherjee, J., Hawkes, J. J., & Wilkinson, S. J. (2013) · Journal of Chemical Technology & Biotechnology · doi:10.1002/jctb.4027 · Cited by 77
Sigee, D. C., Bahrami, F., Estrada, B., Webster, R. E., & Dean, A. P. (2007) · Phycologia · doi:10.2216/07-14.1 · Cited by 64
Self-citationDean, A. P., Martin, M. C., & Sigee, D. C. (2007) · Phycologia · doi:10.2216/06-27.1 · Cited by 58
Self-citationPotential of Bioenergy Production from Microalgae
Driver, T., Bajhaiya, A. K., & Pittman, J. K. (2014) · Current Sustainable/Renewable Energy Reports · doi:10.1007/s40518-014-0011-8 · Cited by 48
Self-citationThe rapid identification of Acinetobacter species using Fourier transform infrared spectroscopy
Winder, C. L., Carr, E. L., Goodacre, R., & Seviour, R. J. (2004) · Journal of Applied Microbiology · doi:10.1046/j.1365-2672.2003.02154.x · Cited by 47
Self-citationPatel, S. A., Currie, F., Thakker, N., & Goodacre, R. (2008) · The Analyst · doi:10.1039/b809441a · Cited by 35
Self-citationGiordano, M., Ratti, S., Domenighini, A., & Vogt, F. (2009) · Plant Ecology & Diversity · doi:10.1080/17550870903353088 · Cited by 29
Changing patterns of carbon allocation in lake phytoplankton: an FTIR analysis
Dean, A. P., Nicholson, J. M., & Sigee, D. C. (2011) · Hydrobiologia · doi:10.1007/s10750-011-0973-0 · Cited by 15
Self-citationBounphanmy, S., Thammathaworn, S., Thanee, N., Pirapathrungsuriya, K., Beardall, J., McNaughton, D., & Heraud, P. (2010) · Journal of Biophotonics · doi:10.1002/jbio.201000017 · Cited by 15
Dean, A. P., Pittman, J. K., & Sigee, D. C. (2014) · Research Explorer (The University of Manchester) · Cited by 1
Self-citation
Cited by
Sorted by citations
Impact of torrefaction on the composition, structure and reactivity of a microalga residue
Chen, Y.-C., Chen, W., Lin, B.-J., Chang, J., & Ong, H. C. (2016) · Applied Energy · doi:10.1016/j.apenergy.2016.07.130 · Cited by 190
Wet torrefaction of microalga Chlorella vulgaris ESP-31 with microwave-assisted heating
Bach, Q., Chen, W., Lin, S.-C., Sheen, H.-K., & Chang, J. (2016) · Energy Conversion and Management · doi:10.1016/j.enconman.2016.07.035 · Cited by 149
Chen, C. C., Zhu, X., Xu, H., Chen, F., Ma, J., & Pan, K. (2021) · Environmental Science & Technology · doi:10.1021/acs.est.1c04278 · Cited by 142
Khoo, C. G., Lam, M. K., Mohamed, A. R., & Lee, K. T. (2020) · Environmental Research · doi:10.1016/j.envres.2020.109828 · Cited by 130
Castro, J. D. S., Assemany, P. P., Carneiro, A. D. C. O., Ferreira, J., de Jesus, M. M., Rodrigues, F. D. Á., & Calijuri, M. L. (2021) · The Science of The Total Environment · doi:10.1016/j.scitotenv.2020.144480 · Cited by 111
Metadata
- Authors
- Driver, T., Bajhaiya, A. K., Allwood, J. W., Goodacre, R., Pittman, J. K., & Dean, A. P.
- Affiliations
- University of Manchester (GB)
- James Hutton Institute (GB)
- Corresponding author
- Pittman, Jon K.
- Dean, Andrew P.
- Venue
- Algal Research
- Publisher
- Elsevier BV
- Published
- 2015-09
- Volume
- 11
- Pages
- 148-155
- ISSN
- 2211-9264 (ISSN-L)
- PMC
- PMC4694091
- OpenAlex
- W1766987757
- Cited by
- 107
- References
- 31
- Citations by year
- 2026: 10 · 2025: 3 · 2024: 14 · 2023: 6 · 2022: 9 · 2021: 13 · 2020: 23 · 2019: 9 · 2018: 10 · 2017: 3 · 2016: 6 · 2015: 1
- FWCI
- 4.03
- Type
- journal article
- Language
- en
- Open access
- hybrid
- doi.org
- Locations
- Algal Research (publishedVersion, cc-by)
- PubMed Central (publishedVersion, cc-by)
- PubMed (publishedVersion)
- Research Explorer (The University of Manchester) (publishedVersion)
- Funders
- Carbon Trust (082)
- Topics
- Life Sciences › Biochemistry, Genetics and Molecular Biology › Biophysics › Spectroscopy Techniques in Biomedical and Chemical Research
- Physical Sciences › Chemistry › Analytical Chemistry › Spectroscopy and Chemometric Analyses
- Physical Sciences › Energy › Renewable Energy, Sustainability and the Environment › Algal biology and biofuel production
- Keywords
- eukaryotic microalgae, species identification, FTIR spectroscopy, environmental stress, nutrient deprivation, metabolic response, multivariate analysis, marine microalgae, freshwater microalgae
About these checks
Registry, retraction, Cites and statistics results are computed, not judged, with one exception: a printed reference that no index lists is read once by a model before it counts as a citation error. Claims are extracted by a model and kept only when their quote appears verbatim in the text; each cited source is then checked, with a model’s help, for whether it says what the claim relies on. Those verdicts can be wrong — read the claim’s quote and the cited source before relying on one.
Statistics and arithmetic are recomputed, not judged.
Confidence bands are shown only for fields calibrated on our annotated test set. None is calibrated yet, so no band is shown.
What counts as a claim ›How we measure confidence ›How we check this ›
Are you an author, or do you see a problem with this page? Request a review
