

The DOI matches its Crossref record; 56 of the 57 references it cites were found in a registry or an index.
Usage impact on data center electricity needs: A system dynamic forecasting model
Open accessAbstract
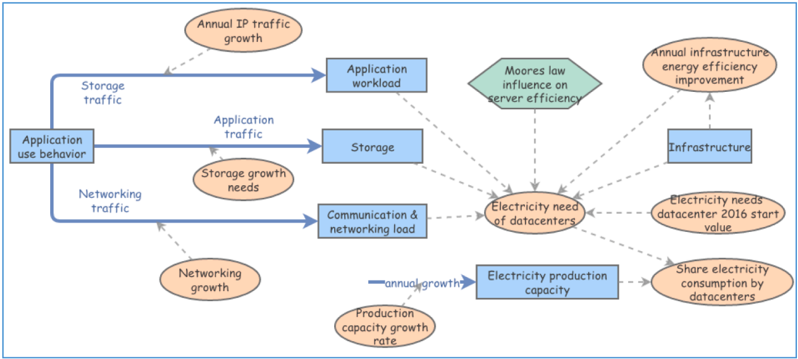
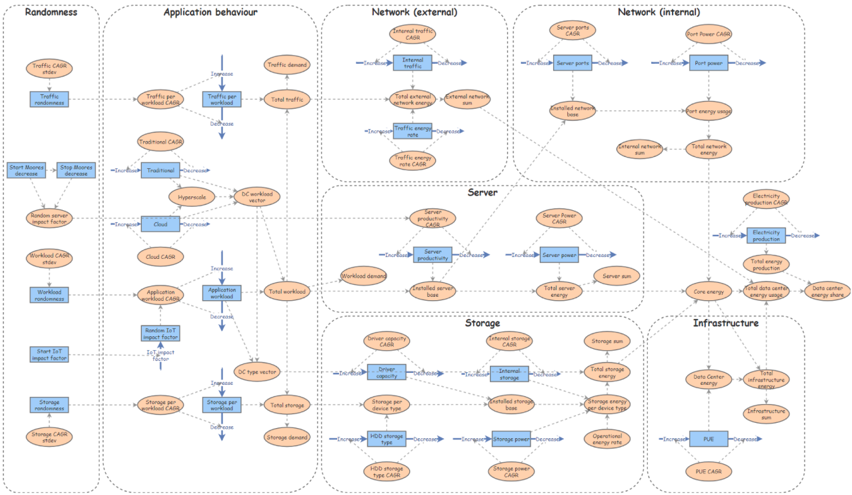
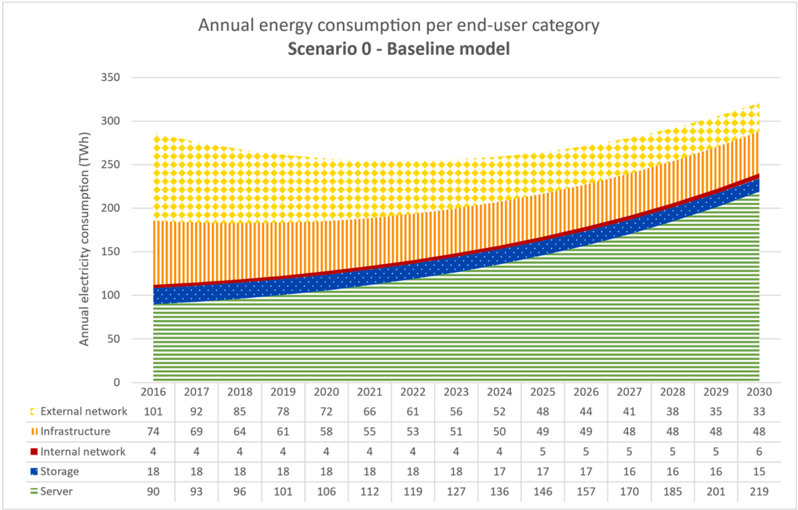
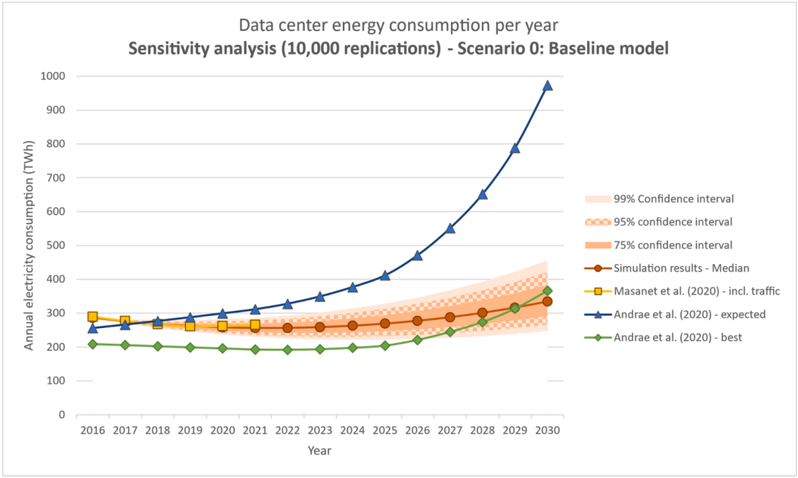
This article presents a forecasting model of data center electricity needs based on understanding usage growth and we conclude that this growth is not fully compensated by efficiency gains of data center technological innovations. We predict a combined growth of data center electricity needs of 286 TWh in 2016 until about 321 TWh in 2030, if all currently known growth factors remain the same. We next run simulations for the end of Moore’s law and the growth of industrial Internet of Things (IoT). The end of Moore’s law results in about 658 TWh for 2030 and an increase of the share of global data center electricity consumption from about 1.15% in 2016 to 1.86% in 2030. A rise of the Industrial IoT may result into total energy consumption of about 364 TWh (about 1.03%) in 2030. Moore’s law and IoT combined cause data center energy needs going up to 752 TWh in 2030, and about 2.13% of global electricity available. Our sensitivity analysis reveals that the future impact of the data centers’ electricity consumption is vulnerable to behavioral usage trends, since the 95% confidence interval of [343, 1031] TWh is relatively wide. Our forecasts, however, exclude the energy needs of mobile devices, edge and fog computing. We offer a system dynamic model and simulation input data selected from the existing literature for replicating this study and applying alternative parameters to it. We further suggest multiple research directions on usage impact on data center energy consumption.
Overview
The claims and statistics of this paper haven’t been checked yet.
Run the check — free, no account needed. It reads the open-access text and checks the sources it cites.
Integrity signals
Registry
Cites
Statistics
Figures

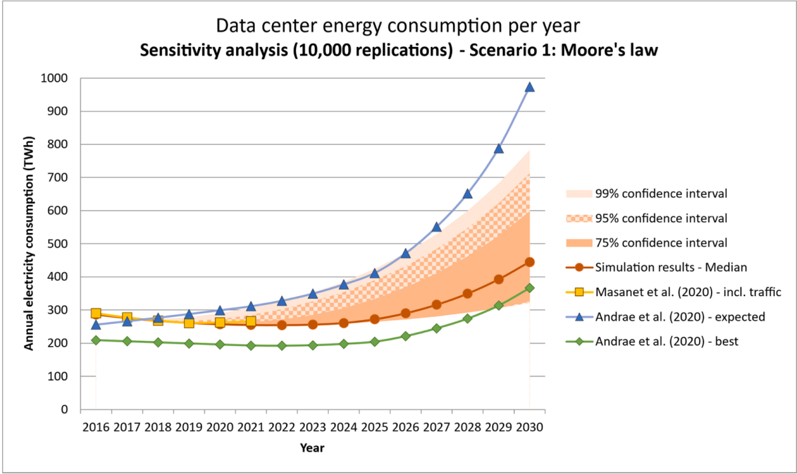
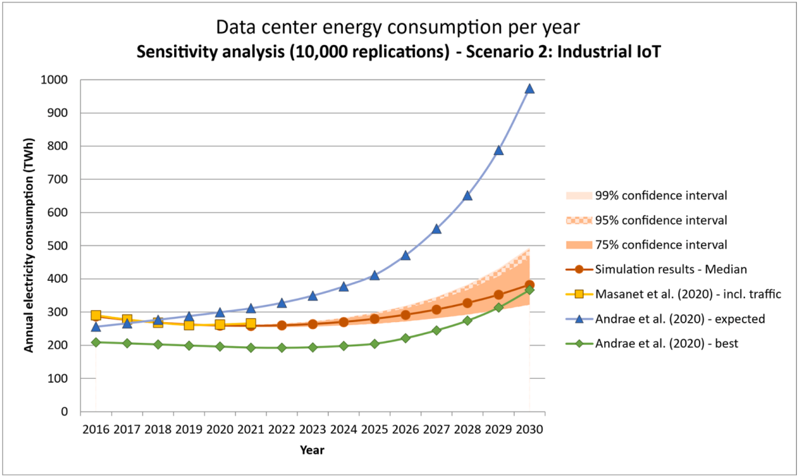
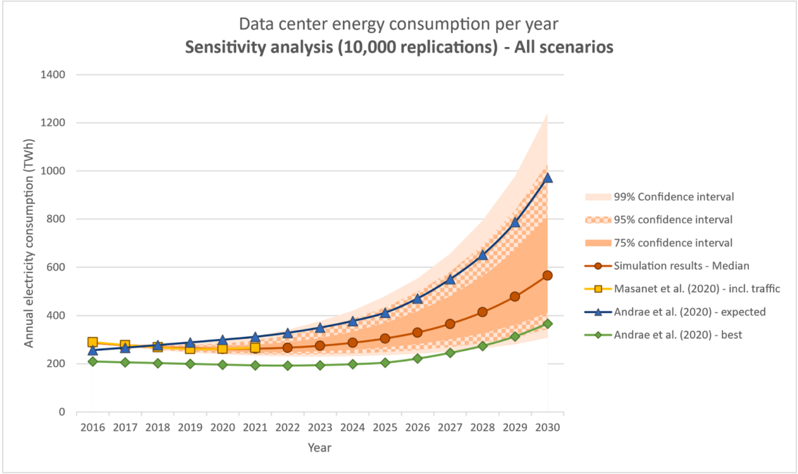
Verification
Claims the paper makes
The claims and statistics of this paper haven’t been checked yet.
Run the check — free, no account needed. It reads the open-access text and checks the sources it cites.
Claims other papers make about this one
Each is checked against this paper’s own text: does it say what the citing paper says it does?
The source backs part of the claim, not all of it — or backs it for a different population, condition or comparison.
In the citing paper
“The energy consumption of data centres alone will rise from 200 TWh in 2016 to 2967 TWh in 2030.”
From Energy efficiency in cloud computing data centers: a survey on software technologies (2023) · cites this paper as [2]
Experimental — accuracy not yet measured
Self-check
Percentages, sums and reported differences re-computed from the paper’s own numbers.
The self-check needs the paper’s full text.
Citations
Cites
Rogers, E. M., Singhal, A., & Quinlan, M. M. (2019) · Routledge eBooks · doi:10.4324/9780203710753-35 · Cited by 37,670
Five disruptive technology directions for 5G
Boccardi, F., Heath, R. W., Lozano, A., Marzetta, T. L., & Popovski, P. (2014) · IEEE Communications Magazine · doi:10.1109/mcom.2014.6736746 · Cited by 3,698
Scenarios: The art of strategic conversation
Schlange, L. E. (1997) · Futures · doi:10.1016/s0016-3287(97)90139-7 · Cited by 1,929
Recalibrating global data center energy-use estimates
Masanet, E., Shehabi, A., Lei, N., Smith, S., & Koomey, J. (2020) · Science · doi:10.1126/science.aba3758 · Cited by 1,545
On Global Electricity Usage of Communication Technology: Trends to 2030
Andrae, A., & Edler, T. (2015) · Challenges · doi:10.3390/challe6010117 · Cited by 1,334
Data Center Energy Consumption Modeling: A Survey
Dayarathna, M., Wen, Y., & Fan, R. (2016) · IEEE Communications Surveys & Tutorials · doi:10.1109/comst.2015.2481183 · Cited by 1,165
Valente, T. W. (2010) · Oxford University Press eBooks · doi:10.1093/acprof:oso/9780195301014.003.0010 · Cited by 1,143
A survey of blockchain from the perspectives of applications, challenges, and opportunities
Monrat, A. A., Schelen, O., & Andersson, K. (2019) · IEEE Access · doi:10.1109/access.2019.2936094 · Cited by 1,077
United States Data Center Energy Usage Report
Lawrence Berkeley National Laboratory (LBNL), B., Shehabi, A., USDOE, Smith, S., Sartor, D., Brown, R., Herrlin, M., Koomey, J., Masanet, E., Horner, N., et al. (2016) · doi:10.2172/1372902 · Cited by 1,040
All models are wrong: reflections on becoming a systems scientist
Sterman, J. D. (2002) · System Dynamics Review · doi:10.1002/sdr.261 · Cited by 1,021
Cited by
Sorted by citations
Items 101–200 of 419
Competing digital capacities: between state-led digital governance and local data center tradeoffs
Bridges, L. E. (2024) · Information Communication & Society · doi:10.1080/1369118x.2024.2331765 · Cited by 18
A Combined Trend Virtual Machine Consolidation Strategy for Cloud Data Centers
Chen, Y., Zhang, Z., Deng, Y., Min, G., & Cui, L. (2024) · IEEE Transactions on Computers · doi:10.1109/tc.2024.3416734 · Cited by 15
Graphene-Based Silicon Photonic Electro-Absorption Modulators and Phase Modulators
Wu, C.-H., Reep, T., Brems, S., Yudistira, D., Campenhout, J. V., Asselberghs, I., Huyghebaert, C., Pantouvaki, M., Wang, Z., & Thourhout, D. V. (2024) · IEEE Journal of Selected Topics in Quantum Electronics · doi:10.1109/jstqe.2024.3411058 · Cited by 15
Time Evidence Fusion Network: Multi-Source View in Long-Term Time Series Forecasting
Zhan, T., He, Y., Deng, Y., Li, Z., Du, W., & Wen, Q. (2025) · IEEE Transactions on Pattern Analysis and Machine Intelligence · doi:10.1109/tpami.2025.3596905 · Cited by 18
Black software — the energy unsustainability of software systems in the 21st century
Manner, J. (2022) · Oxford Open Energy · doi:10.1093/ooenergy/oiac011 · Cited by 15
Hao, J., Yuan, J., Wu, D., Xu, W., & Li, J. (2023) · Expert Systems with Applications · doi:10.1016/j.eswa.2023.121117 · Cited by 14
Guo, Y., Qu, S., Wang, C., Xing, Z., & Duan, K. (2024) · Applied Energy · doi:10.1016/j.apenergy.2024.123815 · Cited by 14
VM consolidation improvement approach using heuristics granular rules in cloud computing environment
Rozehkhani, S. M., & Mahan, F. (2022) · Information Sciences · doi:10.1016/j.ins.2022.02.042 · Cited by 14
Intelligent load forecasting technologies for diverse scenarios in the new power systems
Liu, T., Li, F., Zhang, D., Shan, L., Zhu, H., Du, P., Jiang, M., Goh, H. H., Kurniawan, T. A., Huang, C., et al. (2025) · Renewable and Sustainable Energy Reviews · doi:10.1016/j.rser.2025.116366 · Cited by 13
Thermal Optimization of Hybrid Cryogenic Computing Systems
Zhuldassov, N., Bairamkulov, R., & Friedman, E. G. (2023) · IEEE Transactions on Very Large Scale Integration (VLSI) Systems · doi:10.1109/tvlsi.2023.3271898 · Cited by 13
Applying Fuzzy Time Series for Developing Forecasting Electricity Demand Models
Rubio, J.-M., Rubio-Cienfuegos, J., Vidal-Silva, C. L., Cobo, J., & Duarte, V. (2023) · Mathematics · doi:10.3390/math11173667 · Cited by 13
Feng, Y., Yan, T., Zhang, C., Zhang, Z., & Pan, Y. (2025) · Energy · doi:10.1016/j.energy.2025.135039 · Cited by 13
Geospatial suitability analysis for data center placement: A case study in Texas, USA
Arzumanyan, M., Calzado, E. R., Lin, N., Bahadur, V., Das, J., Ko, T. L., & Koesterke, L. (2025) · Sustainable Cities and Society · doi:10.1016/j.scs.2025.106687 · Cited by 13
Pu, F., Jiang, S., & Zhang, L. (2022) · Environment Development and Sustainability · doi:10.1007/s10668-022-02474-5 · Cited by 13
Comprehensive assessment of coolants used single-phase immersion cooling data center
Li, X., Guo, S., Sun, H., Liu, S., Wang, X., & Wang, L. (2025) · Energy · doi:10.1016/j.energy.2025.139240 · Cited by 12
The complexity of transitioning from oil dependency: A dynamic modelling case study of Indonesia
Rahman, A., Richards, R., Dargusch, P., & Wadley, D. (2025) · Energy Economics · doi:10.1016/j.eneco.2025.108662 · Cited by 13
Optimal sizing of a globally distributed low carbon cloud federation
Vasconcelos, M., Cordeiro, D. D. A., Georges Da Costa, B., Dufossé, F., Nicod, J., & Rehn‐Sonigo, V. (2023) · IEEE/ACM International Symposium on Cluster, Cloud and Grid Computing (CCGrid) · doi:10.1109/ccgrid57682.2023.00028 · Cited by 12
Yang, L., Wu, H., Zhang, Z., Mao, R., Zhou, J., & Liang, X. Z. (2024) · Applied Thermal Engineering · doi:10.1016/j.applthermaleng.2024.123932 · Cited by 11
Exploring the AI electricity crisis scenario: A case study of Texas-ERCOT
Paccou, R., & Wijnhoven, F. (2025) · Next Energy · doi:10.1016/j.nxener.2025.100341 · Cited by 11
Self-citationOvercoming the Data Deluge Challenges with Greener Electronics
Lequepeys, J. R., Duranton, M., Bonnetier, S., Catrou, S., Fournel, R., ERNST, T. P., Herault, L., Louis, D., Jerraya, A. A., Valentian, A., et al. (2021) · European Solid-State Device Research Conference · doi:10.1109/essderc53440.2021.9631774 · Cited by 11
Aumeier, S. E., USDOE Office of Nuclear Energy (NE), Shropshire, D. E., Araujo, K., Koerner, C. L., Bell, C., Fauske, G., Johnson, R., Parsons, J. E., Gerace, S., et al. (2023) · doi:10.2172/1964093 · Cited by 11
Gathecha, G. K., Ombiro, O. N., Shelden, K., Stake, A., Murugami, M., Mungai, E., Odhiambo, G., Maree, E., Muthusamy, R., Marimuthu, M., et al. (2023) · Digital Health · doi:10.1177/20552076231203937 · Cited by 10
Bouaouda, A., Afdel, K., & Abounacer, R. (2024) · Sustainability · doi:10.3390/su16114438 · Cited by 10
Kokate, R., & Park, C. (2024) · Applied Thermal Engineering · doi:10.1016/j.applthermaleng.2024.124549 · Cited by 10
Baiocco, G., Genna, S., Salvi, D., & Ucciardello, N. (2024) · JOM · doi:10.1007/s11837-024-06908-5 · Cited by 10
Du, B., Jia, H., Li, Y., Du, E., Zhang, N., & Liang, D. S. (2025) · iEnergy · doi:10.23919/ien.2025.0007 · Cited by 10
Towards Greener Data Centers via Programmable Data Plane
Grigoryan, G., & Kwon, M. (2023) · IEEE International Conference on High Performance Switching and Routing (HPSR) · doi:10.1109/hpsr57248.2023.10148026 · Cited by 10
Efficient Virtual Machine Placement Strategy Based on Enhanced Genetic Approach
Barthwal, V., Rauthan, M. M. S., Varma, R., & Gaur, S. (2024) · SN Computer Science · doi:10.1007/s42979-024-02832-2 · Cited by 10
Energy-Aware Service Allocation: A Crow Search-Based Approach
Chowdhury, C. R., Misra, S., & Mandal, C. (2022) · IEEE Transactions on Green Communications and Networking · doi:10.1109/tgcn.2022.3216882 · Cited by 9
Periola, A. A. (2023) · Wireless Personal Communications · doi:10.1007/s11277-023-10676-x · Cited by 9
Hong, S., Li, C., Dang, C., Song, M., & Sakamoto, H. (2023) · Applied Thermal Engineering · doi:10.1016/j.applthermaleng.2023.121789 · Cited by 9
Quisbert-Trujillo, E., & Morfouli, P. (2023) · Discover Internet of Things · doi:10.1007/s43926-023-00051-4 · Cited by 9
Overcoming the Data Deluge Challenges with Greener Electronics
Lequepeys, J. R., Duranton, M., Bonnetier, S., Catrou, S., Fournel, R., ERNST, T. P., Hérault, L., Louis, D. N., Jerraya, A. A., Valentian, A., et al. (2021) · European Solid-State Circuits Conference (ESSCIRC) · doi:10.1109/esscirc53450.2021.9567836 · Cited by 9
Suryani, E., Hendrawan, R. A., Adipraja, P. F. E., Mudjahidin, Az-Zahra, A., Chou, S.-Y., Dewabharata, A., & Rizqi, Z. U. (2025) · Environment Development and Sustainability · doi:10.1007/s10668-025-06473-0 · Cited by 8
Oblique-fin heat sink design for uniform CPU cooling in immersion-cooled servers
Khoshvaght-Aliabadi, M., Nasrolahzadeh, A., Ghodrati, P., & Kang, Y. T. (2025) · Applied Thermal Engineering · doi:10.1016/j.applthermaleng.2025.129628 · Cited by 8
Song, M., Huang, R., Hou, L., & Liu, X. (2026) · Journal of Cleaner Production · doi:10.1016/j.jclepro.2026.147838 · Cited by 8
Huang, N., Li, X., Xu, Q., Chen, R., Chen, H., & Chen, A. (2023) · Energies · doi:10.3390/en16166063 · Cited by 8
SSEPC cloud: Carbon footprint aware power efficient virtual machine placement in cloud milieu
Parida, B. R., Rath, A. K., Pati, B., Panigrahi, C. R., Mohapatra, H., Tien-Hsiungweng, T., & Buyya, R. (2024) · Computer Science and Information Systems · doi:10.2298/csis230923018p · Cited by 8
Pillot, B., Al-Kurdi, N., Gervet, C., & Linguet, L. (2021) · Applied Energy · doi:10.1016/j.apenergy.2021.117158 · Cited by 8
Spatio-temporal load migration potential of data centers: Evaluation and application
Zhu, L., Wu, S., Liu, H., Wang, Q., & Tang, Y. P. (2023) · Frontiers in Energy Research · doi:10.3389/fenrg.2023.1289275 · Cited by 7
Chen, Y., Zhang, J., Shi, S., Fu, W., Ganesan, V., & Miljkovic, N. (2025) · International Journal of Heat and Mass Transfer · doi:10.1016/j.ijheatmasstransfer.2025.127620 · Cited by 7
Impact of Digital Economy on Energy Consumption and Energy Efficiency
Tsai, J.-C., & Ho, C.-W. (2025) · Sustainability · doi:10.3390/su172310831 · Cited by 7
Wang, X., Li, Q., Zhai, J., Jiang, Y., Wang, S., & Wang, J. (2025) · Applied Energy · doi:10.1016/j.apenergy.2025.127177 · Cited by 7
Wang, D., Ma, C., Chen, Y., Wen, A., Hu, M., & Luo, Q. (2024) · Sustainability · doi:10.3390/su16198390 · Cited by 8
Kusumawati, N., Setiarso, P., Muslim, S., Zakiyah, N., Rahmawati, K., & Fachrirakarsie, F. F. (2024) · Indonesian Journal of Chemistry · doi:10.22146/ijc.93830 · Cited by 7
Dynamic Virtual Machine Scheduling Using Residual Optimum Power-Efficiency In The Cloud Data Center
Ajmera, K., & Tewari, T. K. (2023) · The Computer Journal · doi:10.1093/comjnl/bxad045 · Cited by 7
Task consolidation based power consumption minimization in cloud computing environment
Badr, S., Mahalawy, A. E., Attiya, G., & Nasr, A. A. (2022) · Multimedia Tools and Applications · doi:10.1007/s11042-022-14009-1 · Cited by 7
Enhancing the output of time series forecasting algorithms for cloud resource provisioning
Agulló, F., Gutierrez-Torre, A., Torres, J., & Berral, J. L. (2025) · Future Generation Computer Systems · doi:10.1016/j.future.2025.107833 · Cited by 6
Chisale, S. W., Lee, H. S., & Calvo, M. S. (2025) · Energy · doi:10.1016/j.energy.2025.137212 · Cited by 6
Liu, Y., Zhou, C., Hu, Y., Zhang, W., He, W., & Guan, W. (2025) · Buildings · doi:10.3390/buildings15224042 · Cited by 6
Deng, P., Xu, Q., Zhu, X., & Dong, W. (2025) · International Journal of Thermal Sciences · doi:10.1016/j.ijthermalsci.2025.110465 · Cited by 6
Ali, Q. I. (2026) · Discover Artificial Intelligence · doi:10.1007/s44163-025-00823-7 · Cited by 6
Data Centers and Green Energy: Paving the Way for a Sustainable Digital Future
Osibo, B., & Adamo, S. (2023) · International Journal of Latest Technology in Engineering Management & Applied Science · doi:10.51583/ijltemas.2023.121103 · Cited by 6
Shukla, M. Y., & Kandlikar, S. G. (2024) · Enhanced heat transfer/Journal of enhanced heat transfer · doi:10.1615/jenhheattransf.2024051600 · Cited by 6
Mongia, V. (2024) · SN Computer Science · doi:10.1007/s42979-024-02982-3 · Cited by 6
Graph Convolutional Spectral Clustering for Electricity Market Data Clustering
Huang, L., Shan, M., Weng, L., & Meng, L. Y. (2024) · Applied Sciences · doi:10.3390/app14125263 · Cited by 6
Parent, G., Ghaffari, O., Larimi, Y. N., & Sylvestre, J. (2024) · Case Studies in Thermal Engineering · doi:10.1016/j.csite.2024.104462 · Cited by 6
Su, L., Wu, W., Feng, W., Qin, J., & Ao, Y. (2024) · Energies · doi:10.3390/en17153623 · Cited by 6
Agrawal, A., Shrivastava, K., Chakrabarty, A., Singh, Y., Shaw, R., & Padhi, A. (2024) · International Conference on Trends in Quantum Computing and Emerging Business Technologies (TQCEBT) · doi:10.1109/tqcebt59414.2024.10545213 · Cited by 6
Rack Inlet Temperature Prediction Based on Deep Learning
Peng, Y., Lee, C.-M., Tung, K.-Y., & Chen, R. (2022) · International Conference on Mechatronics Technology (ICMT) · doi:10.1109/icmt56556.2022.9997747 · Cited by 6
PULSE: A modular framework for predictive energy efficiency in heterogeneous data centers
Flores-Martin, D., Lemus-Prieto, F., & Rico‐Gallego, J. (2025) · SoftwareX · doi:10.1016/j.softx.2025.102313 · Cited by 6
Sánchez, J. M. B., Universidad de Guanajuato, C. I.-S., Serrato, R. B., Martínez–Jiménez, L., & Corporación Universitaria Rafael Núñez, C. (2025) · AIMS energy · doi:10.3934/energy.2025015 · Cited by 5
Villa, G., Ciganda, J. L. C., Abrami, G., & Toppi, T. (2025) · Energies · doi:10.3390/en18133454 · Cited by 5
Akimoto, K., Sano, F., & Homma, T. (2025) · Energy Strategy Reviews · doi:10.1016/j.esr.2025.101917 · Cited by 5
Energy-Aware Dynamic Virtual Machine Scheduling in Cloud Computing: A Survey
Ajmera, K., Tewari, T. K., Singh, V. K., Vikash, & Upadhyay, P. K. (2023) · International Conference on Contemporary Computing · doi:10.1145/3607947.3607970 · Cited by 5
Rabieyan, R., Yahyapour, R., & Jahnke, P. (2024) · The Journal of Supercomputing · doi:10.1007/s11227-024-06304-5 · Cited by 5
Heat Load Efficiency in Multi-Temperature Cryogenic Computing Systems
Zhuldassov, N., Bairamkulov, R., & Friedman, E. G. (2024) · Cryogenics · doi:10.1016/j.cryogenics.2024.104013 · Cited by 5
Optimized and energy efficient server fan control using deep reinforcement learning method
Fulpagare, Y., Chiou, J.-H., Liao, Y., & Wang, C. (2025) · Journal of Building Engineering · doi:10.1016/j.jobe.2025.112306 · Cited by 5
Data centers environmental impact assessment features
Semenov, A. B., & Oganesyan, E. (2021) · E3S Web of Conferences · doi:10.1051/e3sconf/202131104007 · Cited by 5
Al-Naday, M., Thomos, N., Hu, J., Volckaert, B., Turck, F. D., & Reed, M. J. (2022) · IEEE Transactions on Services Computing · doi:10.1109/tsc.2022.3211739 · Cited by 5
Optimizing emissions for machine learning training
Ekanayake, S. P., Shah, T., & Evans, S. (2023) · IEEE Conference on Technologies for Sustainability · doi:10.1109/sustech57309.2023.10129569 · Cited by 5
Mei, Y., Wang, W., Liang, Y., Liu, Q., Chen, S., & Wang, T. (2023) · ACM Transactions on Sensor Networks · doi:10.1145/3617998 · Cited by 5
Digital Transformation for Inclusive and Sustainable Development in Asia
Palit, A., & Rahut, D. B. (2024) · Asian Development Bank Institute eBooks · doi:10.56506/hsdc4319 · Cited by 5
Суворова, С., Pylypenko, M., Толпежников, Р. А., Ковтун, О. І., & Tsebro, Y. (2024) · AD ALTA Journal of Interdisciplinary Research · doi:10.33543/140139114119 · Cited by 5
Sustainable placement of VNF chains in Intent-based Networking
Riccio, T. D., Massa, J., Forti, S., & Antonio Brogi, A. (2023) · IEEE/ACM International Conference on Utility and Cloud Computing (UCC) · doi:10.1145/3603166.3632167 · Cited by 5
Pramanik, P. K. D., Pal, S., Mukhopadhyay, M., & Choudhury, P. (2024) · The Journal of Supercomputing · doi:10.1007/s11227-024-06364-7 · Cited by 5
Zhang, Y., Chen, L., Wang, H., Zhang, J., Zeng, B., & Liu, W. (2024) · IET Generation Transmission & Distribution · doi:10.1049/gtd2.13249 · Cited by 5
Green IT: The Evolution of Environmental Concerns Within ICT Policy, Research and Practice
Fors, P., Kreps, D., & O’Brien, A. (2024) · Palgrave studies in digital business & enabling technologies · doi:10.1007/978-3-031-61749-2_2 · Cited by 5
Greener and Energy-Efficient Data Center for Blockchain-based Cryptocurrency Mining
Mahmud, A., Kamal, K., & Reza, A. W. (2025) · Procedia Computer Science · doi:10.1016/j.procs.2024.12.021 · Cited by 5
Optimal Asynchronous Dynamic Policies in Energy-Efficient Data Centers
Ma, J.-Y., Li, Q., & Xia, L. (2022) · Systems · doi:10.3390/systems10020027 · Cited by 5
Adaptive Control of Data Center Cooling using Deep Reinforcement Learning
Heimerson, A., Sjölund, J., Brännvall, R., Gustafsson, J., & Eker, J. (2022) · IEEE International Conference on Autonomic Computing and Self-Organizing Systems Companion (ACSOS-C) · doi:10.1109/acsosc56246.2022.00018 · Cited by 5
Green Cloud Computing: Challenges and Opportunities
Cordeiro, D. D. A., Francesquini, E., Amarís, M., Castro, M., Baldassin, A., & Lima, J. V. F. (2023) · Anais do Simpósio Brasileiro de Sistemas de Informação (SBSI) · doi:10.5753/sbsi_estendido.2023.229291 · Cited by 5
Tian, T., Wang, X., Liu, Y., Yang, X., Sun, B. N., & Li, J. (2023) · Applied Energy · doi:10.1016/j.apenergy.2023.121520 · Cited by 5
Experimental investigation of an autonomous liquid-cooled uninterruptible power supply (UPS)
Hnayno, M., Chehade, A., Klaba, H., Bauduin, H., Polidori, G., & Maalouf, C. (2023) · Energy Reports · doi:10.1016/j.egyr.2023.05.010 · Cited by 5
Data Centers Carbon Emissions at Crossroads: An Empirical Study
Maji, D., Hanafy, W. A., Li, W., Irwin, D., Shenoy, P. J., & Sitaraman, R. K. (2025) · ACM SIGEnergy Energy Informatics Review · doi:10.1145/3757892.3757899 · Cited by 4
Next-generation high-speed optical switch using photonic crystal: a review
Saha, D., Dey, A., & Mukhopadhyay, S. (2026) · Journal of Optics · doi:10.1007/s12596-026-03131-0 · Cited by 5
Activation Control of Vision Models for Sustainable AI Systems
Burton-Barr, J., Fernando, B., & Rajan, D. (2024) · IEEE Transactions on Artificial Intelligence · doi:10.1109/tai.2024.3372935 · Cited by 4
Transient modelling of heat exchangers using a steady-state model for low heat capacity media
Granda, M., Trojan, M., Taler, J., & Taler, D. (2025) · Energy · doi:10.1016/j.energy.2025.136466 · Cited by 4
Erkek, T. Ü., Erkek, M., Aydın, M. B., & Gezer, K. (2025) · International Journal of Refrigeration · doi:10.1016/j.ijrefrig.2025.12.007 · Cited by 4
Weng, Y., Guan, W., & Ababei, C. (2025) · Journal of Energy Storage · doi:10.1016/j.est.2025.119508 · Cited by 4
Holistic energy analysis method for thermal management architectures of data centers
Park, W. Y., Lee, D., Ganesan, V., Du, X., Pinkus, I., Garimella, V. S., Aguirre, T. G., Nawaz, K., King, W. P., & Miljkovic, N. (2026) · International Journal of Heat and Mass Transfer · doi:10.1016/j.ijheatmasstransfer.2026.128971 · Cited by 4
Virtual Machine Allocation in Cloud Computing Environments using Giant Trevally Optimizer
Zhang, H.-Y. (2023) · International Journal of Advanced Computer Science and Applications · doi:10.14569/ijacsa.2023.01409115 · Cited by 4
Performance and Energy Savings Trade-Off with Uncertainty-Aware Cloud Workload Forecasting
Carraro, D., Rossi, A., Visentin, A., Prestwich, S., & Brown, K. N. (2023) · IEEE International Conference on Network Protocols (ICNP) · doi:10.1109/icnp59255.2023.10355570 · Cited by 4
SUIT: Secure Undervolting with Instruction Traps
Juffinger, J., Kalinin, S., Gruss, D., & Mueller, F. (2024) · International Conference on Architectural Support for Programming Languages and Operating Systems (ASPLOS) · doi:10.1145/3620665.3640373 · Cited by 4
Shirafkan, H., & Shameli‐Sendi, A. (2024) · Cluster Computing · doi:10.1007/s10586-024-04763-2 · Cited by 4
Integrating the IoT and New Energy to Promote a Sustainable Low-Carbon Economy
Chen, Y., Hou, Y., & Lyu, J. (2025) · Sustainability · doi:10.3390/su17156755 · Cited by 4
Ham, S., Kang, T., Lee, W.-Y., & Kim, M. (2025) · International Journal of Hydrogen Energy · doi:10.1016/j.ijhydene.2025.150785 · Cited by 4
Liang, L., & Chen, P. (2025) · Transport Policy · doi:10.1016/j.tranpol.2025.103779 · Cited by 4
Vasconcelos, M., Cordeiro, D. D. A., & Dufossé, F. (2022) · International Conference on Smart Cities and Green ICT Systems · doi:10.5220/0011047000003203 · Cited by 4
Reduction of Carbon Footprint of Dynamical System Simulation
Zhao, Y., Nazaré, T. E. D., & Nepomuceno, E. G. (2023) · IEEE International Conference on Industry Applications · doi:10.1109/induscon58041.2023.10374654 · Cited by 4
Metadata
- Authors
- Koot, M., & Wijnhoven, F.
- Affiliations
- University of Twente (NL)
- Corresponding author
- Wijnhoven, Fons
- Venue
- Applied Energy
- Publisher
- Elsevier BV
- Published
- 2021-06
- Volume
- 291
- Pages
- 116798
- ISSN
- 0306-2619 (ISSN-L)
- OpenAlex
- W3136117146
- Cited by
- 403
- References
- 57
- Citations by year
- 2026: 79 · 2025: 99 · 2024: 86 · 2023: 71 · 2022: 46 · 2021: 22
- FWCI
- 16.55
- Type
- journal article
- Language
- en
- Open access
- hybrid
- doi.org
- Licence
- Locations
- Applied Energy (publishedVersion, cc-by)
- University of Twente Research Information (publishedVersion, cc-by)
- RePEc: Research Papers in Economics (submittedVersion)
- University of Twente Research Information (submittedVersion, cc-by)
- Topics
- Physical Sciences › Engineering › Electrical and Electronic Engineering › Green IT and Sustainability
- Physical Sciences › Computer Science › Hardware and Architecture › Energy Efficiency in Computing
- Physical Sciences › Computer Science › Information Systems › Cloud Computing and Resource Management
- Keywords
- energy forecasting, Moore's law, Industrial Internet of Things, data center efficiency, system dynamics modeling, energy consumption projections
About these checks
Registry, retraction, Cites and statistics results are computed, not judged, with one exception: a printed reference that no index lists is read once by a model before it counts as a citation error. Claims are extracted by a model and kept only when their quote appears verbatim in the text; each cited source is then checked, with a model’s help, for whether it says what the claim relies on. Those verdicts can be wrong — read the claim’s quote and the cited source before relying on one.
Statistics and arithmetic are recomputed, not judged.
Confidence bands are shown only for fields calibrated on our annotated test set. None is calibrated yet, so no band is shown.
What counts as a claim ›How we measure confidence ›How we check this ›
Are you an author, or do you see a problem with this page? Request a review
