

The DOI matches its Crossref record; 53 of the 53 references it cites were found in a registry or an index.
Extracellular Vesicles from a Helminth Parasite Suppress Macrophage Activation and Constitute an Effective Vaccine for Protective Immunity
Open accessAbstract
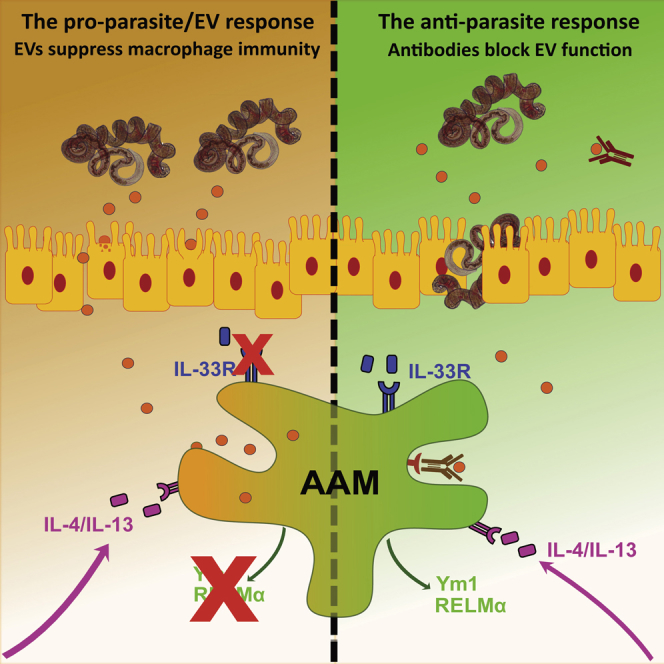
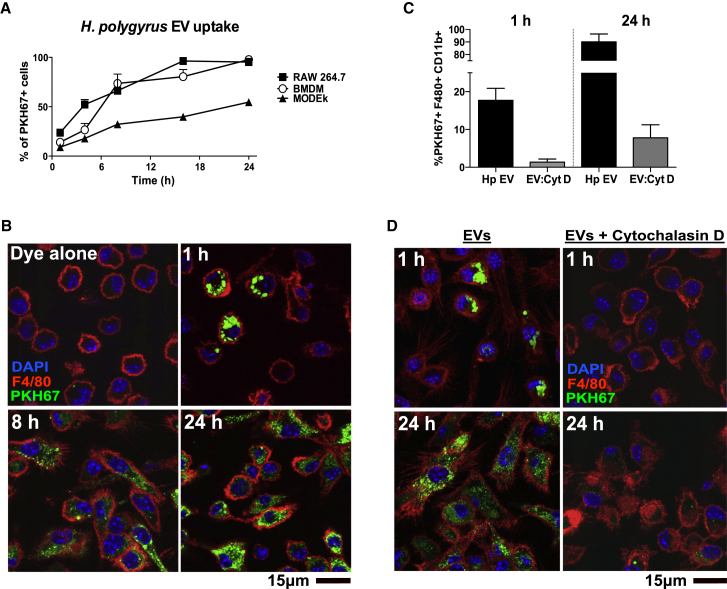
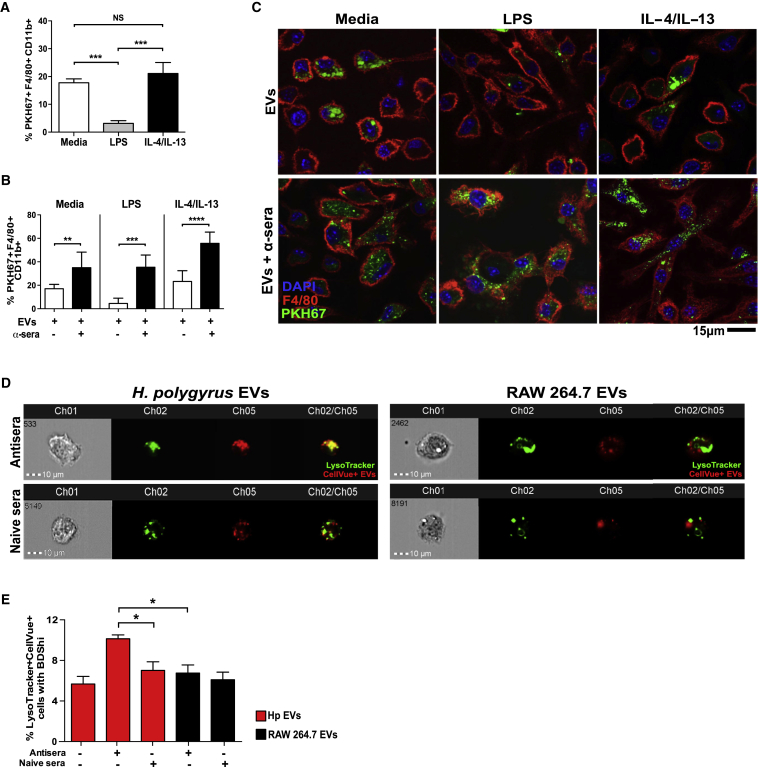
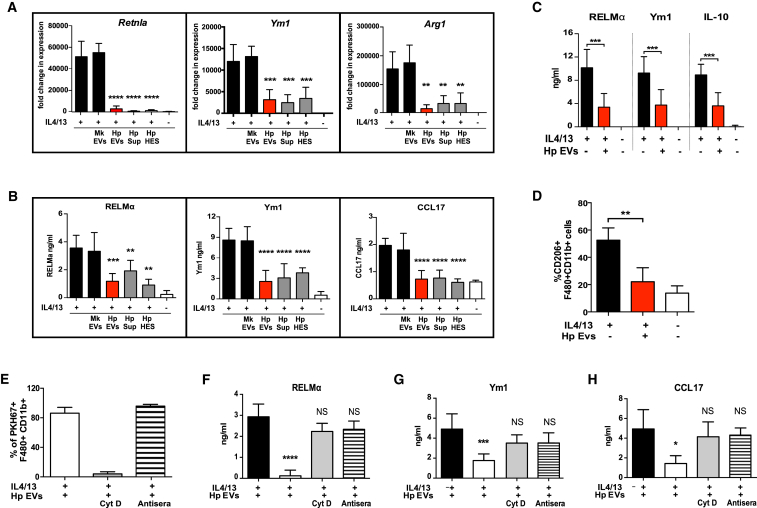
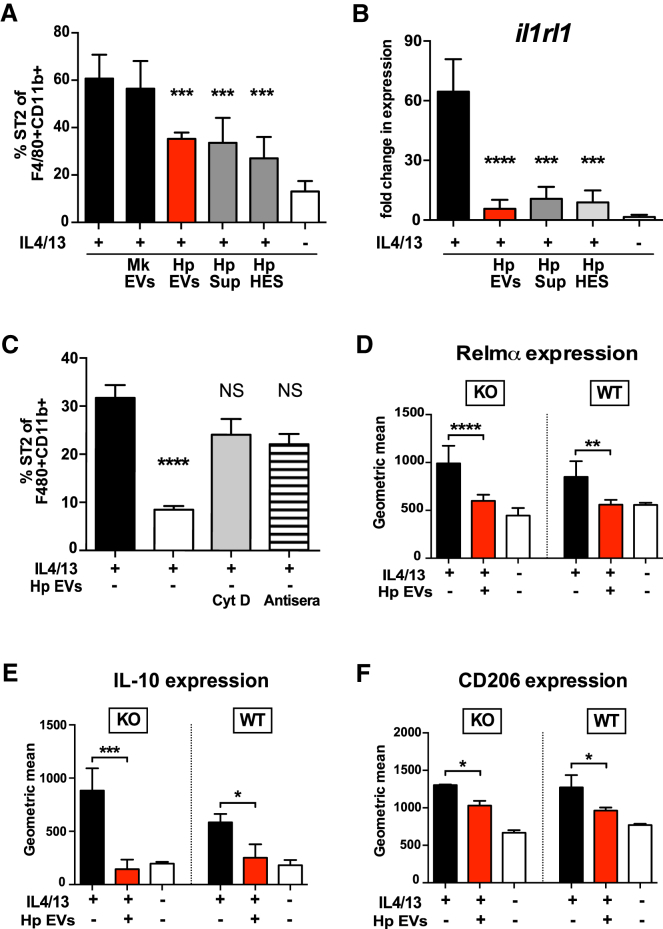
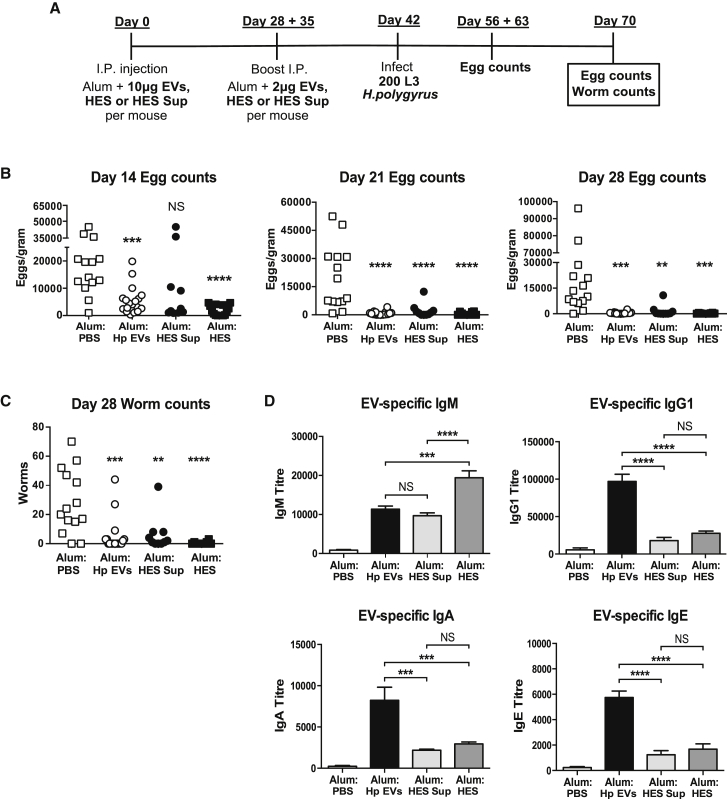
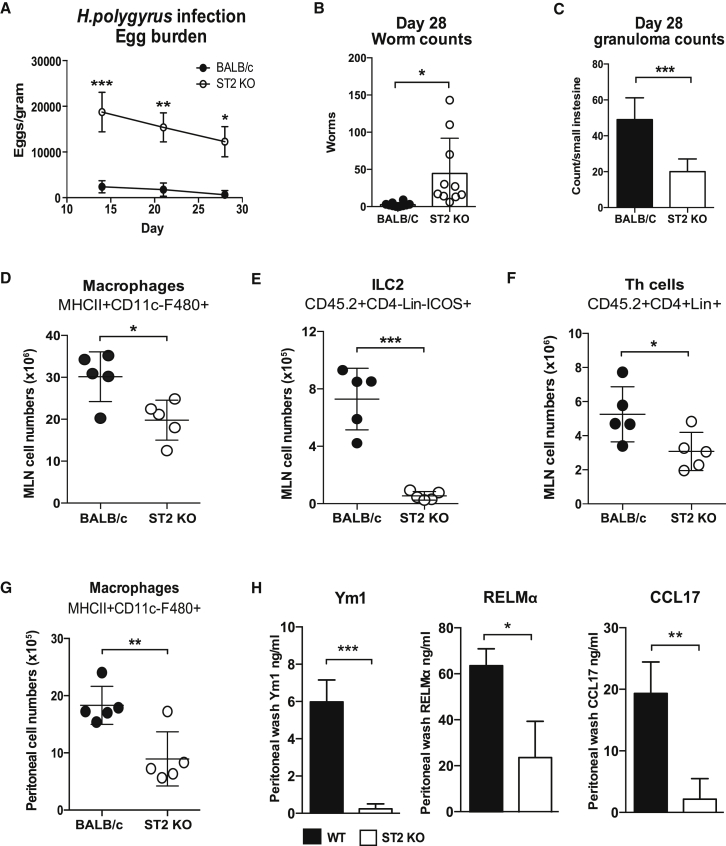
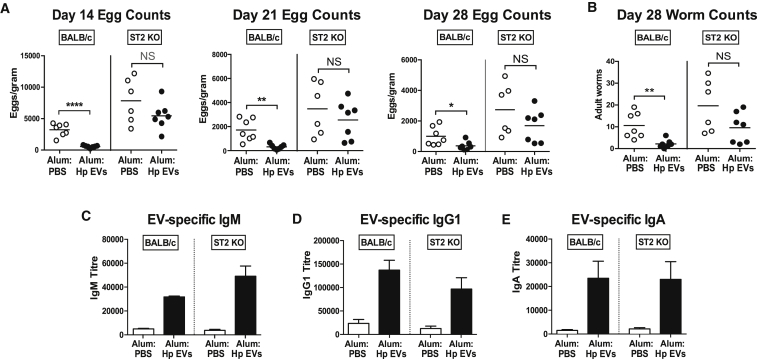
Recent studies have demonstrated that many parasites release extracellular vesicles (EVs), yet little is known about the specific interactions of EVs with immune cells or their functions during infection. We show that EVs secreted by the gastrointestinal nematode Heligmosomoides polygyrus are internalized by macrophages and modulate their activation. EV internalization causes downregulation of type 1 and type 2 immune-response-associated molecules (IL-6 and TNF, and Ym1 and RELMα) and inhibits expression of the IL-33 receptor subunit ST2. Co-incubation with EV antibodies abrogated suppression of alternative activation and was associated with increased co-localization of the EVs with lysosomes. Furthermore, mice vaccinated with EV-alum generated protective immunity against larval challenge, highlighting an important role in vivo. In contrast, ST2-deficient mice are highly susceptible to infection, and they are unable to clear parasites following EV vaccination. Hence, macrophage activation and the IL-33 pathway are targeted by H. polygyrus EVs, while neutralization of EV function facilitates parasite expulsion.
Overview
The claims and statistics of this paper haven’t been checked yet.
Run the check — free, no account needed. It reads the open-access text and checks the sources it cites.
Integrity signals
Registry
Cites
Statistics
Figures
Verification
Claims the paper makes
The claims and statistics of this paper haven’t been checked yet.
Run the check — free, no account needed. It reads the open-access text and checks the sources it cites.
Claims other papers make about this one
Each is checked against this paper’s own text: does it say what the citing paper says it does?
The source backs part of the claim, not all of it — or backs it for a different population, condition or comparison.
In the citing paper
“A paradigm-shifting discovery has been that helminths release extracellular vesicles (EVs), often termed exosomes, which are able to fuse and enter host cells, carrying with them a cargo of miRNAs (Buck et al., 2014, Coakley et al., 2017).”
From Modulation of Host Immunity by Helminths: The Expanding Repertoire of Parasite Effector Molecules (2018) · cites this paper as Coakley et al., 2017
Experimental — accuracy not yet measuredThe source backs part of the claim, not all of it — or backs it for a different population, condition or comparison.
In the citing paper
“In H. polygyrus infections, these EVs target epithelial cells and macrophages, resulting in their loss of expression of the IL-33 receptor (IL-33R, also termed ST2) and downregulation of other immune genes.”
From Modulation of Host Immunity by Helminths: The Expanding Repertoire of Parasite Effector Molecules (2018) · cites this paper as Coakley et al., 2017
Experimental — accuracy not yet measuredThe source backs part of the claim, not all of it — or backs it for a different population, condition or comparison.
In the citing paper
“Hence EVs are an adaptable part of the armory of helminth immunomodulators, allowing extracellular pathogens to manipulate events within host cells in a receptor-independent manner (Coakley et al., 2017).”
From Modulation of Host Immunity by Helminths: The Expanding Repertoire of Parasite Effector Molecules (2018) · cites this paper as Coakley et al., 2017
Experimental — accuracy not yet measuredThe cited source says what the claim attributes to it.
In the citing paper
“through the release of small RNA-containing extracellular vesicles that suppress transcription of the IL-33 receptor”
From Modulation of Host Immunity by Helminths: The Expanding Repertoire of Parasite Effector Molecules (2018) · cites this paper as Coakley et al., 2017
The cited source says what the claim attributes to it.
In the citing paper
“These effects result in suppression of both alternative and inflammatory macrophage activation (Coakley et al., 2017).”
From Modulation of Host Immunity by Helminths: The Expanding Repertoire of Parasite Effector Molecules (2018) · cites this paper as Coakley et al., 2017
Self-check
Percentages, sums and reported differences re-computed from the paper’s own numbers.
The self-check needs the paper’s full text.
Citations
Cites
Nuocytes represent a new innate effector leukocyte that mediates type-2 immunity
Neill, D. R., Wong, S. H., Bellosi, A., Flynn, R. J., Daly, M. G., Langford, T. K. A., Bucks, C. M., Kane, C. M., Fallon, P. G., Pannell, R., et al. (2010) · Nature · doi:10.1038/nature08900 · Cited by 2,079
Endocytosis, intracellular sorting, and processing of exosomes by dendritic cells
Morelli, A. E., Larregina, A. T., Shufesky, W. J., Sullivan, M. L. G., Stolz, D. B., Papworth, G. D., Zahorchak, A. F., Logar, A., Wang, Z., Watkins, S. C., et al. (2004) · Blood · doi:10.1182/blood-2004-03-0824 · Cited by 1,075
Buck, A. H., Coakley, G., Simbari, F., McSorley, H. J., Quintana, J. F., Le Bihan, T., Kumar, S., Abreu-Goodger, C., Lear, M., Harcus, Y., et al. (2014) · Nature Communications · doi:10.1038/ncomms6488 · Cited by 770
Self-citationDeatherage, B. L., & Cookson, B. T. (2012) · Infection and Immunity · doi:10.1128/iai.06014-11 · Cited by 765
Kurowska‐Stolarska, M., Stolarski, B., Kewin, P., Murphy, G., Corrigan, C. J., Ying, S., Pitman, N. I., Mirchandani, A. S., Rana, B. M. J., van Rooijen, N., et al. (2009) · The Journal of Immunology · doi:10.4049/jimmunol.0901575 · Cited by 747
Interaction and uptake of exosomes by ovarian cancer cells
Escrevente, C., Keller, S., Altevogt, P., & Costa, J. (2011) · BMC Cancer · doi:10.1186/1471-2407-11-108 · Cited by 666
Interleukin-33 in tissue homeostasis, injury, and inflammation
Molofsky, A. B., Savage, A. K., & Locksley, R. M. (2015) · Immunity · doi:10.1016/j.immuni.2015.06.006 · Cited by 638
Anthony, R. M., Urban, J. F., Alem, F., Hamed, H. A., Rozo, C. T., Boucher, J.-L., Van Rooijen, N., & Gause, W. C. (2006) · Nature Medicine · doi:10.1038/nm1451 · Cited by 522
Townsend, M. J., Fallon, P. G., Matthews, D. J., Jolin, H. E., & McKenzie, A. N. J. (2000) · The Journal of Experimental Medicine · doi:10.1084/jem.191.6.1069 · Cited by 482
Type 2 immunity and wound healing: evolutionary refinement of adaptive immunity by helminths
Gause, W. C., Wynn, T. A., & Allen, J. E. (2013) · Nature reviews. Immunology · doi:10.1038/nri3476 · Cited by 481
Cited by
Sorted by citations
Modulation of Host Immunity by Helminths: The Expanding Repertoire of Parasite Effector Molecules
Maizels, R. M., Smits, H. H., & McSorley, H. J. (2018) · Immunity · doi:10.1016/j.immuni.2018.10.016 · Cited by 435
Self-citationDevelopment of Extracellular Vesicle Therapeutics: Challenges, Considerations, and Opportunities
Claridge, B., Lozano, J., Poh, Q. H., & Greening, D. W. (2021) · Frontiers in Cell and Developmental Biology · doi:10.3389/fcell.2021.734720 · Cited by 243
Eichenberger, R. M., Ryan, S., Jones, L., Buitrago, G., Polster, R., Montes de Oca, M., Zuvelek, J., Giacomin, P. R., Dent, L. A., Engwerda, C. R., et al. (2018) · Frontiers in Immunology · doi:10.3389/fimmu.2018.00850 · Cited by 197
HpARI protein secreted by a helminth parasite suppresses interleukin-33
Osbourn, M., Soares, D. C., Vacca, F., Cohen, E. S., Scott, I. C., Gregory, W. F., Smyth, D. J., Toivakka, M., Kemter, A. M., le Bihan, T., et al. (2017) · Immunity · doi:10.1016/j.immuni.2017.09.015 · Cited by 178
Self-citationHelminth parasites and immune regulation
Gazzinelli-Guimarães, P. H., & Nutman, T. B. (2018) · F1000Research · doi:10.12688/f1000research.15596.1 · Cited by 173
Metadata
- Authors
- Coakley, G., McCaskill, J. L., Borger, J. G., Simbari, F., Robertson, E., Millar, M., Harcus, Y., McSorley, H. J., Maizels, R. M., & Buck, A. H.
- Affiliations
- Centre for Immunity, Infection and Evolution (GB)
- Centre for Inflammation Research (GB)
- Wellcome Centre for Molecular Parasitology (GB)
- Corresponding author
- Maizels, Rick M.
- Buck, Amy H.
- Venue
- Cell Reports
- Publisher
- Elsevier BV
- Published
- 2017-05
- Volume
- 19
- Issue
- 8
- Pages
- 1545-1557
- ISSN
- 2211-1247 (ISSN-L)
- PMC
- PMC5457486
- OpenAlex
- W2618954565
- Cited by
- 219
- References
- 53
- Citations by year
- 2026: 14 · 2025: 20 · 2024: 32 · 2023: 23 · 2022: 21 · 2021: 22 · 2020: 38 · 2019: 23 · 2018: 21 · 2017: 4
- FWCI
- 20.37
- Type
- journal article
- Language
- en
- Open access
- gold
- doi.org
- Licence
- Locations
- Cell Reports (publishedVersion, cc-by)
- Europe PMC (PubMed Central) (publishedVersion, cc-by)
- PubMed Central (publishedVersion, cc-by)
- PubMed (publishedVersion)
- Discovery Research Portal (University of Dundee) (publishedVersion, cc-by)
- ENLIGHTEN (Jurnal Bimbingan dan Konseling Islam) (acceptedVersion)
- Monash University Research Portal (Monash University) (submittedVersion, cc-by)
- DOAJ (DOAJ: Directory of Open Access Journals) (submittedVersion, cc-by-sa)
- Edinburgh Research Explorer (University of Edinburgh) (submittedVersion, cc-by)
- Funders
- Biotechnology and Biological Sciences Research Council (BB/J01446X/1)
- Wellcome Trust (AHB-097394, RMM-106122, 095831, 104111)
- Topics
- Life Sciences › Immunology and Microbiology › Parasitology › Parasites and Host Interactions
- Life Sciences › Immunology and Microbiology › Parasitology › Helminth infection and control
- Life Sciences › Biochemistry, Genetics and Molecular Biology › Molecular Biology › Extracellular vesicles in disease
- Keywords
- extracellular vesicles, Heligmosomoides polygyrus, macrophage activation, alternative macrophage activation, vaccines, nematode infection, interleukin-6, TNF-α, Ym1, RELMα, protective immunity
- MeSH terms
- Extracellular Vesicles, Interleukin-1 Receptor-Like 1 Protein, Animals, Antibodies, Helminth, Antibody Formation, Bone Marrow Cells, Immunity, Macrophage Activation, Macrophages, Nematospiroides dubius, Parasites, Vaccination, Vaccines, Cytochalasin D, Receptors, Interleukin, Mice
About these checks
Registry, retraction, Cites and statistics results are computed, not judged, with one exception: a printed reference that no index lists is read once by a model before it counts as a citation error. Claims are extracted by a model and kept only when their quote appears verbatim in the text; each cited source is then checked, with a model’s help, for whether it says what the claim relies on. Those verdicts can be wrong — read the claim’s quote and the cited source before relying on one.
Statistics and arithmetic are recomputed, not judged.
Confidence bands are shown only for fields calibrated on our annotated test set. None is calibrated yet, so no band is shown.
What counts as a claim ›How we measure confidence ›How we check this ›
Are you an author, or do you see a problem with this page? Request a review
