

The DOI matches its Crossref record; 192 of the 193 references it cites were found in a registry or an index.
The Mouse Microbiome Is Required for Sex-Specific Diurnal Rhythms of Gene Expression and Metabolism
Open accessAbstract
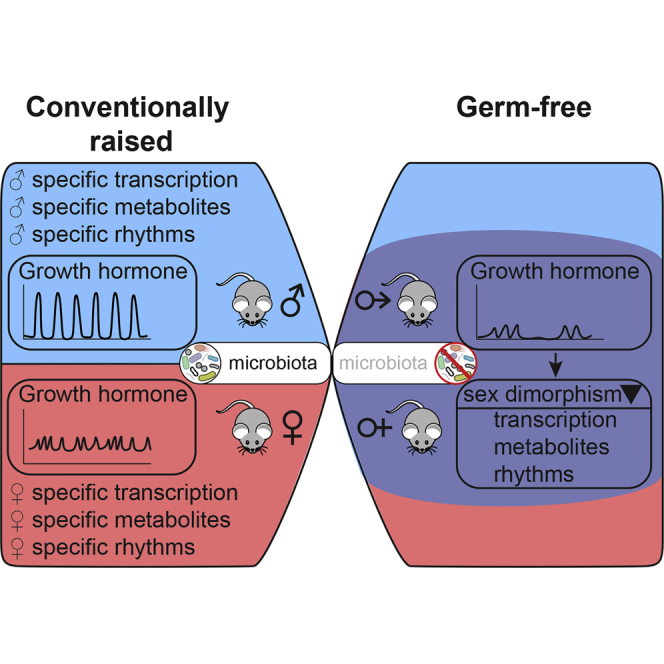
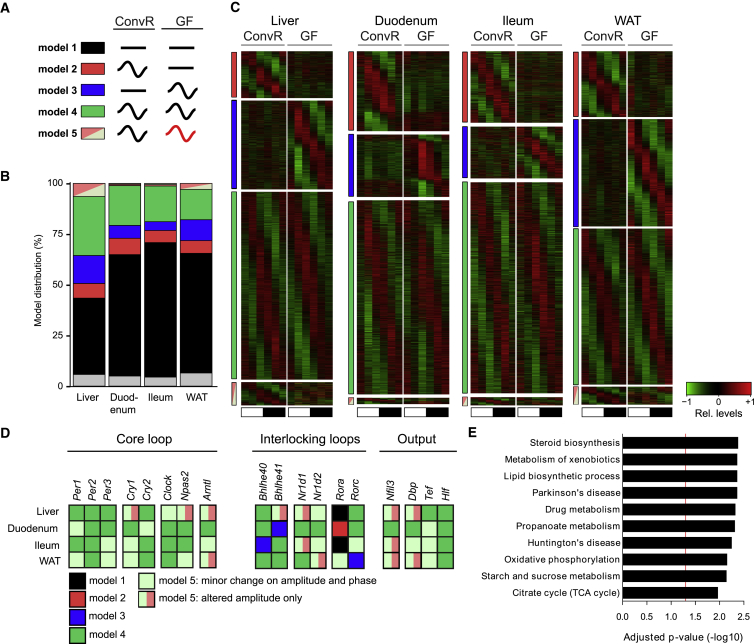
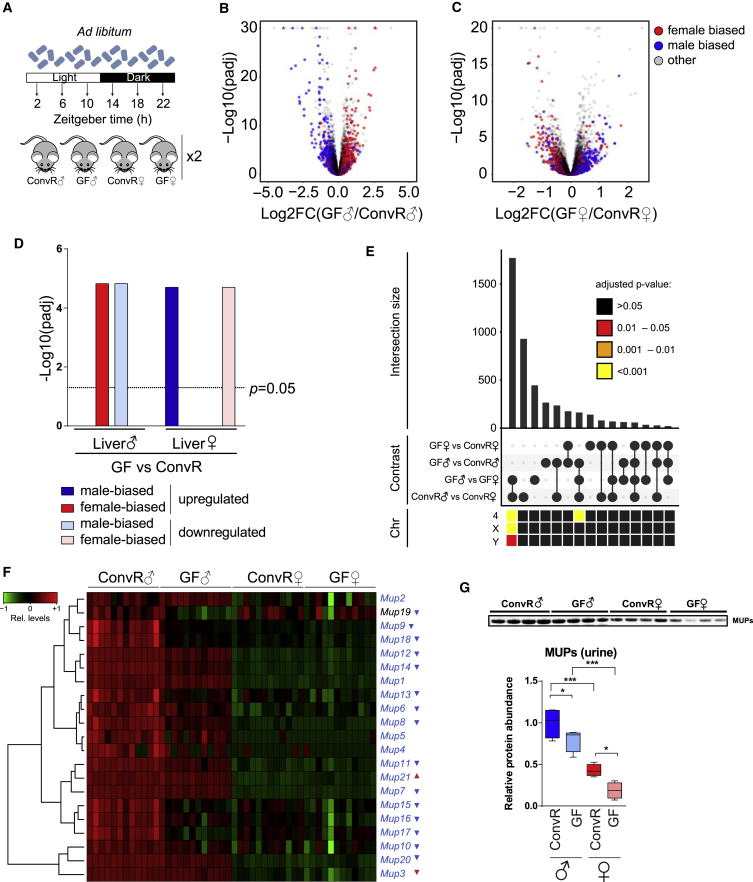
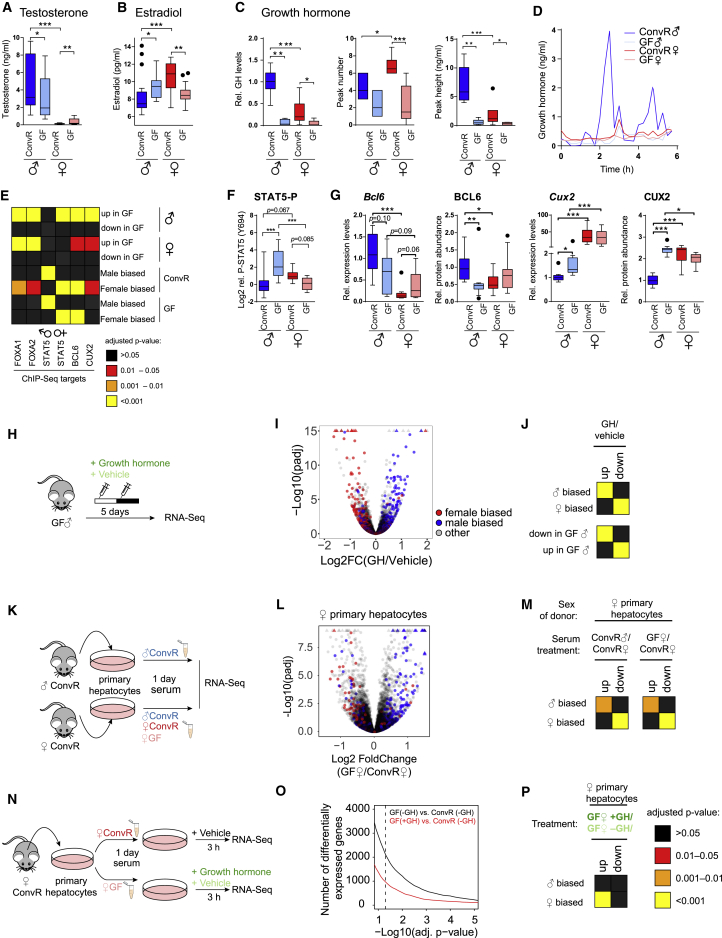
The circadian clock and associated feeding rhythms have a profound impact on metabolism and the gut microbiome. To what extent microbiota reciprocally affect daily rhythms of physiology in the host remains elusive. Here, we analyzed transcriptome and metabolome profiles of male and female germ-free mice. While mRNA expression of circadian clock genes revealed subtle changes in liver, intestine, and white adipose tissue, germ-free mice showed considerably altered expression of genes associated with rhythmic physiology. Strikingly, the absence of the microbiome attenuated liver sexual dimorphism and sex-specific rhythmicity. The resulting feminization of male and masculinization of female germ-free animals is likely caused by altered sexual development and growth hormone secretion, associated with differential activation of xenobiotic receptors. This defines a novel mechanism by which the microbiome regulates host metabolism.
Overview
The claims and statistics of this paper haven’t been checked yet.
Run the check — free, no account needed. It reads the open-access text and checks the sources it cites.
Integrity signals
Registry
Cites
Statistics
Figures
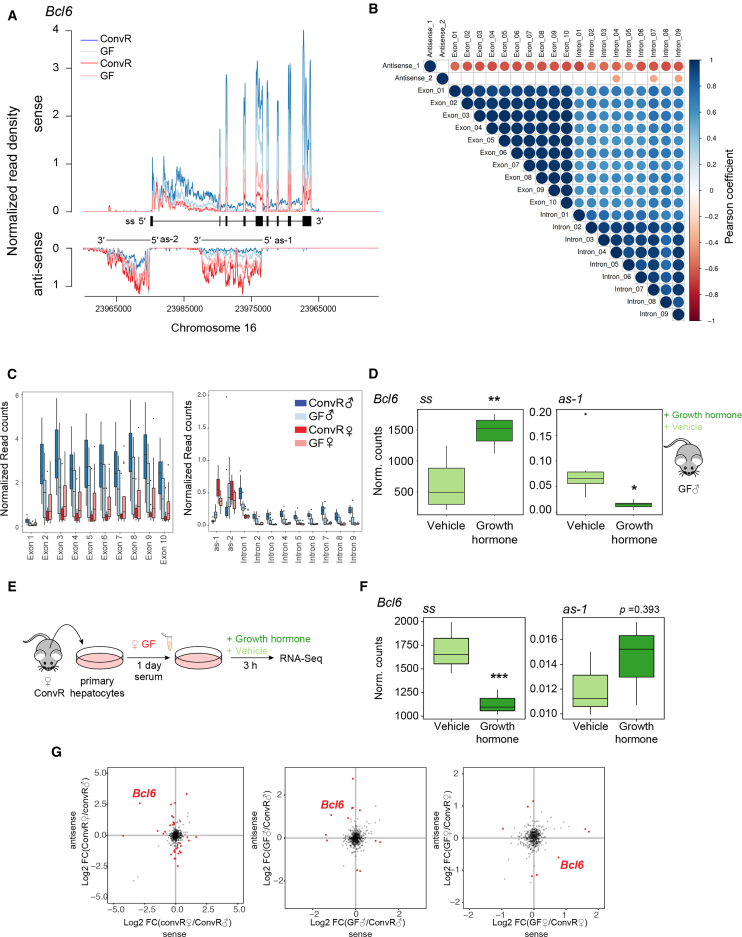
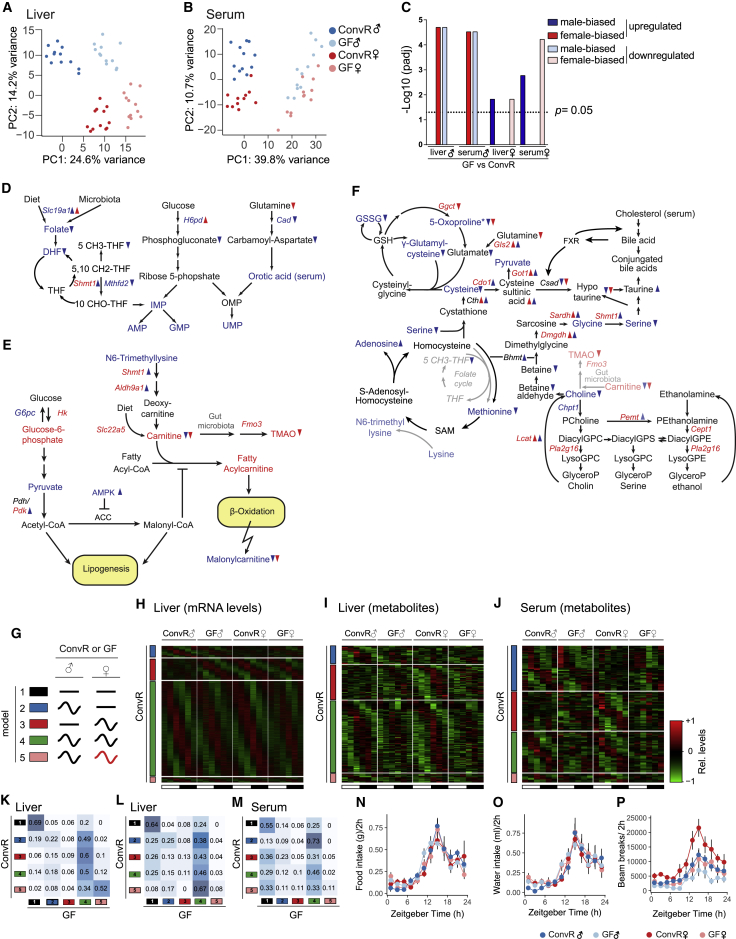
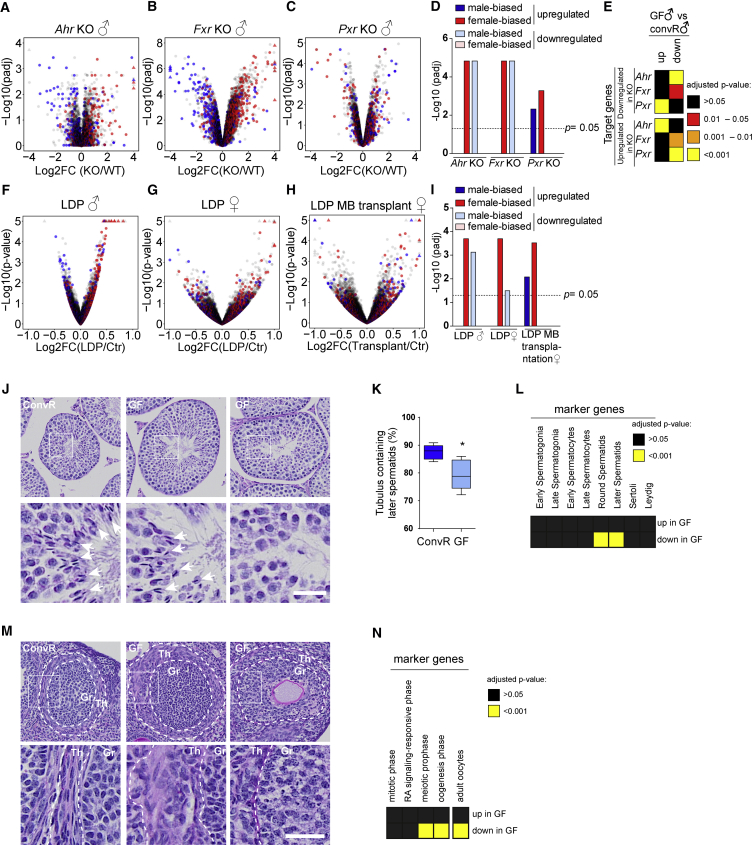
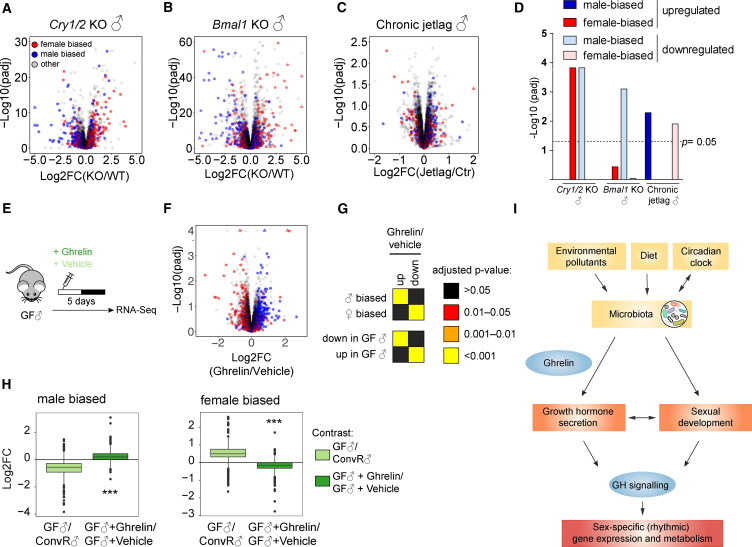
Verification
Claims the paper makes
The claims and statistics of this paper haven’t been checked yet.
Run the check — free, no account needed. It reads the open-access text and checks the sources it cites.
Claims other papers make about this one
Each is checked against this paper’s own text: does it say what the citing paper says it does?
The source backs part of the claim, not all of it — or backs it for a different population, condition or comparison.
In the citing paper
“Lacking exposure to microorganisms since birth, GF animals provide insights into how the microbiota is integral in shaping the behavior, physiology, and neurobiology of its host (Weger et al., 2019).”
From The Microbiota-Gut-Brain Axis (2019) · cites this paper as Weger et al., 2019
Experimental — accuracy not yet measured
Self-check
Percentages, sums and reported differences re-computed from the paper’s own numbers.
The self-check needs the paper’s full text.
Citations
Cites
R: A Language and Environment for Statistical Computing
R Core Team (2000) · doi:10.32614/r.manuals · Cited by 355,893
Controlling the False Discovery Rate: A Practical and Powerful Approach to Multiple Testing
Benjamini, Y., & Hochberg, Y. (1995) · Journal of the Royal Statistical Society Series B: Statistical Methodology · doi:10.1111/j.2517-6161.1995.tb02031.x · Cited by 109,482
Moderated estimation of fold change and dispersion for RNA-seq data with DESeq2
Love, M. I., Huber, W., & Anders, S. (2014) · Genome Biology · doi:10.1186/s13059-014-0550-8 · Cited by 95,106
Fiji: an open-source platform for biological-image analysis
Schindelin, J., Arganda-Carreras, I., Frise, E., Kaynig, V., Longair, M., Pietzsch, T., Preibisch, S., Rueden, C., Saalfeld, S., Schmid, B., et al. (2012) · Nature Methods · doi:10.1038/nmeth.2019 · Cited by 66,890
The Sequence Alignment/Map format and SAMtools
Li, H., Handsaker, B., Wysoker, A., Fennell, T., Ruan, J., Homer, N., Marth, G., Abecasis, G., Durbin, R., & 1000 Genome Project Data Processing Subgroup (2009) · Bioinformatics · doi:10.1093/bioinformatics/btp352 · Cited by 62,041
STAR: ultrafast universal RNA-seq aligner
Dobin, A., Davis, C. A., Schlesinger, F., Drenkow, J., Zaleski, C., Jha, S., Batut, P., Chaisson, M., & Gingeras, T. R. (2013) · Bioinformatics · doi:10.1093/bioinformatics/bts635 · Cited by 51,709
Robinson, M. D., McCarthy, D. J., & Smyth, G. K. (2010) · Bioinformatics · doi:10.1093/bioinformatics/btp616 · Cited by 41,364
limma powers differential expression analyses for RNA-sequencing and microarray studies
Ritchie, M. E., Phipson, B., Wu, D., Hu, Y., Law, C. W., Shi, W., & Smyth, G. K. (2015) · Nucleic Acids Research · doi:10.1093/nar/gkv007 · Cited by 40,458
QIIME allows analysis of high-throughput community sequencing data
Caporaso, J. G., Kuczynski, J., Stombaugh, J., Bittinger, K., Bushman, F. D., Costello, E. K., Fierer, N., Peña, A. G., Goodrich, J. K., Gordon, J. I., et al. (2010) · Nature Methods · doi:10.1038/nmeth.f.303 · Cited by 34,887
Schloss, P. D., Westcott, S. L., Ryabin, T., Hall, J. R., Hartmann, M., Hollister, E. B., Lesniewski, R. A., Oakley, B. B., Parks, D. H., Robinson, C. J., et al. (2009) · Applied and Environmental Microbiology · doi:10.1128/aem.01541-09 · Cited by 19,549
Cited by
Sorted by citations
Cryan, J. F., O'Riordan, K. J., Cowan, C. S. M., Sandhu, K. V., Bastiaanssen, T. F. S., Boehme, M., Codagnone, M. G., Cussotto, S., Fulling, C., Golubeva, A. V., et al. (2019) · Physiological Reviews · doi:10.1152/physrev.00018.2018 · Cited by 5,286
Sex differences in metabolic regulation and diabetes susceptibility
Tramunt, B., Smati, S., Grandgeorge, N., Lenfant, F., Arnal, J.-F., Montagner, A., & Gourdy, P. (2020) · Diabetologia · doi:10.1007/s00125-019-05040-3 · Cited by 923
The circadian regulation of food intake
Challet, E. (2019) · Nature Reviews Endocrinology · doi:10.1038/s41574-019-0210-x · Cited by 428
Mechanisms of sex differences in Alzheimer’s disease
Lopez-Lee, C., Torres, E. R. S., Carling, G., & Gan, L. (2024) · Neuron · doi:10.1016/j.neuron.2024.01.024 · Cited by 376
Sex disparities matter in cancer development and therapy
Haupt, S., Caramia, F., Klein, S. L., Rubin, J. B., & Haupt, Y. (2021) · Nature reviews. Cancer · doi:10.1038/s41568-021-00348-y · Cited by 350
XX sex chromosome complement promotes atherosclerosis in mice
Alsiraj, Y., Chen, X., Thatcher, S. E., Temel, R. E., Cai, L., Blalock, E. M., Katz, W. S., Ali, H., Petriello, M. C., Deng, P., et al. (2019) · Nature Communications · doi:10.1038/s41467-019-10462-z · Cited by 268
Ma, Z., Zuo, T., Frey, N., & Rangrez, A. Y. (2024) · Signal Transduction and Targeted Therapy · doi:10.1038/s41392-024-01946-6 · Cited by 322
The gut microbiota is a major regulator of androgen metabolism in intestinal contents
Colldén, H., Landin, A., Wallenius, V., Elebring, E., Fändriks, L., Nilsson, M. E., Ryberg, H., Poutanen, M., Sjögren, K., Vandenput, L., et al. (2019) · American Journal of Physiology-Endocrinology and Metabolism · doi:10.1152/ajpendo.00338.2019 · Cited by 257
Gender medicine and oncology: report and consensus of an ESMO workshop
Wagner, A. D., Oertelt‐Prigione, S., Adjei, A. A., Buclin, T., Cristina, V., Csajka, C., Coukos, G., Dafni, U., Dotto, G. P., Ducreux, M. P., et al. (2019) · Annals of Oncology · doi:10.1093/annonc/mdz414 · Cited by 215
You’ve got male: Sex and the microbiota-gut-brain axis across the lifespan
Jaggar, M., Rea, K., Spichak, S., Dinan, T. G., & Cryan, J. F. (2020) · Frontiers in Neuroendocrinology · doi:10.1016/j.yfrne.2019.100815 · Cited by 200
When Rhythms Meet the Blues: Circadian Interactions with the Microbiota-Gut-Brain Axis
Teichman, E. M., O’Riordan, K. J., Gahan, C. G. M., Dinan, T. G., & Cryan, J. F. (2020) · Cell Metabolism · doi:10.1016/j.cmet.2020.02.008 · Cited by 199
Gut microbiota as a transducer of dietary cues to regulate host circadian rhythms and metabolism
Choi, H., Rao, M. C., & Chang, E. B. (2021) · Nature Reviews Gastroenterology & Hepatology · doi:10.1038/s41575-021-00452-2 · Cited by 192
Weger, B. D., Gobet, C., David, F. P. A., Atger, F., Martín, E., Phillips, N. E., Charpagne, A., Weger, M., Naef, F., & Gachon, F. (2021) · Proceedings of the National Academy of Sciences · doi:10.1073/pnas.2015803118 · Cited by 195
Self-citationNeuronal Activity Regulates Blood-Brain Barrier Efflux Transport through Endothelial Circadian Genes
Pulido, R. S., Munji, R. N., Chan, T. C., Quirk, C. R., Weiner, G., Weger, B. D., Rossi, M., Elmsaouri, S., Malfavon, M., Deng, A., et al. (2020) · Neuron · doi:10.1016/j.neuron.2020.09.002 · Cited by 178
Self-citationIntersection of the Gut Microbiome and Circadian Rhythms in Metabolism
Frazier, K., & Chang, E. B. (2019) · Trends in Endocrinology and Metabolism · doi:10.1016/j.tem.2019.08.013 · Cited by 171
Sex-dimorphic and age-dependent organization of 24-hour gene expression rhythms in humans
Talamanca, L., Gobet, C., & Naef, F. (2023) · Science · doi:10.1126/science.add0846 · Cited by 175
Self-citationMicrobiota and sleep: awakening the gut feeling
Sen, P., Molinero-Perez, A., O’Riordan, K. J., McCafferty, C. P., O’Halloran, K. D., & Cryan, J. F. (2021) · Trends in Molecular Medicine · doi:10.1016/j.molmed.2021.07.004 · Cited by 168
Circadian clocks in the digestive system
Segers, A., & Depoortere, I. (2021) · Nature Reviews Gastroenterology & Hepatology · doi:10.1038/s41575-020-00401-5 · Cited by 165
Circadian rhythms and the gut microbiome synchronize the host’s metabolic response to diet
Lopez, D. E. G., Lashinger, L. M., Weinstock, G. M., & Bray, M. S. (2021) · Cell Metabolism · doi:10.1016/j.cmet.2021.03.015 · Cited by 166
Sexual dimorphism of metabolic dysfunction-associated steatotic liver disease
Cherubini, A., Torre, S. D., Pelusi, S., & Valenti, L. V. C. (2024) · Trends in Molecular Medicine · doi:10.1016/j.molmed.2024.05.013 · Cited by 164
The microbiome: An emerging key player in aging and longevity
Kim, M., & Benayoun, B. A. (2020) · Translational Medicine of Aging · doi:10.1016/j.tma.2020.07.004 · Cited by 144
Systemic Immunometabolism: Challenges and Opportunities
Lercher, A., Baazim, H., & Bergthaler, A. (2020) · Immunity · doi:10.1016/j.immuni.2020.08.012 · Cited by 144
Dietary vitamin K is remodeled by gut microbiota and influences community composition
Ellis, J. L., Karl, J. P., Oliverio, A., Fu, X., Soares, J. W., Wolfe, B. E., Hernandez, C. J., Mason, J. B., & Booth, S. L. (2021) · Gut Microbes · doi:10.1080/19490976.2021.1887721 · Cited by 131
Spichak, S., Bastiaanssen, T. F. S., Berding, K., Vlckova, K., Clarke, G., Dinan, T. G., & Cryan, J. F. (2021) · Neuroscience & Biobehavioral Reviews · doi:10.1016/j.neubiorev.2021.02.044 · Cited by 127
Berthier, A., Johanns, M., Zummo, F. P., Lefebvre, P., & Staels, B. (2021) · Biochimica et Biophysica Acta (BBA) - Molecular Basis of Disease · doi:10.1016/j.bbadis.2021.166097 · Cited by 125
Exploring the role of gut microbiome in male reproduction
Wang, Y., & Xie, Z. (2021) · Andrology · doi:10.1111/andr.13143 · Cited by 125
Disruption of Circadian Rhythms: A Crucial Factor in the Etiology of Infertility
Sciarra, F., Franceschini, E., Campolo, F., Gianfrilli, D., Pallotti, F., Paoli, D., Isidori, A. M., & Venneri, M. A. (2020) · International Journal of Molecular Sciences · doi:10.3390/ijms21113943 · Cited by 132
Sexual dimorphism in glucose metabolism is shaped by androgen-driven gut microbiome
Gao, A., Su, J., Liu, R., Zhao, S., Wen, L., Xu, X., Li, D., Shi, J., Gu, B., Zhang, J., et al. (2021) · Nature Communications · doi:10.1038/s41467-021-27187-7 · Cited by 123
Diet and feeding pattern modulate diurnal dynamics of the ileal microbiome and transcriptome
Machado, A. C. D., Brown, S. D., Lingaraju, A., Sivaganesh, V., Martino, C., Chaix, A., Zhao, P., Pinto, A. F. M., Chang, M. W., Richter, R. A., et al. (2022) · Cell Reports · doi:10.1016/j.celrep.2022.111008 · Cited by 114
Gut microbiota–driven brain Aβ amyloidosis in mice requires microglia
Dodiya, H. B., Lutz, H. L., Weigle, I. Q., Patel, P., Michalkiewicz, J., Roman-Santiago, C. J., Zhang, C. M., Liang, Y., Srinath, A., Zhang, X., et al. (2022) · Journal of Experimental Medicine · doi:10.1084/jem.20200895 · Cited by 120
Torre, S. D. (2020) · Frontiers in Endocrinology · doi:10.3389/fendo.2020.572490 · Cited by 125
Hepatic sexual dimorphism — implications for non-alcoholic fatty liver disease
Lefèbvre, P., & Staels, B. (2021) · Nature Reviews Endocrinology · doi:10.1038/s41574-021-00538-6 · Cited by 121
A circadian clock is essential for homeostasis of group 3 innate lymphoid cells in the gut
Teng, F., Goc, J., Zhou, L., Chu, C., Shah, M. A., Eberl, G., & Sonnenberg, G. F. (2019) · Science Immunology · doi:10.1126/sciimmunol.aax1215 · Cited by 112
The Microbiota and the Gut–Brain Axis in Controlling Food Intake and Energy Homeostasis
Romaní‐Pérez, M., Bullich‐Vilarrubias, C., López‐Almela, I., Liébana-García, R., Olivares, M., & Sanz, Y. (2021) · International Journal of Molecular Sciences · doi:10.3390/ijms22115830 · Cited by 117
Jouffe, C., Weger, B. D., Martín, E., Atger, F., Weger, M., Gobet, C., Ramnath, D., Charpagne, A., Morin‐Rivron, D., Powell, E. E., et al. (2022) · Proceedings of the National Academy of Sciences · doi:10.1073/pnas.2200083119 · Cited by 112
Self-citationSex Differences in Circadian RhythmsPreprint
Walton, J. C., Bumgarner, J. R., & Nelson, R. J. (2022) · Cold Spring Harbor Perspectives in Biology · doi:10.1101/cshperspect.a039107 · Cited by 103
Circadian Regulation of Drug Responses: Toward Sex-Specific and Personalized Chronotherapy
Lévi, F., Okyar, A., Hadadi, É., Innominato, P. F., & Ballesta, A. (2023) · The Annual Review of Pharmacology and Toxicology · doi:10.1146/annurev-pharmtox-051920-095416 · Cited by 104
Circadian regulation of liver function: from molecular mechanisms to disease pathophysiology
Bolshette, N. B., Ibrahim, H., Reinke, H., & Asher, G. (2023) · Nature Reviews Gastroenterology & Hepatology · doi:10.1038/s41575-023-00792-1 · Cited by 109
Microbiome diurnal rhythmicity and its impact on host physiology and disease risk
Nobs, S. P., Tuganbaev, T., & Elinav, E. (2019) · EMBO Reports · doi:10.15252/embr.201847129 · Cited by 91
Baseline microbiota composition modulates antibiotic-mediated effects on the gut microbiota and host
Lavelle, A., Hoffmann, T. W., Pham, H., Langella, P., Guédon, É., & Sokol, H. (2019) · Microbiome · doi:10.1186/s40168-019-0725-3 · Cited by 93
Vagnerová, K., Vodička, M., Hermanová, P. P., Ergang, P., Šrůtková, D., Klusoňová, P., Balounová, K., Hudcovic, T., & Pácha, J. (2019) · Frontiers in Immunology · doi:10.3389/fimmu.2019.02655 · Cited by 95
Stokes, K., Nunes, M., Trombley, C., Flôres, D. E. F. L., Wu, G., Taleb, Z., Alkhateeb, A., Banskota, S., Harris, C. R., Love, O. P., et al. (2021) · Cellular and Molecular Gastroenterology and Hepatology · doi:10.1016/j.jcmgh.2021.08.001 · Cited by 96
Complex physiology and clinical implications of time-restricted eating
Petersen, M. C., Gallop, M. R., Ramos, S. F., Zarrinpar, A., Broussard, J. L., Chondronikola, M., Chaix, A., & Klein, S. (2022) · Physiological Reviews · doi:10.1152/physrev.00006.2022 · Cited by 94
Sexual dimorphism in body clocks
Anderson, S. T., & FitzGerald, G. A. (2020) · Science · doi:10.1126/science.abd4964 · Cited by 86
Regulation of CAR and PXR Expression in Health and Disease
Daujat‐Chavanieu, M., & Gerbal‐Chaloin, S. (2020) · Cells · doi:10.3390/cells9112395 · Cited by 87
Bmal1 regulates circadian expression of cytochrome P450 3a11 and drug metabolism in mice
Lin, Y., Wang, S., Zhou, Z., Guo, L., Yu, F., & Wu, B. (2019) · Communications Biology · doi:10.1038/s42003-019-0607-z · Cited by 91
Beyond the X Factor: Relevance of Sex Hormones in NAFLD Pathophysiology
Torre, S. D. (2021) · Cells · doi:10.3390/cells10092502 · Cited by 91
Thompson, R. S., Gaffney, M., Hopkins, S., Kelley, T., González, A., Bowers, S. J., Vitaterna, M. H., Turek, F. W., Foxx, C. L., Lowry, C. A., et al. (2021) · Brain Behavior and Immunity · doi:10.1016/j.bbi.2021.07.006 · Cited by 82
Yang, K., Li, G., Li, Q., Wang, W., Zhao, X. X., Shao, N., Qiu, H., Liu, J., Xu, L., & Zhao, J. (2025) · Cell & Bioscience · doi:10.1186/s13578-025-01385-y · Cited by 99
The microbiome stabilizes circadian rhythms in the gut
Zhang, Y., Li, Y., Barber, A. F., Noya, S. B., Williams, J. A., Li, F., Daniel, S. G., Bittinger, K. L., Fang, J., & Sehgal, A. (2023) · Proceedings of the National Academy of Sciences · doi:10.1073/pnas.2217532120 · Cited by 74
Jensen, E., Young, J. A., Mathes, S. C., List, E. O., Carroll, R. K., Kuhn, J., Onusko, M., Kopchick, J. J., Murphy, E. R., & Berryman, D. E. (2020) · Growth Hormone & IGF Research · doi:10.1016/j.ghir.2020.101333 · Cited by 81
Guislain, P. (1997) · Cited by 71
The Dimension of Time in Host-Microbiome Interactions
Uhr, G. T., Dohnalová, L., & Thaiss, C. A. (2019) · mSystems · doi:10.1128/msystems.00216-18 · Cited by 70
Codoñer‐Franch, P., Gombert, M., Martínez-Raga, J., & Cénit, M. C. (2023) · International Journal of Molecular Sciences · doi:10.3390/ijms24087579 · Cited by 74
Microbiota and body weight control: Weight watchers within?
Boscaini, S., Leigh, S., Lavelle, A., García‐Cabrerizo, R., Lipuma, T., Clarke, G. A., Schellekens, H., & Cryan, J. F. (2021) · Molecular Metabolism · doi:10.1016/j.molmet.2021.101427 · Cited by 67
Circadian Clocks Make Metabolism Run
Sinturel, F., Petrenko, V., & Dibner, C. (2020) · Journal of Molecular Biology · doi:10.1016/j.jmb.2020.01.018 · Cited by 66
Sex differences in daily timekeeping and circadian clock circuits
Joye, D. A. M., & Evans, J. A. (2021) · Seminars in Cell and Developmental Biology · doi:10.1016/j.semcdb.2021.04.026 · Cited by 61
Circadian Rhythms and the Gastrointestinal Tract: Relationship to Metabolism and Gut Hormones
Martchenko, A., Martchenko, S. E., Biancolin, A. D., & Brubaker, P. L. (2020) · Endocrinology · doi:10.1210/endocr/bqaa167 · Cited by 61
Crosstalk between circadian rhythms and the microbiota
Pearson, J. A., Wong, F. S., & Li, W. (2020) · Immunology · doi:10.1111/imm.13278 · Cited by 60
A lipidome landscape of aging in mice
Tsugawa, H., Ishihara, T., Ogasa, K., Iwanami, S., Hori, A., Takahashi, M., Yamada, Y., Satoh‐Takayama, N., Ohno, H., Minoda, A., et al. (2024) · Nature Aging · doi:10.1038/s43587-024-00610-6 · Cited by 64
Xin, H., Deng, F., Zhou, M., Huang, R., Ma, X., Tian, H., Tan, Y. H., Chen, X., Deng, D., Shui, G., et al. (2021) · iScience · doi:10.1016/j.isci.2021.102335 · Cited by 65
Dynamic Changes of Gut Microbial Communities of Bumble Bee Queens through Important Life Stages
Wang, L., Wu, J., Li, K., Sadd, B. M., Guo, Y., Zhuang, D., Zhang, Z., Chen, Y., Evans, J. D., Guo, J., et al. (2019) · mSystems · doi:10.1128/msystems.00631-19 · Cited by 56
The Circadian Clock as an Essential Molecular Link Between Host Physiology and Microorganisms
Murakami, M., & Tognini, P. (2020) · Frontiers in Cellular and Infection Microbiology · doi:10.3389/fcimb.2019.00469 · Cited by 58
Microbial endocrinology: the mechanisms by which the microbiota influences host sex steroids
Cotton, S., Clayton, C. A., & Tropini, C. (2023) · Trends in Microbiology · doi:10.1016/j.tim.2023.03.010 · Cited by 58
The Oscillating Gut Microbiome and Its Effects on Host Circadian Biology
Litichevskiy, L., & Thaiss, C. A. (2022) · Annual Review of Nutrition · doi:10.1146/annurev-nutr-062320-111321 · Cited by 58
Time of sample collection is critical for the replicability of microbiome analyses
Allaband, C., Lingaraju, A., Ramos, S. F., Kumar, T., Javaheri, H., Tiu, M. D., Machado, A. C. D., Richter, R. A., Elijah, E. O., Haddad, G. G., et al. (2024) · Nature Metabolism · doi:10.1038/s42255-024-01064-1 · Cited by 61
Sex as a Biological Variable in Nutrition Research: From Human Studies to Animal Models
Chen, Y., Kim, M., Paye, S. M., & Benayoun, B. A. (2022) · Annual Review of Nutrition · doi:10.1146/annurev-nutr-062220-105852 · Cited by 59
Daas, M. C., & de Roos, N. M. (2021) · Beneficial Microbes · doi:10.3920/bm2020.0149 · Cited by 58
Gut microbes and the liver circadian clock partition glucose and lipid metabolism
Frazier, K., Manzoor, S. S., Carroll, K., DeLeon, O., Miyoshi, S., Miyoshi, J., George, M. S., Tan, A., Chrisler, E. A., Izumo, M., et al. (2023) · Journal of Clinical Investigation · doi:10.1172/jci162515 · Cited by 58
Obesity and male fertility disorders
Cannarella, R., Crafa, A., Curto, R., Condorelli, R. A., Vignera, S. L., & Calogero, A. E. (2024) · Molecular Aspects of Medicine · doi:10.1016/j.mam.2024.101273 · Cited by 63
Gut Microbiota and Alzheimer’s Disease: How to Study and Apply Their Relationship
Nguyen, N. M., Cho, J., & Lee, C.-H. (2023) · International Journal of Molecular Sciences · doi:10.3390/ijms24044047 · Cited by 60
Circadian clock communication during homeostasis and ageing
Mortimer, T., Smith, J. G., Muñoz‐Cánoves, P., & Benitah, S. A. (2025) · Nature Reviews Molecular Cell Biology · doi:10.1038/s41580-024-00802-3 · Cited by 60
Reprogramming of rhythmic liver metabolism by intestinal clock
Chen, M., Lin, Y., Dang, Y., Xiao, Y., Zhang, F., Sun, G., Jiang, X., Zhang, L., Du, J., Duan, S., et al. (2023) · Journal of Hepatology · doi:10.1016/j.jhep.2023.04.040 · Cited by 51
Vornhagen, J., Bassis, C. M., Ramakrishnan, S., Hein, R., Mason, S., Bergman, Y., Sunshine, N., Fan, Y., Holmes, C. L., Timp, W., et al. (2021) · PLoS Pathogens · doi:10.1371/journal.ppat.1009537 · Cited by 51
Reciprocal Interactions between Circadian Clocks, Food Intake, and Energy Metabolism
Grosjean, E., Simonneaux, V., & Challet, É. (2023) · Biology · doi:10.3390/biology12040539 · Cited by 55
Gut Microbiota and Microbial Metabolism in Early Risk of Cardiometabolic Disease
Gabriel, C. L., & Ferguson, J. F. (2023) · Circulation Research · doi:10.1161/circresaha.123.322055 · Cited by 51
Spinal cord injury and gut microbiota: A review
Jing, Y., Bai, F., & Yu, Y. (2020) · Life Sciences · doi:10.1016/j.lfs.2020.118865 · Cited by 49
Magueresse‐Battistoni, B. L. (2020) · Chemosphere · doi:10.1016/j.chemosphere.2020.129212 · Cited by 47
Pregnane X Receptor and the Gut-Liver Axis: A Recent Update
Dutta, M., Lim, J. J., & Cui, J. Y. (2021) · Drug Metabolism and Disposition · doi:10.1124/dmd.121.000415 · Cited by 48
Are There Circadian Clocks in Non-Photosynthetic Bacteria?
Sartor, F., Eelderink-Chen, Z., Aronson, B., Bosman, J., Hibbert, L. E., Dodd, A. N., Kovács, Á. T., & Merrow, M. W. (2019) · Biology · doi:10.3390/biology8020041 · Cited by 46
Growth Hormone Deficiency and Excess Alter the Gut Microbiome in Adult Male Mice
Jensen, E., Young, J. A., Jackson, Z., Busken, J., List, E. O., Carroll, R. K., Kopchick, J. J., Murphy, E. R., & Berryman, D. E. (2020) · Endocrinology · doi:10.1210/endocr/bqaa026 · Cited by 42
Nohara, K., Nemkov, T. G., D’Alessandro, A., Yoo, S. H., & Chen, Z. (2019) · International Journal of Molecular Sciences · doi:10.3390/ijms20174281 · Cited by 42
The Microbiome as a Circadian Coordinator of Metabolism
Alvarez, Y., Glotfelty, L., Blank, N., Dohnalová, L., & Thaiss, C. A. (2020) · Endocrinology · doi:10.1210/endocr/bqaa059 · Cited by 39
Sex disparities in mortality and cardiovascular outcomes in chronic kidney disease
Balafa, O. C., Fernández‐Fernández, B., Ortíz, A., Dounousi, E. C., Ekart, R., Ferro, C. J., Mark, P. B., Valdivielso, J. M., Vecchio, L. D., & Mallamaci, F. (2024) · Clinical Kidney Journal · doi:10.1093/ckj/sfae044 · Cited by 42
Microbial Reconstitution Improves Aging-Driven Lacrimal Gland Circadian Dysfunction
Jiao, X., Pei, X., Lu, D., Qi, D., Huang, S., He, S., & Li, Z. (2021) · American Journal Of Pathology · doi:10.1016/j.ajpath.2021.08.006 · Cited by 40
The role of the circadian timing system on drug metabolism and detoxification: an update
Okyar, A., Civelek, D. Ö., Akyel, Y. K., Sürme, S., Kara, Z. P., & Kavaklı, İ. H. (2024) · Expert Opinion on Drug Metabolism & Toxicology · doi:10.1080/17425255.2024.2356167 · Cited by 39
Hepatic immune regulation and sex disparities
Burra, P., Zanetto, A., Schnabl, B., Reiberger, T., Montaño‐Loza, A. J., Asselta, R., Karlsen, T. H., & Tacke, F. (2024) · Nature Reviews Gastroenterology & Hepatology · doi:10.1038/s41575-024-00974-5 · Cited by 43
Microbial circadian clocks: host-microbe interplay in diel cycles
Wollmuth, E. M., & Angert, E. R. (2023) · BMC Microbiology · doi:10.1186/s12866-023-02839-4 · Cited by 40
Endogenous circadian time genes expressions in the liver of mice under constant darkness
Li, H., Zhang, S., Zhang, W., Chen, S., Rabearivony, A., Shi, Y., Liu, J., Corton, C. J., & Liu, C. (2020) · BMC Genomics · doi:10.1186/s12864-020-6639-4 · Cited by 38
BMAL1 Regulates the Daily Timing of Colitis
Taleb, Z., Carmona‐Alcocer, V., Stokes, K., Haireek, M., Wang, H., Collins, S. M., Khan, W. I., & Karpowicz, P. A. (2022) · Frontiers in Cellular and Infection Microbiology · doi:10.3389/fcimb.2022.773413 · Cited by 37
Alterations of brain endocannabinoidome signaling in germ-free mice
Manca, C., Shen, M., Boubertakh, B., Martin, C., Flamand, N., Silvestri, C., & Marzo, V. D. (2020) · Biochimica et Biophysica Acta (BBA) - Molecular and Cell Biology of Lipids · doi:10.1016/j.bbalip.2020.158786 · Cited by 35
Multi-omics profiling reveals rhythmic liver function shaped by meal timing
Huang, R., Chen, J., Zhou, M., Xin, H., Lam, S. M., Jiang, X., Li, J., Deng, F., Shui, G., Zhang, Z., et al. (2023) · Nature Communications · doi:10.1038/s41467-023-41759-9 · Cited by 38
Edwards, J. M., Roy, S., Tomcho, J. C., Schreckenberger, Z. J., Chakraborty, S., Bearss, N. R., Saha, P., McCarthy, C. G., Vijay–Kumar, M., Joe, B., et al. (2019) · Vascular Pharmacology · doi:10.1016/j.vph.2019.106633 · Cited by 35
How gut microbiome interactions affect nutritional traits of Drosophila melanogaster
McMullen, J. G., Peters-Schulze, G., Cai, J., Patterson, A. D., & Douglas, A. E. (2020) · Journal of Experimental Biology · doi:10.1242/jeb.227843 · Cited by 36
Barretto, S. A., Lasserre, F., Huillet, M., Régnier, M., Polizzi, A., Lippi, Y., Fougerat, A., Person, E., Bruel, S., Bétoulières, C., et al. (2021) · Microbiome · doi:10.1186/s40168-021-01050-9 · Cited by 42
Hallmarks of the human intestinal microbiome on liver maturation and function
Almeida, J. I., Tenreiro, M. F., Martínez‐Santamaría, L., Guerrero‐Aspizua, S., Gisbert, J. P., Alves, P. M., Serra, M., & Baptista, P. M. (2021) · Journal of Hepatology · doi:10.1016/j.jhep.2021.10.015 · Cited by 37
The associations of gut microbiota, endocrine system and bone metabolism
Tu, Y., Kuang, X., Zhang, L., & Xu, X. (2023) · Frontiers in Microbiology · doi:10.3389/fmicb.2023.1124945 · Cited by 34
Time after time: circadian clock regulation of intestinal stem cells
Parasram, K., & Karpowicz, P. A. (2019) · Cellular and Molecular Life Sciences · doi:10.1007/s00018-019-03323-x · Cited by 34
Microbes in the Era of Circadian Medicine
Costantini, C., Renga, G., Sellitto, F., Borghi, M., Stincardini, C., Pariano, M., Zelante, T., Chiarotti, F., Bartoli, A., Mosci, P., et al. (2020) · Frontiers in Cellular and Infection Microbiology · doi:10.3389/fcimb.2020.00030 · Cited by 35
Bidirectional relationships between the gut microbiome and sexual traits
del Castillo-Izquierdo, Á., Mayneris‐Perxachs, J., & Fernández‐Real, J. M. (2022) · American Journal of Physiology-Cell Physiology · doi:10.1152/ajpcell.00116.2022 · Cited by 35
Metadata
- Authors
- Weger, B. D., Gobet, C., Yeung, J., Martin, E., Jimenez, S., Betrisey, B., Foata, F., Berger, B., Balvay, A., Foussier, A., Charpagne, A., Boizet-Bonhoure, B., Chou, C. J., Naef, F., & Gachon, F.
- Affiliations
- Centre Hospitalier Universitaire Vaudois (CH)
- École Polytechnique Fédérale de Lausanne (CH)
- Nestlé (Switzerland) (CH)
- AgroParisTech (FR)
- Corresponding author
- Gachon, Frédéric
- ORCID
- Venue
- Cell Metabolism
- Publisher
- Elsevier BV
- Published
- 2019-02
- Volume
- 29
- Issue
- 2
- Pages
- 362-382.e8
- ISSN
- 1550-4131 (ISSN-L)
- PMC
- PMC6370974
- OpenAlex
- W2897926834
- Cited by
- 269
- References
- 193
- Citations by year
- 2026: 23 · 2025: 32 · 2024: 33 · 2023: 37 · 2022: 31 · 2021: 44 · 2020: 39 · 2019: 26
- FWCI
- 10.14
- Type
- journal article
- Language
- en
- Open access
- hybrid
- doi.org
- Licence
- Locations
- Cell Metabolism (publishedVersion, cc-by-nc-nd)
- Europe PMC (PubMed Central) (publishedVersion, cc-by-nc-nd)
- PubMed Central (publishedVersion, cc-by-nc-nd)
- PubMed (publishedVersion)
- Infoscience (Ecole Polytechnique Fédérale de Lausanne) (submittedVersion, cc-by-nc-nd)
- HAL (submittedVersion, cc-by-nc-nd)
- Funders
- European Research Council (ERC-2010-StG-260988)
- Swiss National Science Foundation (310030_173079)
- Natural Sciences and Engineering Research Council of Canada
- Topics
- Life Sciences › Biochemistry, Genetics and Molecular Biology › Molecular Biology › Gut microbiota and health
- Life Sciences › Neuroscience › Endocrine and Autonomic Systems › Circadian rhythm and melatonin
- Life Sciences › Agricultural and Biological Sciences › Animal Science and Zoology › Animal Nutrition and Physiology
- Keywords
- gut microbiota, circadian clock, sex differences, germ-free mice, growth hormone secretion, xenobiotic receptors, sexual development, metabolism, transcriptome, metabolome
- MeSH terms
- Gastrointestinal Microbiome, Animals, Circadian Rhythm, Female, Intestines, Liver, Male, Mice, Inbred C57BL, Sex Characteristics, Mice, Adipose Tissue, White, Ghrelin, Circadian Clocks, Transcriptome
About these checks
Registry, retraction, Cites and statistics results are computed, not judged, with one exception: a printed reference that no index lists is read once by a model before it counts as a citation error. Claims are extracted by a model and kept only when their quote appears verbatim in the text; each cited source is then checked, with a model’s help, for whether it says what the claim relies on. Those verdicts can be wrong — read the claim’s quote and the cited source before relying on one.
Statistics and arithmetic are recomputed, not judged.
Confidence bands are shown only for fields calibrated on our annotated test set. None is calibrated yet, so no band is shown.
What counts as a claim ›How we measure confidence ›How we check this ›
Are you an author, or do you see a problem with this page? Request a review
